Alzheimer’s Disease
HISTORIC PERSPECTIVE
Human Longevity
Although historic records indicate that older people have always existed, old age was once rare. Before the 20th century, few people lived beyond 50 years. Now, 95% of the children born in developed countries live past that age (Figure 24.1). Changes in health care, sanitation, and nutrition (to name a few) have had a profound impact on life expectancy. The ultimate result is that more and more people are living to ripe old ages. With more people living into their geriatric years, the agingrelated central nervous system (CNS) disorders are becoming common.
All nerve cells are affected by aging. Sensory and motor skills decline with age. Neurodegenerative disorders such as Parkinson’s disease, amyotrophic lateral sclerosis, and Huntington’s disease become more prevalent as people get older. Cellular and molecular changes that accumulate over time render neurons vulnerable to damage. Most likely, the damage results from a combination of genetic vulnerability and environmental hits.
 FIGURE 24.1 • The percentage of people living beyond the age of 60 years has increased dramatically in the last two centuries. (Adapted from Kandel ER, Schwartz JH, Jessell TM, eds. Principles of Neural Science. 4th ed. New York, NY: McGraw-Hill; 2000.) |
POINT OF INTEREST
The maximum human life span is approximately 125 years and has not changed in over 100,000 years. Cell culture studies suggest that each species has a biologic clock that influences its life span. For example, fibroblasts will only divide a limited number of times before dying. The number of divisions is related to life span (see table).
Lifespan and Cell Division of Different Species
|
The important point is that life span and age-related illnesses such as dementia are likely to be controlled by different mechanisms.
Dementia, the progressive deterioration of cognitive skills, is perhaps the most worrisome development for all of us. There are numerous causes of dementia, including cerebral vascular accidents, alcoholism, and infections. Alzheimer’s disease (AD) is the most common cause of dementia. The surge in dementia cases as the baby boomers age is expected to overwhelm the health care system unless some intervention is discovered.
Alois Alzheimer
The disease we now call Alzheimer’s was first discussed when Alois Alzheimer presented a case in 1906 of a woman with the early onset of dementia. Her symptoms started in middle age with a change in personality and mild memory impairment. She was institutionalized when she became paranoid and unmanageable. Alzheimer repeatedly examined the woman as he followed up her deteriorating clinical course. Four and a half years after her initial symptoms, she was bedridden in a fetal position until she died.
The autopsy revealed gross atrophy of the cortex without localized foci. With the application of the new staining methods (see Figure 1.4), Alzheimer found sclerotic plaques scattered throughout the cortex, especially in the upper layers. Additionally, he noted that many of the cortical neurons were reduced to dense bundles of neurofibrils. Alzheimer thought that his description of plaques and neurofibrillary tangles in a patient with “presenile dementia” was a new and unique condition.
In fact, Alzheimer’s finding was cognitive loss associated with the following:
Cortical atrophy
Plaques outside the neurons
Tangles inside the neurons
These findings have become the description of the dementia that bears his name. Figure 24.2 shows a schematic representation of what Alzheimer might have seen when he looked through his microscope.
ALZHEIMER’S DISEASE
Surprisingly, what Alzheimer saw roughly a 100 years ago remains the focus of current research. However, the application of modern technology has greatly advanced the understanding of the pathophysiology of atrophy, plaques, and tangles.
Cortical Atrophy
The most striking feature of the Alzheimer’s brain is the dramatic shrinkage of the cortical tissue secondary to neuronal cell death. AD is a bit like losing hair. It starts years before it is actually noticed and progresses slowly. In some people, it starts sooner and proceeds faster. Furthermore, almost everyone experiences some hair loss with aging.
Brain volume loss is also a “normal” feature of aging. Brain volume peaks in adolescence and then declines as much as 0.2% to 0.5% per year. Patients with AD experience accelerated neural loss. Likewise, some people are genetically predisposed to early-onset AD.
Examination of the AD brain at autopsy shows extensive atrophy. Figure 24.3 compares two views of normal brains with AD brains. The enlargement of the ventricles and sulci in combination with the decreased tissue is easily recognized—and a bit unsettling for those of us in middle age.
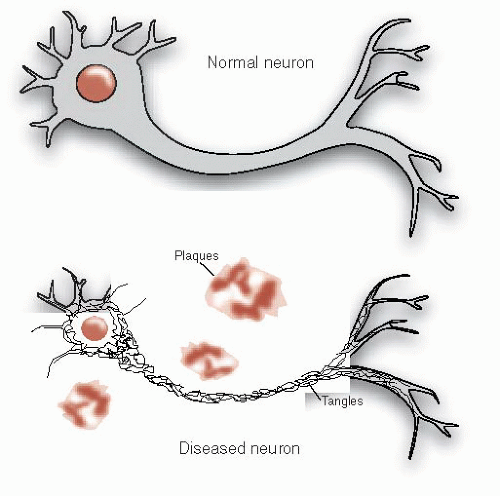 FIGURE 24.2 • Alzheimer’s disease includes the constellation of neuronal shrinkage, plaques, and neurofibrillary tangles. |
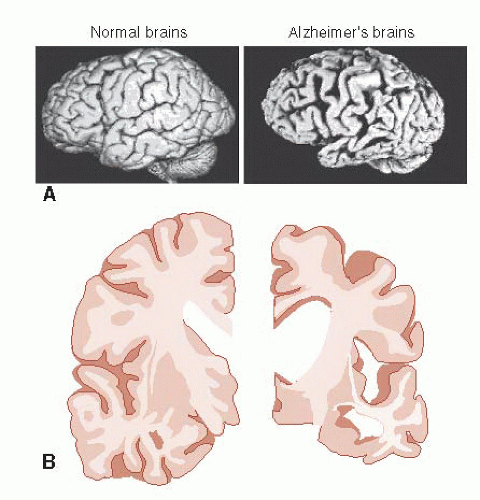 FIGURE 24.3 • Gross examination (A) and coronal slices (B) show the extensive shrinkage of the brain from Alzheimer’s disease. (A courtesy of George Grossberg and the St. Louis University Alzheimer’s Brain Bank.) |
Brain imaging, although not yet diagnostic for early AD, can document the volume loss and contrast the changes for those with and without AD. Figure 24.4 shows the results of sequential magnetic resonance imaging on one patient destined to develop familial AD. Note how his brain atrophy proceeds faster than in a healthy elderly control. It is also of interest that the symptoms of AD did not appear until significant brain tissue was lost.
The decrease in energy metabolism secondary to the extensive neuronal damage can be seen in functional imaging studies such as positron emission tomography (PET). Figure 24.5 shows the marked reduction in glucose metabolism in a patient with AD compared with a healthy control. The difference is so prominent that some have suggested that PET could be used to differentiate patients with AD from those normally aging. A large European study including more than 500 subjects found a 93% sensitivity and specificity for separating mild to moderate AD from normal controls. Unfortunately, they were not as effective at separating AD from other forms of dementia, and PET is even less helpful in diagnosing patients with mild cognitive impairment and determining whether they will go on to develop AD.
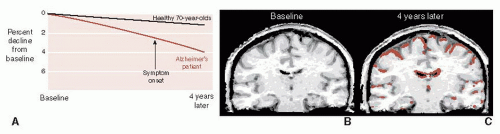 FIGURE 24.4 • A. Sequential magnetic resonance imaging (MRI) scans show the aggressive brain atrophy in a patient with Alzheimer’s disease (AD) compared with healthy geriatric controls. B. MRI in a patient with AD at baseline and 4 years later (C). Brown overlay represents tissue loss compared with baseline. (Adapted from Fox NC, Schott JM. Imaging cerebral atrophy: normal ageing to Alzheimer’s disease. Lancet. 2004;363(9406):392-394.) |
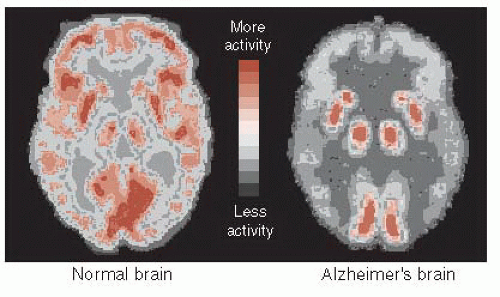 FIGURE 24.5 • Positron emission tomography (PET) images showing glucose metabolism in a normal brain compared with an Alzheimer’s disease brain. Note the reduced activity in the frontal and temporal regions of the AD brain. (Adapted from Mattson MP, Magnus T. Ageing and neuronal vulnerability. Nat Rev Neurosci. 2006;7[4]:278-294.) |
Amyloid Plaques
The extracellular deposits that Alzheimer saw are called amyloid plaques, which is a bit of a misnomer. They are actually aggregates of fibrous protein and not amyloid at all. It was not until 1984 that the primary component of the plaques was found to be a small protein called amyloid-β or A-β. (To add to the confusion, the most common term used in the literature is beta-amyloid or β-amyloid.) Specifically, it is a long 42-amino-acid chain called A-β-42 that seems to be the real culprit, although there may be others that are more noxious.
 FIGURE 24.6 • Amyloid plaques are formed from the cleavage of amyloid-β precursor protein into smaller proteins that clump together. (Adapted from Wolfe MS. Shutting down Alzheimer’s. Sci Am. 2006;294(5):72-79.) |
A-β is cleaved from a larger molecule called amyloid-β precursor protein (APP). APP is a large protein protruding through the cell wall (Figure 24.6). It is found in cells throughout the body, but is prominent in neurons. The functions of APP are not fully understood, but may include regulating neuronal survival, neural neurite outgrowth, and synaptic plasticity.
APP is cleaved into smaller portions by at least two enzymes called β- and γ-secretase. The final cleavage results in the generation of A-β-42 (and others) that coalesces into long filaments. It is the clumping of the filaments that forms the “amyloid” plaques. Pharmacologic inhibition of the activity of the secretase enzymes has been of interest to those seeking ways to slow down the development of plaques.
Amyloid Hypothesis
Many believe that amyloid plaques are the source of the problem with AD. Two lines of reasoning suggest this is true. First, some people carry a genetic predisposition for early-onset AD usually developed before the age of 65 years. In all cases where they have identified the gene, the genetic abnormality causes an increased production of A-β. The toxicity of A-β is the other evidence that supports the amyloid hypothesis. A-β is toxic to neurons grown in Petri dishes. Furthermore, A-β can impair the development of long-term potentiation as well as the memory for a maze in rodents.
Related posts:


Stay updated, free articles. Join our Telegram channel

Full access? Get Clinical Tree


