The probability with which the molecule is found in one of the two states (bound or unbound) depends on the equilibrium constant (K), which equals the association rate constant (k1) divided by the dissociation rate constant (k2). Equilibrium is reached if k1 × A × B = k2 × AB.
The concentration of an immune complex (AB) in equilibrium depends on both the equilibrium constant (affinity) and the concentrations of antigen and antibody.
The practical consequence is that raising the antibody concentration in the solution (e. g., at low antigen concentration) has the effect that more immune complex is formed: the velocity (v= k1 × Ag × Ab) rises as the antibody concentration rises, and the equilibrium shifts in the direction of the immune complex (Ag-Ab), increasing the sensitivity of the test.
Avidity. Since both viral epitopes and antibody molecules are multivalent, their association calls for a more general presentation of the equilibrium constant, i. e., one that incorporates the effective antibody valency and the effective antigen valency. The maximum valency of the IgG molecule is 2, that of the IgA molecule is 4, and that of the IgM molecule is 5. The effective valency of viruses (with up to 1000 identical antigenic subunits) depends very much on the steric hindrance between the antibody molecules on adjacent epitopes. This physically somewhat imprecise overall attraction between an antibody and a complex antigen is called avidity (rather than affinity). For methods of determining avidity, see Gharavi and Reiber (1996).
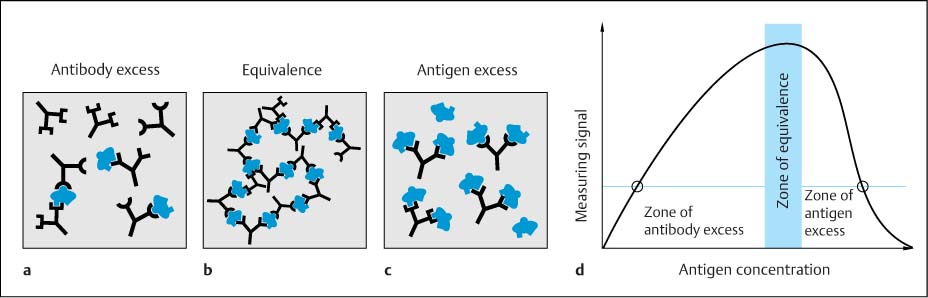
Fig. 4.1 a–d Formation of immune complexes.
a Antibody excess.
b Equivalence (optimal for precipitation).
c Antigen excess (impedes cross-linking).
d Heidelberger-Kendall curve for the intensity of scattered light as a function of antigen concentration at constant antibody concentration. Methodologically, the measuring method needs to avoid the zone of antigen excess because of the falsely low concentration measurements that result: the signal measured in this zone (right-hand point) mimics a 10-fold lower antigen concentration (left-hand point).
Specificity. The binding strength (avidity) of two macroglobulins grows with increasing numbers of complementary binding sites. This capacity of the macromolecules to reduce the dissociation constant significantly is a newly emerging property known as the binding specificity between two molecules. This means that an antibody’s specificity (a quality) for a given antigen is defined by its higher affinity (a quantity) for it, compared to its affinities for other antigens.
Cross-reactivity is therefore only a question of avidity: i. e., the chances of cross-reactivity increase with decreasing avidity of the antibody.
Epitopes and Antigen–Antibody Complex
Epitopes. Proteins carry several antigenic determinants (epitopes) on their surface. These epitopes are limited structures formed by 6–8 amino acids or by carbohydrate residues. The protein–protein interaction is based on:
• Formation of noncovalent hydrogen bonds between amino acids.
• Electrostatic and hydrophobic properties.
• Van der Waals forces between the reaction components.
Antigen–antibody complex. Antisera used for protein determination usually contain different antibodies directed against many different epitopes. Furthermore, since every antibody molecule (IgG class) has two identical antigen binding sites, a three-dimensional molecular aggregate is created during formation of the immune complex with a protein antigen (Fig. 4.1 b). This is the basic principle of agglutination and precipitation methods. The classic precipitation reaction, corresponding to the equivalence zone of the Heidelberger-Kendall curve (Fig. 4.1 d) (Heidelberger and Kendall, 1935) is also the basis of immunodiffusion methods (see below). Nephelometry and turbidimetry, including particle-enhanced reactions, are used in the zone of antibody excess (Fig. 4.1 a,d).
Methods of Immune Complex Analysis
Many physical, optical, and chemical methods have been developed for determining the amount of immune complexes formed. Agglutination tests are widely used for semiquantitative analysis (screening, titer determination). The most common methods for quantitative detection of immune complexes include measuring the distances of precipitation lines, photometry of the scattered light in solution, or indirect enzymatic color reactions of the solid phase-bound complex. Qualitative immunochemical detection of specific proteins is also possible in electrophoresis gels.
The following methods are described in more detail:
• Agglutination.
• Radial immunodiffusion and electroimmunodiffusion.
• Nephelometry and turbidimetry.
• Immunoassay.
• Immune detection using electrophoresis techniques.
• Immunohistochemistry.
Agglutination
Relevance. The oldest, fastest, and least complicated tests for immune reactions use agglutination methods; they have stood the test of time primarily for screening and semiquantitative analysis (Zane, 2001). Many of the commonly used rapid tests in microbiology are based on this method (see Chap. 5, “Rapid Antigen Tests”).
Principle. Bacteria or cells with their specific surface antigens are aggregated by bivalent antibodies (Fig. 4.1 b) into large complexes which become immediately visible as agglutination. Such reactions are carried out on test strips, in test tubes, or on microtiter plates. Instead of antigens present on biological material, any antigen can be bound to a large carrier particle and thus may also be used for the detection of antibodies by agglutination.
Advantage. These semiquantitative methods (titer determination) have the advantage that they permit fast screening and, above all, require little laboratory equipment.
Precipitation Methods
Relevance. Radial immunodiffusion (Mancini et al., 1965) and electroimmunodiffusion (Laurell, 1966) are still commonly used worldwide.
Principles
• Radial immunodiffusion (Fig. 4.2 a): The antigen-containing sample (e. g., albumin) diffuses into the gel containing the corresponding antiserum. The size of the precipitation ring formed by antigen and antibodies in the equivalence zone depends on the concentration of the antigen. The diameter of the ring is measured, e. g., using a caliper.
• Electroimmunodiffusion (Laurell’s rocket electrophoresis, Fig. 4.2 b): As in radial immunodiffusion, the antigen-containing sample diffuses into a gel containing the corresponding antiserum. When an electrical field is applied, the molecules move according to their electrophoretic mobility in the direction of the field, as they do during electrophoresis (see below). The length of the rocket-shaped precipitation arc is measured, and the amount of antigen is determined by reference to a standard curve.
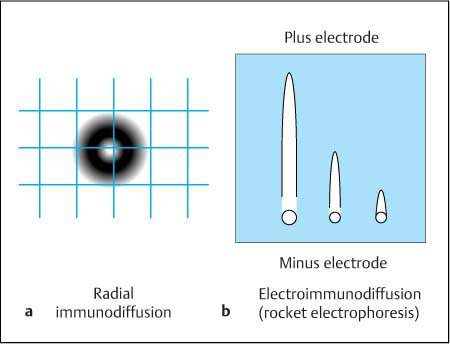
Fig. 4.2 a, b Measuring techniques used in the equivalence zone of the antigen–antibody concentration ratios (precipitation methods).
a Radial immunodiffusion with a central well for sample application. The maximum precipitation ring is formed after about 12–18 hours; its diameter depends on both the constant antibody concentration within the gel and the concentration of the antigen in the sample.
b Electroimmunodiffusion (Laurell’s rocket electrophoresis). The antigen migrates into the antibody-containing gel in the direction of an applied electrical field until it reaches the equivalence point; the height of the resulting precipitation arch correlates with the concentration of the antigen.
Advantages. Both procedures have the advantage that they do not require major equipment. Radial immunodiffusion needs no electrical equipment, whereas electroimmunodiffusion requires a power supply. The agarose gels in which the reaction takes place are easy to produce in the laboratory.
Nephelometry and Turbidimetry
Principle
Definition of Nephelometry and Turbidimetry
The formation of antigen–antibody complexes creates large molecules that scatter light (Fig. 4.3):
• Measuring the intensity of the scattered light is nephelometry. The set-up corresponds to that of fluorescence photometry.
• Measuring the reduction of incoming light caused by scattering is turbidimetry. The set-up corresponds to that of absorption photometry.
A light beam hitting an antigen–antibody aggregate in solution is scattered. Depending on the relationship between the size of these particles and the wavelength of the light (Rayleigh, 1871; Debye, 1947; Reiber 1983), the intensity distribution of the scattered light in space will vary (Fig. 4.4). The strongest scattered light signal is obtained when the particles are relatively large and forward scatter is measured. If the measuring angle of the photodetector is 70°–90° (Beckman Nephelometer), particle size is still important for the total intensity of the scattered light, but changing the particle size has less effect on the distribution of the intensity of the scattered light. As a particular application for total protein analysis (Reiber, 1983) the dynamics of protein aggregation in a highly viscous solution (TCA) allow detection of how a nephelometric signal increases to a maximum and decreases again as a consequence of slowly changing particle size without flocculation (slowly growing particles induce the change from Rayleigh to Rayleigh-Debye scattering).
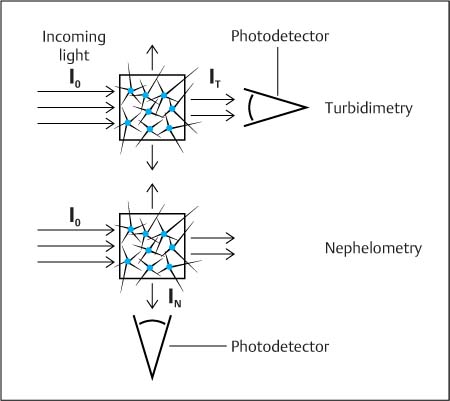
Fig. 4.3 Comparison of the principles of turbidimetry and nephelometry. Turbidimetry records the decrease in light intensity (I T) caused by particles that scatter the incoming light (I0). In nephelometry, the scattered light (IN) is measured directly. The different sensitivities of these two methods are explained by the fact that, at low concentrations, turbidimetry determines the difference between two large signals (I0 – IT), while nephelometry determines the difference between two small signals (IN – IB), with a smaller degree of imprecision. (Blank value, IB = 0.)
Measurement
Physical measuring set-up. The concepts of turbidimetry and nephelometry follow those of absorption photometry and fluorescence photometry—with the exception that scattered light (same wavelength) is measured, rather than the absorption and emission of light (different wavelengths) (Fig. 4.3). In both absorption photometry and turbidimetry, the difference between two large light signals at low sample concentrations is determined; these procedures are therefore less sensitive than fluorescence photometry or nephelometry, where the difference between small light signals at low sample concentrations is determined, with a correspondingly smaller imprecision (see legend to Fig. 4.3).
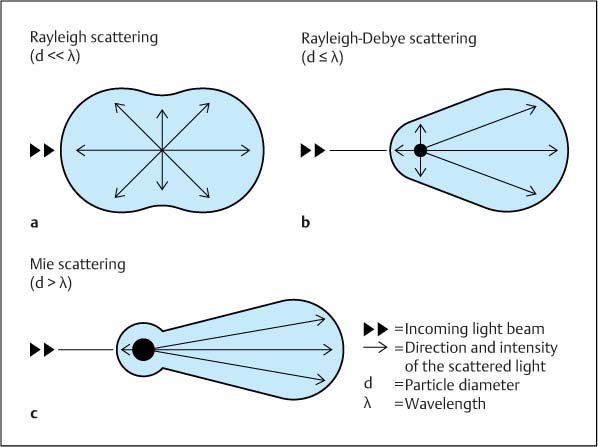
Fig. 4.4 a–c Light scattering as a function of particle size. Double arrows represent the incoming beam of light, and single arrows show the direction and intensity (length of arrows) of the scattered light; d, diameter of particle; λ, wavelength of incoming and scattered light.
a Rayleigh scattering: When the particle size is significantly smaller than the wavelength (d<< λ), the light is scattered symmetrically in the direction of the incoming light as well as against the incoming light.
b Rayleigh-Debye scattering: When the particle size is only a little smaller than, or is equal to, the wavelength (d ≤ λ), asymmetric forward scattering is observed.
c Mie scattering: Asymmetric forward scattering increases significantly when the particle size is larger than the wavelength (d> λ).
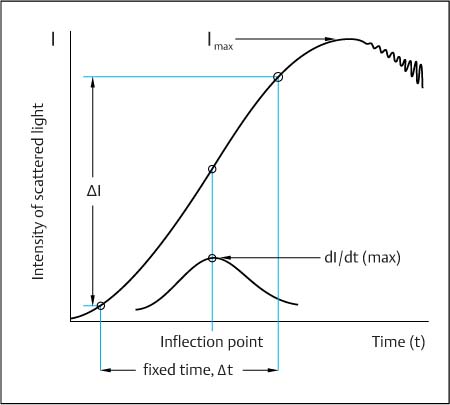
Fig. 4.5 Measuring technique used in nephelometry. The higher the protein concentration, the steeper the curve, i. e., the faster the scattered light reaches maximum intensity. The endpoint method determines the maximum intensity of the scattered light (I max). The two-point method (fixed-time method) measures the difference in intensity between two preset time points (t). Kinetic nephelometry (rate method) measures the maximum rate of complex formation. This corresponds to the ascent at the inflection point of the reaction curve and to the maximum of the differential curve ([d I/d t]max).
Nephelometric analysis. In addition to the optical conditions of light scattering (Figs. 4.3, 4.4), there are various ways of analyzing the dynamics of light scattering due to the dynamics of the immunochemical reaction (Fig. 4.5):
• Endpoint method: The immunochemical reaction gives rise to a steady increase of the light scatter signal I with time (Fig. 4.5), which is recorded at the maximum of light intensity, I max, reached after 0.5–4 hours, depending on the antigen and its concentration. This maximum of light intensity is stable for different lengths of time depending on the stability of the homogeneous suspension of the immune complex in solution.
• Two-point method (fixed-time method): The intensity I of scattered light is determined by measuring at two points in time, for example, 10 seconds and 6 minutes after the start of the reaction (Fig. 4.5). The difference I between the two values is correlated with the antigen concentration.
• Kinetic nephelometry (rate method; Sternberg, 1977): This method determines the maximum reaction rate of immune complex formation by differentiating the curve I/t to get dI/dt (lower curve in Fig. 4.5). The maximum value of the reaction rate thus obtained (i. e., the ascent at the inflection point of the reaction curve) is then correlated with the antigen concentration.
Advantages and disadvantages. Endpoint determination has the disadvantage of unstable endpoint values and varying measuring times, as the time until the endpoint is reached depends on the concentration of the antigen. The two-point method uses a fixed measuring time period, which must be shorter than the time taken to reach the endpoint—a limitation for fast reactions at high concentrations with a steep curve and an early maximum value. Because of its shorter measuring time and independence of initial values, the rate method is more robust, but it is basically less sensitive than the two-point and endpoint methods since the inflection point is more difficult to determine at lower concentrations.
Particle-Enhanced Nephelometry
The sensitivity of the nephelometric detection method can be increased by coating latex particles with immunoglobulins. This results in much larger complexes during the immunochemical reaction (Fig. 4.6), and the intensity of the scattered light increases (“particle-enhanced nephelometric test”). This is particularly important when testing at low concentrations, such as with CSF. These methods are used especially in CSF analysis for IgA and IgM.
Heidelberger-Kendall Curve
A special problem in immunochemical nephelometry is the possibility that, unnoticed, falsely low values are measured in the sample when it contains unexpectedly high amounts of antigen, i. e., an antigen excess (Heidelberger and Kendall, 1935).
Dependence of the detection signal on the relative amounts of the reaction components. The size of the antigen–antibody complex (immune complex) depends on the relative amounts of the reaction components (Fig. 4.1). When there is excess of antibody (Fig. 4.1 a), every increase in the amount of antigen leads to further cross-linking, which is most complete in the zone of equivalence (roughly equal concentrations, Fig. 4.1 b). The solubility of the antigen–antibody aggregates is lowest in this zone. When there is excess of antigen (Fig. 4.1 c), not all antigens become complexed. Furthermore, because the antibodies are saturated with antigen, thus preventing the formation of large complexes, the aggregates of molecules are smaller and more soluble, and the intensity of scattered light decreases accordingly (Fig. 4.1 d).
To take the example of an IgM paraprotein present at an unexpectedly high concentration in the sample, this situation results in a low signal, which is falsely interpreted as a low concentration (as indicated in Fig. 4.1 d by the two points on the curve, which demonstrate how in this case the true concentration is 10 times higher than indicated by the falsely low signal measured in the zone of antigen excess). Particularly in CSF analysis, there is often considerable variation between protein values related to intrathecal synthesis and those related to the solely blood-derived, normal fraction in CSF (sometimes more than 100-fold). This makes development of automated methods for CSF analysis a much more demanding challenge than for serum analysis.
Preventing Misinterpretations
 A falsely low value in the zone of antigen excess can be recognized if the measuring signal increases when more antibodies are added to the reaction mixture.
 A further possibility of avoiding errors is to start the analysis of immunoglobulins generally with diluted samples (based on the total protein content of CSF samples).
Related posts:

Stay updated, free articles. Join our Telegram channel

Full access? Get Clinical Tree


