Fig. 1
The Sleep Position Trainer. Used with permission from the Associated Professional Sleep Societies, LLC, Darien, IL, USA [31]
Statistical Analysis
Changes in parameters before and after treatment were tested with the Wilcoxon signed-rank test. A p-value < 0.05 was considered to be significant. All statistical analyses were performed with SPSS (version 20).
Results
A total of 145 mild and moderate POSA patients were included from February to August 2012. Baseline polysomnographical patient characteristics are depicted in Table 1.
Table 1
Patient characteristics at baseline inclusion polysomnography (n = 145)
Variable | Median |
|---|---|
AHI (/h) | 11.5 [9.0] |
AHI supine (/h) | 28.2 [25.6] |
% supine sleep | 35.0 [29.0] |
Age (years) | 53 [14.3] |
BMI (kg/m2) | 27.0 [4.0] |
Ratio male/female | 4.7:1 |
Objective Compliance and Hours of Use
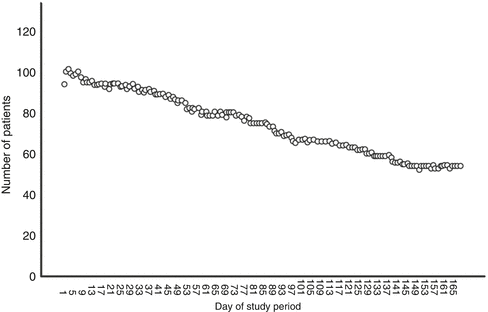
In 39 patients, neither SPT use nor SPT data could be retrieved. For the group (n = 106) that did upload SPT data, the distribution of hours of SPT use is shown in Table 2. Median SPT use during 6 months was 5.5 h per night for all nights. As shown in Table 3, 35 patients used the SPT during all 168 nights. Median SPT use for the 106 patients was 163 of the 168 days [interquartile range (IQR) = 98]. Figure 2 shows the gradual decrease in the number of patients, from whom SPT data could be retrieved, and shows the eventual number of patients that was using the SPT and uploading the data during the full study period. Objective SPT compliance in this group of 106 patients was 64.4 %. Regular SPT use was 71.2 % over all nights observed.

Table 2
Distribution of hours of nightly SPT use (n = 106) as observed over the 6-month study period
Hours of use | N | % of patients | Cumulative % of patients |
|---|---|---|---|
7.5–9.0 | 10 | 9.6 | 9.6 |
6.0–7.5 | 32 | 30.8 | 40.4 |
4.5–6.0 | 23 | 22.1 | 62.5 |
3.0–4.5 | 8 | 7.7 | 70.2 |
1.5–3.0 | 15 | 14.4 | 84.6 |
0–1.5 | 16 | 15.4 | 100 |
Total | 104 | 100 | |
Missing | 2 |
Table 3
Distribution of days of SPT use (n = 106)
Days used | N | % of patients | Cumulative % of patients |
|---|---|---|---|
168 | 35 | 33.0 | 33.0 |
161–167 | 19 | 17.9 | 50.9 |
101–160 | 13 | 12.3 | 63.2 |
51–100 | 19 | 17.9 | 81.1 |
10–51 | 10 | 9.4 | 90.6 |
0–9 | 10 | 9.4 | 100 |
Total | 106 | 100 |

Fig. 2
Patients who used the SPT nightly for 1 h or more during the study period. Used with permission from the Associated Professional Sleep Societies, LLC, Darien, IL, USA [31]
SPT’s Effects on Supine Sleep and on Subjective Sleep Parameters
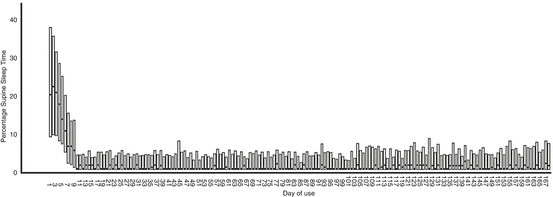
Figure 3 illustrates that the median percentage (and IQR) of supine sleep time, as measured by the SPT, quickly decreases from baseline to day 9 and that this reduced percentage of supine sleep is maintained over time. SPT’s diagnostic and training (day 1 and 2, and 3–9, respectively) and therapeutic phase (from day 10 onwards) can be clearly identified from this figure. Table 4 shows median questionnaire scores and percentage of supine sleep with IQR values for all available SPT users at the different time points. According to a test-by-test exclusion approach on missing data, all parameters showed a significant decrease when compared to baseline. The median percentage of supine sleep time decreased significantly from 21 to 2 % after 1 month (Z = −8.015; p < 0.001), to 2 % after 3 months (Z = −7.473; p < 0.001), and to 3 % after 6 months (Z = −6.251; p < 0.001) (Table 4).


Fig. 3
Median percentage (dot) and interquartile range (bar) of sleep time in supine position per patient per night. Used with permission from the Associated Professional Sleep Societies, LLC, Darien, IL, USA [31]
Table 4
Questionnaire values and percentage of supine sleep time during 6 months of SPT treatment for all available SPT users
Variable | N | T = 0 | N | T = 1 month | N | T = 3 months | N | T = 6 months |
|---|---|---|---|---|---|---|---|---|
Median | Median | Median | Median | |||||
ESS | 145 | 11 [8] | 114 | 8 [8] | 104 | 8 [8] | 90 | 8 [6] |
FOSQ | 145 | 87 [30] | 114 | 98 [30] | 103 | 99 [32] | 90 | 103 [30] |
PSQI | 144 | 8 [6] | 113 | 6 [5] | 102 | 6 [6] | 88 | 6 [6] |
% supine | 104 | 21 [30] | 94 | 2 [5] | 75 | 2 [5] | 53 | 3 [5] |
ESS values significantly decreased from 11 to 8 after 1 month (Z = −6.291; p < 0.001), to 8 after 3 months (Z = −6.647; p < 0.001), and to 8 after 6 months (Z = −6.749; p < 0.001). FOSQ significantly increased from 87 to 98 after 1 month (Z = −5.874; p < 0.001), to 99 after 3 months (Z = −5.865; p < 0.001), and to 103 after 6 months (Z = −6.063; p < 0.001). PSQI significantly decreased from 8 to 6 after 1 month (Z = −3.922; p < 0.001), to 6 after 3 months (Z = −4.329; p < 0.001), and to 6 after 6 months (Z = −4.410; p < 0.001) (Table 4).
Number of Times in Supine Position, Positional Changes and Response to Stimulus
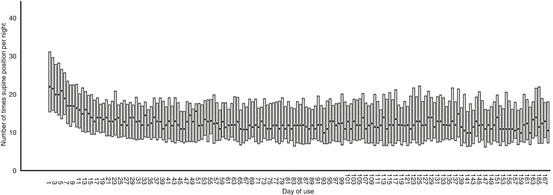
Figure 4 depicts the median number of times in supine position. It seems that the number of times in supine position rapidly decreases during the first 2–3 weeks of treatment (23 times in supine position at baseline vs. 13 times on day 21) and that this value from then onwards is maintained over time.


Fig. 4
Median number (dot) and interquartile range (bar) of times in supine position per patient per night. Used with permission from the Associated Professional Sleep Societies, LLC, Darien, IL, USA [31]
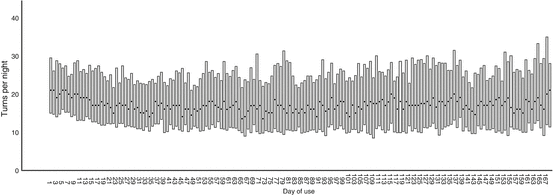
In Fig. 5, the median number of positional changes per patient per night is shown. Over time, this number of positional changes seems relatively stable (22 at baseline compared to 22 at the end of the study period). The positional change index did not change over time (median positional change index at baseline was 2.9 at baseline compared to 2.8 after 1 month, 2.6 after 3 months, and 3.0 after 6 months).


Fig. 5
Median number (dot) and interquartile range (bar) of positional changes per patient per night. Used with permission from the Associated Professional Sleep Societies, LLC, Darien, IL, USA [31]
When studying the time needed to respond to the stimulus, it was found that during the first month of SPT therapy, the median reaction time was 1 s (IQR = 0–3), in the second and third months the reaction time was 0 s (IQR = 0–3), and these values were maintained during the fourth to sixth months.
Subjective Compliance
Data on self-reported continued use were obtained using the online questionnaires at three time points. After 1 month of therapy, subjective compliance (>4 h per night, 7 days per week) was 91.8 % (N = 110). After 3 months of therapy, 74.3 % of the patients were self-reportedly compliant (N = 101), and after 6 months, the subjective compliance was 59.8 % (N = 87). Subjective regular SPT use (>4 h per night, 5 days per week) was 96.4 %, after 3 months 89.1 %, and 74.4 % after 6 months.
Stay updated, free articles. Join our Telegram channel

Full access? Get Clinical Tree


