Fig. 3.1
Distribution of the in-patients by sex and ward
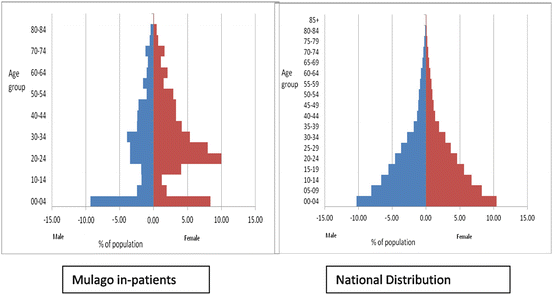
Figure 3.2 shows a population pyramid for patients in Mulago and the national population pyramid. While patients’ age distribution is not expected to be the same distribution with the general population the figure is an important tool for description and discussion of in-patients. It is clear that under 5 s and women in middle ages were the most prevalent in-patients. Those aged 60 years and above were 10 % of the in-patients. Nationally the proportion aged 60 years and above is 2.5 % [9].


Fig. 3.2
Distribution of the inpatients by age and sex compared to the national distribution
Table 3.1 shows general characteristics of the inpatients found in the hospital on the census day. Expectedly, close to a half (44 %) of the inpatients originated from Kampala city while 20 % come from Wakiso district which almost encircles Kampala. Other neighboring districts contribute 11 % while other districts contribute almost a quarter (24 %). Most of the in-patients were married (39 %) and this was more evident among women (44 %) than men (35 %). The number of divorced was 11 % and it was higher among women (14 %) than men (6 %). When the under 15 year olds and those missing information are deducted the proportion of the widowed/divorced becomes 15.5 %.
Table 3.1
Overall background characteristics of the in-patients by sex
Characteristics | Males | Female | All | Chi-sq test |
|---|---|---|---|---|
Age group | ||||
<5 | 163(23.2) | 147(14.0) | 310(17.6) | p < 0.001 |
5–14 | 74(10.5) | 55(5.2) | 129(7.4) | |
15–24 | 93(13.3) | 246(23.4) | 339(19.3) | |
25–34 | 130(18.5) | 234(22.2) | 364(20.8) | |
35–44 | 85(12.1) | 131(12.5) | 216(12.3) | |
45–54 | 57(8.1) | 109(10.4) | 166(9.5) | |
55+ | 100(14.3) | 130(12.4) | 230(13.1) | |
District | ||||
Wakiso | 133(18.9) | 220(20.8) | 353(20.0) | p < 0.001 |
Kampala | 281(39.9) | 501(47.4) | 782(44.4) | |
Neighboring districts | 90(12.8) | 101(9.6) | 191(10.8) | |
Other districts | 199(28.2) | 230(21.7) | 429(24.3) | |
Outside the country | 2(0.3) | 6(0.6) | 8(0.5) | |
Marital status | ||||
Single | 150(21.3) | 183(17.3) | 333(18.9) | p < 0.001 |
Married | 244(34.6) | 438(41.4) | 682(38.7) | |
Divorced/widowed | 41(5.8) | 146(13.8) | 187(10.6) | |
Not applicablea | 234(33.2) | 202(19.1) | 436(24.7) | |
Missing information | 36(5.1) | 89(8.4) | 125(7.1) | |
Education | ||||
None | 64(9.1) | 143(13.5) | 207(11.7) | p < 0.001 |
Primary | 239(33.9) | 381(36.0) | 620(35.2) | |
Secondary | 149(21.1) | 285(26.9) | 434(24.6) | |
Tertiary | 69(9.8) | 79(7.5) | 148(8.4) | |
Not applicable (<5 years) | 162(23.0) | 146(13.8) | 308(17.5) | |
Missing information | 22(3.1) | 24(2.3) | 46(2.6) | |
Religion | ||||
Catholic | 221(31.4) | 357(33.7) | 578(32.8) | P = 0.178 |
Protestant | 273(38.7) | 366(34.6) | 639(36.3) | |
Moslem | 154(21.8) | 225(21.3) | 379(21.5) | |
Pentecostal | 38 (5.4) | 86(8.1) | 124(7.0) | |
Other Christian | 15(2.1) | 19(1.8) | 34(1.9) | |
Missing | 4 (0.6) | 5(0.5) | 9(0.5) | |
Occupation | ||||
None | 157(22.3) | 367(34.7) | 524(29.7) | p < 0.001 |
Peasant farmer | 106(15.0) | 168(15.9) | 274(15.5) | |
Business | 71(10.1) | 113(10.7) | 184(10.4) | |
Manual labour | 61(8.7) | 91(8.6) | 152(8.6) | |
Formal employment | 76(10.8) | 76(7.2) | 152(8.6) | |
Not applicablea | 208(29.5) | 187(17.7) | 395(22.4) | |
Missing information | 26(3.7) | 56(5.3) | 82(4.7) | |
All | 706(400.0) | 1058(60.0) | 1,763(100.0) |
The most prevalence education attainment is primary level (36 %) and it was nearly the same for men and women. The next prevalent is secondary education. Education level was not applicable to 18 % of the inpatients because they were under 5 years old.
The religious distribution of the in-patients reflected the country’s picture in that all major religions were represented except that the level of representation differs. For example according to the 2001 national census Catholics were 41 % while Muslims were 15 %. During the study night at the NRH the Catholics were 33 % while Muslims were 22 %.
The occupation distribution showed high unemployment levels among these inpatients. Nearly a third (30 %) were not employed, 16 % were peasant farmers while those engaged in manual labour were nearly 9 %. Since manual labour and peasant farming are normally regarded as low paying employment this puts the prevalence of unemployed/low income inpatient at 54 %. When children under 15 those whose information is missing are left out the proportion of the unemployed/manual labour/peasant farmers rises to 74 %.
Ward Specific Descriptions
Table 3.2 shows the ward specific information. In this section the inpatients are described ward by ward.
Table 3.2
Socio-demographic characteristics by major ward category
Characteristics | Medical | Surgical | Paed-iatrics | Obstetrics/gynacol | Psychiatry | Cancer institute | Heart institute | All |
|---|---|---|---|---|---|---|---|---|
Sex | ||||||||
Male
Stay updated, free articles. Join our Telegram channel
Full access? Get Clinical Tree
 Get Clinical Tree app for offline access

|


