Correlations
Standardized beta weights
ANTI
AGO
ANTI
AGO
DBI rule-breaking scale
0.72**
0.55**
0.60**
0.23**
DSM-IV rule-breaking symptom count
0.42**
0.33**
0.33**
0.16**
DBI physical aggression subscale
0.49**
0.60**
0.24**
0.48**
DSM-IV physical aggression symptom count
0.29**
0.38**
0.12
0.31*
Analyses. I evaluated the impact of age on the etiology of ANTI and AGO (separately for each measure) via a series of nested interaction models (Purcell, 2002). The most basic model functions as a main effects model, in which only path estimates (i.e., a, c, e) were computed. Because moderator parameters are not estimated in this model, the genetic and environmental path estimates apply to all ages (as demonstrated by the following equation: VarianceGenetic = (a)2). In the more complicated models, I added linear and nonlinear genetic, shared, and non-shared environmental moderators (i.e., A1, C1, E1 and A2, C2, E2, respectively) to the model using the following equation: VarianceGenetic = (a + A 1(age) + A 2(age2))2.
Several steps of data preparation were necessary to facilitate data analysis and its subsequent interpretation. First, because skewness in the distribution of the phenotype can artifactually suggest the presence of moderator effects (Purcell, 2002), I log-transformed each scale to better approximate normality (skew following transformation was 0.46 for ANTI and 0.27 for AGO). Because Purcell (2002) indicated that only unstandardized estimates should be reported when using these models, I also standardized the log-transformed scale scores prior to model-fitting to facilitate interpretation of the moderator values. Third, I subtracted 11 from each age prior to data analysis, thereby bringing the floor moderator value to 0. Finally, I statistically controlled sex effects via regression techniques (McGue & Bouchard, 1984), in which sex was regressed onto AGO and ANTI, respectively, and the AGO and ANTI residuals were retained for analysis. This decision is bolstered by previous meta-analytic work, which found no evidence of substantive sex differences in the genetic and environmental architecture of either AGG or RB (Burt, 2009a).
Because these interaction models effectively involve fitting a separate biometric model for individuals as a function of their age, they require the use of Full-Information Maximum-Likelihood raw data techniques (FIML). Mx, a structural-equation modeling program (Neale, Boker, Xie, & Maes, 2003), was used to fit models to the transformed raw data. When fitting models to raw data, variances, covariances, and means of those data are freely estimated by minimizing minus twice the log-likelihood (−2lnL). The minimized value of −2lnL in the least restrictive nonlinear model is then compared with the −2lnL obtained in the more restrictive linear and no moderation models to yield a likelihood-ratio χ 2 test for the significance of the moderator effects. A nonsignificant reduction in fit indicates that the genetic and environmental moderators are not significantly different from zero and can be dropped.
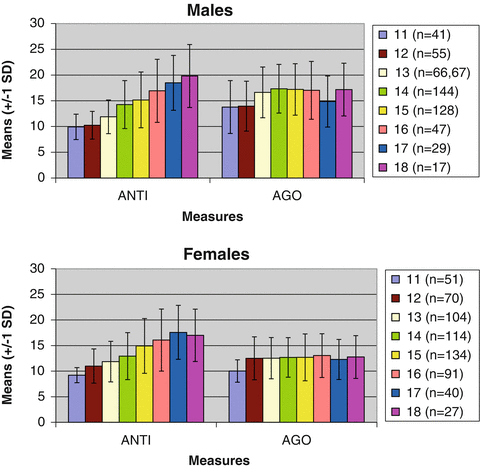
Results. Raw means of ANTI and AGO are presented in Fig. 4.1, separately by age. Mean levels of ANTI increased dramatically from age 11 to age 18 for both males (correlation with age = 0.48, p < 0.01) and females (r = 0.45, p < 0.01). By contrast, although AGO was also positively associated with age (correlations between age and AGO = 0.14 for males and 0.11 for females), correlation comparisons revealed that these associations were significantly smaller (at p < 0.001) than those for ANTI. Similarly, the variance in ANTI increased substantially with age (F-tests for homogeneity of variance were highly significant for both females (F = 13.72 (7, 623), p < 0.001) and males (F = 11.99 (7, 519), p < 0.001)), whereas the variance in AGO remained relatively constant with age (F-tests for homogeneity of variance were significant for females (F = 2.67 (7, 623), p < 0.05), but not for males (F = 0.38 (7, 519), ns)).


Fig. 4.1
Raw means of delinquency measures (+/− 1 standard deviation) from ages 11 to 18 in a cross-sectional adoption design. Note: AGO and ANTI represent aggressive orientation and antisocial attitudes, respectively. Means and standard deviations are presented at each age. The range of possible values is 8–32
Independent sample t-tests indicated that males reported significantly higher levels of AGO than did females (standardized effect size (ES) = 0.85, p < 0.001), though they did not endorse significantly more ANTI (ES = 0.09, ns). Importantly, ANTI and AGO were differentially associated with age and sex despite the fact that, like the AGG and RB behaviors they are related to, ANTI and AGO are moderately to strongly intercorrelated with one another (r = 0.52). Also of note, neither ANTI nor AGO varied across family type (adoptive mean: 13.9 and 14.4; non-adoptive mean: 13.8 and 14.1, respectively), indicating that adopted and non-adopted youth self-report roughly equivalent levels of aggressive and nonaggressive delinquent attitudes.
Test statistics for the nested models are reported separately for each measure in Table 4.2. For AGO, the best-fitting model was the no moderation model. The optimal fit of this model indicates that the magnitude of genetic and environmental contributions to individual differences in AGO do not vary across age. In contrast, constraining estimates to be constant across age resulted in a significant decrement of fit for ANTI, suggesting that the magnitude of genetic and environmental forces impacting ANTI vary significantly across age.
Table 4.2
Indices of fit for a series of nested ACE models examining the etiology of aggressive orientation (AGO) and antisocial attitudes (ANTI) in cross-sectional sample of siblings
Measure | Model | −2lnL | df | Δχ 2 | Δdf | p-value |
|---|---|---|---|---|---|---|
AGO | Linear and quadratic moderation | 3,107.43 | 1,106 | – | – | – |
Linear moderation | 3,110.84 | 1,109 | 3.41 | 3 | ns | |
No moderation model | 3,111.78 | 1,112 | 0.94 | 3 | ns | |
ANTI | Linear and quadratic moderation | 2,754.54 | 1,105 | – | – | – |
Linear moderation | 2,780.01 | 1,108 | 25.47 | 3 | <0.001 | |
No moderation model | 2,832.14 | 1,111 | 52.13 | 3 | <0.001 |
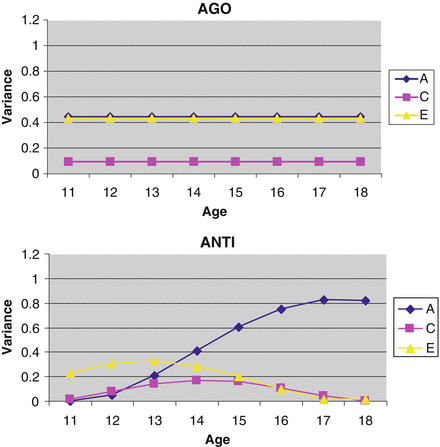
For the best-fitting models, I then made use of the estimated paths and moderators (data not shown) to calculate and plot the unstandardized genetic and environmental variance components at each age using the following equation: VarianceGenetic = (a + A 1(age) + A 2(age2))2. The absolute (or unstandardized) changes in the genetic and environmental estimates calculated in this way are presented in Fig. 4.2. For AGO, the plots are flat because neither linear nor quadratic moderators were statistically significant. Only genetic and non-shared environmental influences made significant etiological contributions. Shared environmental contributions were not significant.


Fig. 4.2
Unstandardized variance components in aggressive orientation (AGO) and antisocial attitudes (ANTI) across adolescence in a cross-sectional adoption design. Note: Unstandardized variance components across adolescence are presented separately for each delinquency measure. These estimates index the absolute changes in genetic and environmental variance from age 11 to age 18. A, C, and E represent genetic, shared environmental, and non-shared environmental variance components
For ANTI, there was evidence of significant linear moderation of genetic influences across adolescence, such that genetic variation increased in magnitude from early to late adolescence, peaking in strength at age 17. The quadratic genetic moderator was also marginally significant (Δχ 2 = 3.32 on 1 df, p = 0.06), suggesting the additional presence of some (albeit marginally significant) nonlinear genetic moderation. In contrast, though visual inspection of the figure suggests there is some moderation of shared and non-shared environmental parameters with age, the individual moderators were not statistically significant (although the linear shared environmental moderator was marginally significant; Δχ 2 = 2.42 on 1 df, p < 0.10).
The above analyses suggest that AGO and ANTI differ at both phenotypic and etiological levels.4 ANTI had a significantly stronger phenotypic association with age than did AGO, while the reverse was true for sex. Such findings are fully in keeping with prior phenotypic research on AGG and RB. Similarly, genetic contributions to AGO remained invariant across age, while genetic influences on ANTI increased dramatically from 11 to 18. These etiologic differences are again fully in keeping with those of prior studies and thus suggest that prior twin findings extend to both child self-report data and to other sorts of genetically informed designs.5
Sample #2: Accelerated Longitudinal Twin Design
Sample. Participants consisted of the younger cohort of the Minnesota Twin Family Study (MTFS), a population-based, longitudinal study of same-sex adolescent twins born in the state of Minnesota and their parents. Though often characterized as a single sample for the sake of brevity, the MTFS in fact consists of three samples: male twins assessed at ages 11, 14, 17, and beyond; female twins assessed at ages 11, 14, 17, and beyond; and another cohort of same-sex male and female twins assessed at ages 11, 14, and currently participating in the age 17 assessment. Unfortunately, the Adolescent Opinions and Attitudes Scale was not administered to the original sample of male twins at intake. The current sample of males thus functions as an accelerated longitudinal twin design. Specific sample sizes are presented in Table 4.3. Further information regarding all aspects of MTFS recruitment and zygosity assessment is detailed elsewhere (Iacono, Carlson, Taylor, Elkins, & McGue, 1999).
Table 4.3
Number of twin participants with available antisocial attitudes (ANTI) and aggressive orientation (AGO) data
Measure | Original sample size | Augmented sample size | Total sample size | ||||||
|---|---|---|---|---|---|---|---|---|---|
11 | 14 | 17 | 11 | 14 | 17 | 11 | 14 | 17 | |
Male | |||||||||
ANTI | 0 | 636 | 569 | 200 | 182 | 112 | 200 | 818 | 681 |
AGO | 0 | 636 | 571 | 200 | 182 | 112 | 200 | 818 | 683 |
Female | |||||||||
ANTI | 692 | 698 | 646 | 306 | 286 | 214 | 998 | 984 | 860 |
AGO | 694 | 698 | 647 | 306 | 286 | 214 | 1,000 | 984 | 861 |
Measures. I again made use of the ANTI and AGO scales within the Adolescent Opinions and Attitudes survey. Average levels of ANTI and AGO do not differ between the original and augmented samples (independent sample t-tests, p > 0.3, two-tailed), suggesting that the two samples are comparable.
Analyses. Fitting a triangular, or Cholesky decomposition, model allowed me to examine overall genetic and environmental contributions to ANTI and AGO at ages 11, 14, and 17 years. The Cholesky approach parses the phenotypic variance at each age into that which is due to genetic, shared environmental, and non-shared environmental factors. I then employed constraint parameters to equate unstandardized variances across age within this model. I was thus able to explicitly evaluate whether, for example, the genetic influences at age 14 were larger than those at age 11. Note that, because phenotypic variances change with development (particularly for ANTI), I focused here on unstandardized, or absolute, changes in genetic and environmental influences, as proportional influences can mask or otherwise distort relevant changes (as described in Purcell, 2002).
Because of missing data, I made use of Full-Information Maximum-Likelihood raw data techniques (FIML), which produce less biased and more efficient and consistent estimates than other techniques, such as pairwise or listwise deletion, in the face of missing data (Little & Rubin, 1987). To adjust for positive skew in the data while still allowing for changes in the mean and variance with age, the measures were log-transformed prior to model-fitting to better approximate normality (skew following transformation: 1.65, 0.35, and −0.26 for ANTI at 11, 14, and 17, respectively; 0.71, 0.14, and 0.29 for AGO at 11, 14, and 17, respectively). Mx (Neale et al., 2003) was again used to fit models to the transformed raw data. The possible moderating effects of sex were also examined in these analyses.
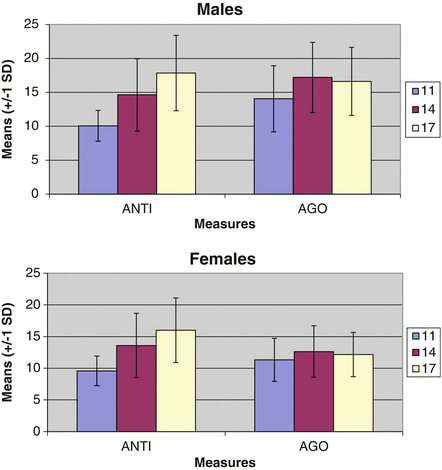
Results. Mean levels of each scale, along with their standard deviations, are presented in Fig. 4.3, separately across assessments. Paired sample t-tests revealed that, in both males and females, mean levels of ANTI increased from 11 to 14 and from 14 to 17 (all p < 0.001; note that although the male comparison across ages 11 and 14 was restricted to males in the augmented sample, all other comparisons made use of the full sample). Mean levels of AGO increased significantly from 11 to 14 (p < 0.001) and decreased from 14 to 17 (p < 0.05). Further, as compared to female youth, male youth reported significantly higher levels of both AGO (Cohen’s d = 0.65, 0.98, and 1.03 at ages 11, 14, and 17, respectively; all p < 0.001) and ANTI (Cohen’s d = 0.21, 0.20, and 0.35 at ages 11, 14, and 17, respectively; all p < 0.01), although standardized effect sizes appeared notably larger for AGO than for ANTI.


Fig. 4.3
Raw means and standard deviations for antisocial attitudes (ANTI) and aggressive orientation (AGO) at ages 11, 14, and 17 in an accelerated longitudinal twin design. Note: Means and standard deviations are presented at each age. The range of possible values is 8–32
I initially tested an ACE Cholesky model, in which the variances attributable to genetic (A), shared environmental (C), and unique environmental plus measurement error (E) factors were all estimated. The model was fit both allowing for sex differences in variance parameter estimates (ANTI: −2lnL = 211.39 on 4,473 df, AIC = −8,734.61; AGO: −2lnL = 434.28 on 4,478 df, AIC = −8,521.72) and constraining the parameter estimates to be equal across sex (ANTI: −2lnL = 225.422 on 4,491 df, AIC = −8,756.56; AGO: −2lnL = 468.49 on 4,496 df, AIC = −8,523.51). In both cases, the no-sex-differences model provided a better fit to the data, as indicated by a lower AIC value. These results thus suggest that the genetic and environmental architecture underlying ANTI and AGO does not vary across sex.
I next statistically tested for changes in the magnitude of genetic and environmental parameters with age (see Table 4.4), constraining variances to be equal across age and evaluating the subsequent changes in model fit. A significant change in chi-square indicates that the unstandardized variances are significantly different across age. For AGO, the magnitude of genetic variance remained constant across age (see Fig. 4.4). In contrast, non-shared environmental variance in AGO decreased slightly but significantly with age. Shared environmental variance did not change significantly with age. For ANTI, by contrast, there was evidence of significant change across age for all three parameters. The best-fitting model thus contained no constraint parameters, allowing the magnitude of all variance components to vary freely across age.6 Consistent with the earlier results, the magnitude of genetic influences increased across adolescence, increasing from 11 to 14 (∆χ 2 = 6.03 on 1 df) and from 11 to 17 (∆χ 2 = 10.9 on 1 df), although this increase was not significant from age 14 to age 17. Such findings again highlight fundamental distinctions in the developmental course of genetic influences on AGO and ANTI during adolescence.7
Table 4.4
Indices of fit for constraint parameters in aggressive orientation (AGO) and antisocial attitudes (ANTI) in an accelerated longitudinal twin design
Measure
Stay updated, free articles. Join our Telegram channel
Full access? Get Clinical Tree
 Get Clinical Tree app for offline access

|
|---|


