Chemical structure of some alcohols.
Pharmacology
Alcohol is a colourless liquid at room temperature. Relative to water, it has a lower density, freezing point, and boiling point (Table 2.1).
| Alcohol (ethanol) | Water | |
|---|---|---|
| Formula | CH3CH2OH | H2O |
| Appearance | Colourless clear liquid | Colourless clear liquid with a hint of blue |
| Molecular weight | 46 g/mol | 18 g/mol |
| Density | 0.79 g/cm3 (liquid) | 1 g/cm3 (liquid) |
| Melting point | −114°C | 0°C |
| Boiling point | 78.4°C | 100°C |
The complexity of scientific notation
Various ways of expressing alcohol concentrations are employed in different texts. Usually, concentration is expressed as a weight in a given volume of blood, breath, or urine. In this chapter, blood alcohol concentrations (BACs) are expressed as milligrams per 100 millilitres of blood (mg/100 mL). It should be noted, however, that the following reported BACs are all the same (see also Brick, 2004):
100 mg/100 mL
100 mg/decilitre (100 mg/dL)
100 mg/100 cc
100 mg percent (100 mg%)
0.1 g/100 mL
0.1 g/decilitre
0.1 grams percent (0.1 g%)
0.1 percent (0.1%)
Laboratory studies may report a millimolar concentration, and this can be converted to mg/100 mL by using the molecular weight. Thus, the millimolar concentration (mmol) of alcohol is multiplied by the molecular weight 46 g/mol and divided by 10 to achieve the same concentration in mg/100 mL. Clinical laboratories usually measure alcohol concentrations in serum rather than in blood. An approximate conversion between serum and blood concentration can be obtained by multiplying the value in serum by 0.85.
The term “proof” adds another layer of complexity, particularly across “two nations separated by a common language.” Proof was used as a measure of the concentration of alcohol, and 100 percent proof represents the lowest dilution able to sustain combustion of equal amounts of gunpowder and the spirit under test and produce a clear blue flame. This represents a concentration of approximately 57 percent alcohol by volume (ABV) under the UK system, with pure alcohol being 175 percent proof. In the United States, proof is double the concentration expressed by volume; therefore, 100 percent proof is equivalent to 50 percent ABV. Thus, in the old UK system, 70 percent proof spirit is 40 percent ABV or 80 percent proof in the USA! (See Chapter 1 for more information about how much alcohol is present in a “unit” or “drink.”)
Absorption and distribution
Absorption of alcohol is relatively slow from the stomach but occurs rapidly in the small intestine, and the time to maximum concentration in the blood ranges from 30 to 90 minutes after consumption (Brick, 2004). The presence of food in the stomach slows absorption by delaying gastric emptying into the small intestine, which is highly efficient at absorbing such substances due to the presence of villae. Villae are little projections into the gut that dramatically increase the surface area available for absorption. Furthermore, the prandial state can alter the efficiency with which drinks of differing alcohol concentrations are absorbed. The presence of carbon dioxide bubbles in fizzy drinks (e.g., champagne) increases absorption, whereas physical exercise reduces absorption. In addition, sugar-free mixers increase gastric emptying and absorption when compared with sugar-containing regular versions. Furthermore, peak blood levels are higher if the same quantity of alcohol is ingested in a single dose rather than in several small doses (Agarwal & Goedde, 1990).
Following absorption, alcohol is distributed throughout the body. It is hydrophilic (water-loving) and therefore is distributed with water. It can cross the placenta into the fetal circulation and is also found in breast milk in lactating mothers.
BAC is very similar to tissue levels in most of the body except fat. The usually smaller stature and relatively higher proportion of body fat (or lower proportion of water) in women often leads to a higher BAC than would occur in men after an equivalent dose of alcohol. This may explain, in part, the increased vulnerability of women to certain types of tissue damage.
Excretion and metabolism
Between 90 percent and 98 percent of ingested alcohol is eliminated from the body by oxidation to carbon dioxide and water. Most of the alcohol that escapes oxidation is excreted unchanged in expired air, urine, and sweat. Elimination by these routes may increase after a heavy drinking bout or at elevated temperatures. Indeed, the presence of alcohol in expired air can be used to estimate the BAC using a breathalyser. The breath alcohol concentration can be used to calculate a presumed BAC level using a conversion factor, which varies between countries (some breathalyzers do this automatically). Breathalyzers provide a more objective measure of alcohol levels than clinical examination alone, and they are widely employed to test motorists suspected of drink-driving offences (known as drunk-driving in the United States). Countries set differing legal limits for driving; for example, this ranges widely across Europe from 0 to 80 mg/100 mL in blood.
Hepatic alcohol metabolism
The amount of alcohol oxidized per unit time depends on body weight. In the healthy adult, the rate is limited to about 8 g, or 1 UK unit of alcohol per hour in a 70 kg adult, or 120 mg/kg per hour (Fleming, Mihic, & Harris, 2006). The breakdown of alcohol in the liver is largely saturated (i.e., it takes place as quickly as possible) at low BACs. Technically, this is called a pseudo-zero-order of metabolism, in which the rate is constant and doesn’t vary with alcohol concentrations at the levels generally found during drinking. Breakdown can be faster in the heavier drinker (see later discussion). Alcohol may undergo first-pass metabolism in the stomach, but 90–98 percent of ingested alcohol is metabolized in the liver. The major pathway is oxidation by alcohol dehydrogenase (ADH) to acetaldehyde (Figure 2.2). Acetaldehyde is highly toxic and is usually rapidly oxidized by aldehyde dehydrogenase 2 (ALDH2) to acetate. Acetate is then broken down to water and carbon dioxide.
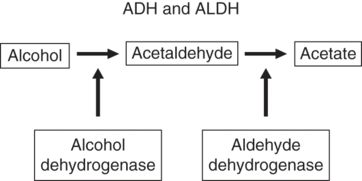
Metabolism of alcohol.
The enzymes ADH and ALDH are under genetic control. Five classes of ADH have been described, and the class I variety is largely responsible for the first step in alcohol metabolism in the liver (Figure 2.3). Class I consists of enzymes encoded by three different genes that demonstrate up to a 40-fold difference in the maximum speed of the reaction. Complete human genome and expression studies report that there are 19 functional ALDH genes. ALDH2, the isozyme largely responsible for the oxidation of acetaldehyde, exists in two forms, one of which is virtually inactive (ALDH2*2 variant). Low-activity ALDH2, which is common in Asian populations, leads to a flushing reaction when alcohol is taken. This reaction is unpleasant and may include nausea, headache, and facial flushing. Individuals with low-activity ALDH2 are less inclined to drink and are thus less vulnerable to developing alcohol problems and dependence (Ball, Pembrey, & Stevens, 2007). Although the toxicity of aldehydes has been long recognized, more recently, there is increasing evidence also linking the low-activity ALDH2 variant with other disorders including stroke, heart failure, and Alzheimer’s disease (Chen, Ferreira, Gross, & Mochly-Rosen, 2014). ALDH is also the primary site of action for disulfiram, a drug that acts by suppressing the activity of ALDH2 and is used to help maintain abstinence in alcohol dependence (see Chapter 13). In essence, possessing this low-activity variant is similar to taking disulfiram constantly. The acetate formed from acetaldehyde is released into the circulation and is largely taken up by muscle and heart for oxidation via the tricarboxylic acid cycle (Fleming et al., 2006; see Figure 2.4).
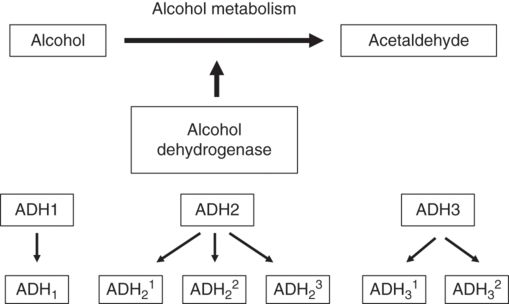
Genetic variation I alcohol dehydrogenase (ADH). There are three genetic variants in ADH2 and two in ADH3 that affect the speed of the enzyme.
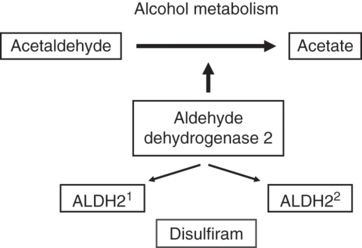
Genetic variation in ALDH2. There are two generic variants in ALDH2, one of which is of low activity (ALDH22). Disulfiram, an aversive drug that is used to aid the maintenance of abstinence, destroys the activity of ALDH2 (effectively blocking the metabolism of alcohol and thereby producing a potentially dangerous reaction).
Although ADH is the major pathway for the oxidation of alcohol, it can also be oxidized by two other enzyme systems: the microsomal ethanol-oxidizing system (MEOS) located in the smooth endoplasmic reticulum (SER), and catalase, located in peroxisomes. The contribution of catalase is thought to be minimal. The MEOS is dependent on the cytochrome P450 system, which is located on the SER. It usually plays a small role in the metabolism of alcohol, but this role increases with greater consumption. Chronic alcohol intake enhances MEOS activity by a process of inducing a form of P450 called cytochrome P450 2E1 (CYP2E1). The induction of CYP2E1 leads to an increase in the rate of alcohol metabolism and to an increased tolerance to alcohol and other drugs. Indeed, CYP2E1 may be responsible for up to 10 percent of alcohol metabolism in people with chronic drinking problems.
Extrahepatic alcohol metabolism
It is now accepted that alcohol is subjected to a first-pass metabolism by the ADH isoenzymes, primarily ADH7, in the stomach and that this represents some protection against the systemic effects of alcohol (Birley et al., 2008; Jelski, Chrostek, Szmitkowski, & Laszewicz, 2002).
Acute pharmacological effects
This section describes common acute effects of alcohol ingestion. The chronic effects are described in Chapter 5.
Cardiovascular system
Rarely will acute intoxication have serious consequences for the cardiovascular system. However, an alcohol binge, on top of a history of regular heavy drinking, has been associated with heart arrhythmias, commonly, a supraventricular tachycardia (SVT), and this has been referred to as “holiday heart syndrome.” (An SVT is an episode of a fast heartbeat, experienced as palpitations.) Spontaneous recovery typically occurs following abstinence.
Body temperature
Moderate amounts of alcohol can lead to peripheral vasodilatation, which can increase heat loss but is associated with a misleading feeling of warmth. Furthermore, increased sweating can, in turn, lead to heat loss and a fall in body temperature. Large amounts of alcohol can depress the central temperature-regulating mechanism and cause a more pronounced fall in body temperature.
Gastrointestinal tract
Alcohol can stimulate the release of the hormone gastrin, which causes the secretion of gastric acid. Lower alcohol concentration drinks are associated with a greater gastrin release and higher levels of gastric acid. Strong alcoholic drinks, however, cause inflammation of the stomach lining and produce an erosive gastritis.
Kidney
Alcohol produces a diuretic effect independent from the increased flow associated with the ingestion of large volumes of fluid. This diuretic effect is due to the suppression of vasopressin (antidiuretic hormone) release.
Respiration
Moderate amounts of alcohol may either stimulate or depress respiration. Larger amounts (e.g., 400 mg/100 mL or greater) consistently produce depression of respiration.
Central nervous system
The effects of alcohol on the brain are dependent on dose, rate of rise in BAC, and degree of tolerance. Typically, driving skill is affected at 30 mg/100 mL. Ataxia, inattention, and slowed reaction times are evident at levels of about 50 mg/100 mL. Mood and behavioural changes occur at levels of approximately 50–100 mg/100 mL. At levels of 150–300 mg/100 mL, drinkers typically experience loss of self-control, slurred speech, and clumsiness. Individuals unused to heavy drinking are moderately intoxicated at BAC levels of 150–250 mg/100 mL, and obvious intoxication is usually evident at 300 mg/100 mL. At BACs of 300–500 mg/100 mL, individuals are usually severely intoxicated, and stupor and hypothermia may sometimes supervene. Hypoglycemia and seizures are occasionally a feature of BACs in this range. Heavy drinkers become tolerant to the central nervous system effects of alcohol and may on occasion have BAC levels of 500 mg/100 mL without obvious signs of intoxication. However, for nontolerant drinkers, such levels are associated with slowed reflexes and respiration, hypotension, hypothermia, and death.
Understanding how and where alcohol affects brain function is easier when a clinician has some appreciation of the key technologies used in neuroscientific research. We therefore now provide an overview of the different kinds of neuroimaging techniques that have greatly advanced our knowledge about vulnerability to alcohol misuse or development of dependence and the impact of alcohol on the brain and its ability to recover.
Neuroimaging
Broadly speaking, imaging techniques can be broken down into three types: (1) magnetic resonance (MR), (2) radiolabeled tracers and positron emission tomography (PET) or single photon emission computed tomography (SPECT), and (3) measured electrical activity (electroencephalography [EEG], magnetoencephalography [MEG]). All are used clinically (e.g., mapping brain function around a brain tumour) as well as being powerful research tools.
For structural analysis, computed tomography (CT) is no longer used because MR offers greater resolution and the ability to differentiate white matter, grey matter, and cerebrospinal fluid. Recent structural studies suggest that both grey and white matter volumes recover with sustained abstinence (Monnig et al., 2013; Sullivan & Pfefferbaum, 2005). This is consistent with the improvements seen in cognitive functioning. More recently, another MR technique, diffusion tensor imaging (DTI) has been developed to assess white matter integrity by assessing diffusion of water in this tissue. Currently, few studies using DTI have been completed; however, changes consistent with dysregulation in white matter function have been described.
Brain function is commonly measured in terms of blood flow with functional MR imaging (fMRI). fMRI is based on the principle that deoxygenated blood has a different magnetic spin than oxygenated blood, from which blood oxygen level dependent (BOLD) contrast is derived. Therefore, activity in a brain area will alter blood flow, level of oxygenated haemoglobin, and, consequently, BOLD signal. Studies are therefore designed to have a baseline condition followed by a test condition (e.g., presentation of alcohol cues) that is repeated many times over several minutes. Alternatively, the subject may indicate when they are experiencing an “event” (e.g., craving), and the BOLD signal is compared to when they were not. fMRI is commonly used because MR machines are widely available and are a relatively cheap research tool and analytical programmes are available free online. fMRI has good temporal and spatial resolution, and individuals can undergo several scans because it is safe and generally well-tolerated.
PET/SPECT are the most powerful approaches to investigating neuropharmacology in vivo but are in limited use due to their high cost and the requirement of a particular research scanner. Because they require giving a radioactive dose, individuals generally only undergo one or two scans in research studies. Although SPECT is more widely available, PET has higher resolution and therefore is used more commonly for research.
Which neurotransmitter systems can be assessed with PET/SPECT depends on whether there is a tracer available that binds to the target of interest. Tracers are available for dopamine D2/D3 receptors and other targets of interest in addiction such as the gamma-aminobutyric acid (GABA)-benzodiazepine receptor, the serotonin transporter, and the mu opiate receptor. For others, such as glutamate N-methyl-D-aspartate (NMDA), tracers are still in development or not widely available. In addition a few tracers are sensitive to neurotransmitters in the brain so that comparing radiotracer binding in two scans provides an index of the change in neurotransmitter levels. For example, one scan acts as a baseline and another may involve either a pharmacological challenge (e.g., amphetamine to increase dopamine) or a behavioural challenge (e.g., cue-induced craving).
Magnetic resonance spectroscopy (MRS) provides biochemical or metabolic information. For example, N-acetyl aspartate (NAA) is reduced in neuronal damage; choline is associated with demyelination; and GABA and glutamate/glutamine alter with metabolism. We know that GABA and glutamate are involved in metabolism and the majority of the MRS signal comes from metabolism rather than neurotransmission.
Last, electrical activity can be measured using EEG or by measuring magnetic fields associated with electrical currents using MEG. MEG is a relatively new technique with high temporal but limited spatial resolution; it can only measure activity in upper layers of the brain.
Sites of action: Brain circuits
We now highlight key findings about brain circuits; more comprehensive reviews of neuroimaging studies in addiction are available elsewhere (Jasinska et al., 2014). Although imaging studies have revealed many similarities between alcohol and other psychoactive substances, differences have also been shown that inform our understanding of substance use disorders. The interaction of neuropharmacology and brain circuitry between nicotine and alcohol is increasingly being studied, whereas the comorbidity of alcohol use disorder and illicit drug use and/or other psychiatric disorders is less frequently investigated.
Brain responses to salient alcohol cues have been widely studied given their importance in alcohol lapse and relapse. Many studies have shown that, compared with neutral cues (such as wildlife videos or household/office objects), salient drug-related cues result in higher levels of brain activity in the mesolimbic system. The mesolimbic system is a dopamine projection from the ventral tegmental area (VTA) in the brainstem to ventral striatum (nucleus accumbens) and orbitofrontal and anterior cingulate cortices within the prefrontal cortex. There have been numerous studies of this pathway in addiction due to its important role in mediating pleasure and the motivation for so-called natural pleasures (food, sex), as well as for many substances of abuse (Figure 2.6). Thus, cue reactivity studies show greater activation in ventral striatum, anterior cingulate, insula, and VTA as well as in the hippocampus and amygdala, which are regions involved in learning and memory (Jasinska et al., 2014; Schacht, Anton, & Myrick, 2013). Such hyperreactivity is consistent with individuals reporting strong responses (such as craving) to salient cues even after years of abstinence.
Other processes of relevance to addiction, such as reward, impulsivity, and decision-making, have been investigated using appropriate psychological tasks during fMRI. For instance, the monetary incentive delay task has been widely used in other conditions to investigate anticipation of a reward. Although blunted responses associated with impulsivity have been reported in alcohol dependence (e.g., Beck et al., 2009), another study failed to replicate this using a different reward task (van Holst et al., 2014). A meta-analysis of imaging studies assessing alcohol-related reward with cue reactivity reported robust activation of a range of brain regions including the ventral striatum and those involved in decision-making, such as the anterior cingulate and ventromedial prefrontal cortex (Schacht et al., 2013). However, there was no difference in activation in these regions between those with alcohol dependence and controls; instead, greater activation was seen in alcohol dependence in areas such as the posterior cingulate. Taking all these studies together, the reward system in alcohol dependence appears dysregulated, and, at the same time, other brain regions outside the ventral striatum are also affected.
Related posts:

Stay updated, free articles. Join our Telegram channel

Full access? Get Clinical Tree


