Fig. 2.1
Alignment of the cervical spine. The following three lines normally show smooth curves: Anterior vertebral line along the anterior margins of the vertebral bodies. Posterior vertebral line which follows the posterior margins of the vertebral bodies. Spino-laminar line at the junction of the spinous processes with laminae. Note, in adults the width of the prevertebral soft tissue should be less than 7 mm at the level of C2 (star) and 22 mm at C6 (arrow)
2.2.2 Vertebrae
The common vertebra consists of the body and the arch, which enclose the vertebral foramen. The body consists of a loose trabecular bone, the spongiosa, which contains the bone marrow and is encased by the corticalis. The vertebral bodies increase in width from C2 to L3 and then decrease again in the lower lumbar spine towards the coccyx. The superior and inferior surfaces of the vertebral body are called endplates and consist of a ringlike cortical bone that surrounds the hyaline cartilage plates, which are remnants of the epiphysis of the vertebral body.
The epiphysis of the vertebral body undergoes a ring-like ossification at the age of 8 years and fuses with the vertebral body by the age of 18–21 years.
Imaging: The non-ossified epiphysis and the adjacent intervertebral disc account for the wide intervertebral distance between the ossified centres in children on CT and plain films (Fig. 2.2).
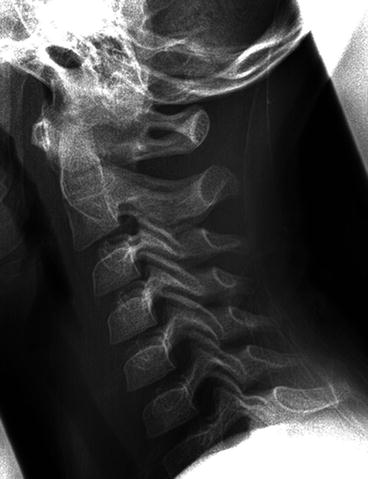
Fig. 2.2
Lateral view of the cervical spine in a 4-year-old male. Image shows wide intervertebral distance due to mainly non-ossified epiphysis of the vertebral bodies and intervertebral discs. Lateral view radiograph
At the posterior surface, an irregular-shaped aperture can be found for the exit of the basivertebral veins from the body of the vertebra. The perivenous fat leads to a bright signal in MRI on T1w. Typically, a strong enhancement can be detected after administration of intravenous contrast agent.
The non-ossified epiphysis and the adjacent intervertebral disc account for the wide intervertebral distance between the ossified centres in children on CT and plain films.
During the first months of life, the appearance of the vertebral bodies on MRI occurs through three subsequent stages:
First month (Fig. 2.3):
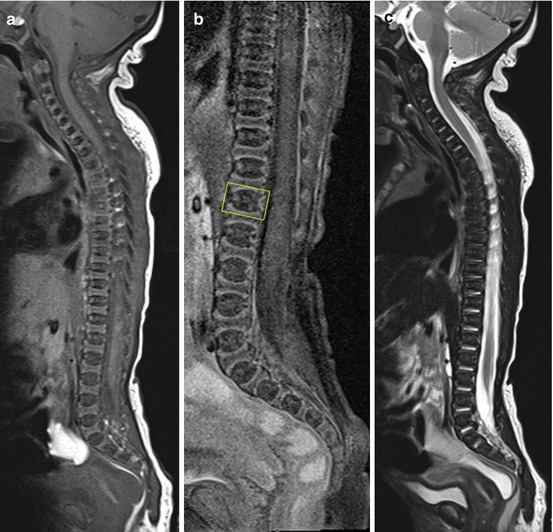
Fig. 2.3
Spine in a 2-day-old newborn. The rectangle in (b) marks the contour of the first lumbar vertebral body. Note the hyperintense and prominent cartilaginous endplates on T1w and less obvious on T2w. Sagittal T1w (a), sagittal T1with spectral fat saturation (b) and sagittal T2w (c)
The enchondral ossification centres of the vertebral bodies show a lower signal in T1w compared to muscles (Fig. 2.3a). The basivertebral veins appear as a horizontal band of high signal intensity in the centre of the osseous part. The adjacent cartilaginous endplates are markedly hyperintense on T1w compared to the osseous portion and are each about half the size of the central vertebral component (Fig. 2.3b). In T2w imaging, the osseous part of the vertebral body appears hypointense, while the endplates appear mildly hyperintense compared to muscles (Fig. 2.3c). The administration of contrast agent enhances the cartilaginous endplates and the central osseous portion.
One to six months (Fig. 2.4): The osseous portion of the vertebral body increases in signal intensity on T1w, starting at the superior and inferior portions of the body until the entire vertebral body is involved. Increasing signal intensity can also be detected on T2w until the body becomes isointense with the endplates at the age of 3 months.
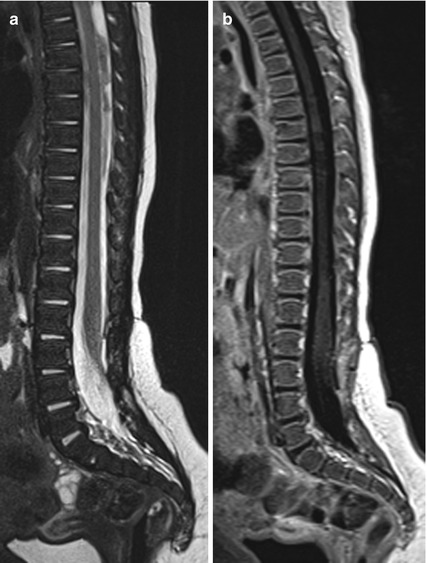
Fig. 2.4
Spine in a 7-week-old infant. The cartilaginous endplates are less prominent and hyperintense on T1w. Contrast-enhanced sagittal T1w (a) and sagittal T2w (b)
From the age of about 7 months (Fig. 2.5): The vertebral bodies become hyperintense on T1w imaging compared to the cartilaginous endplates and surrounding muscles, while the cartilaginous endplates undergo ossification and therefore decrease in signal and incorporate into the vertebral body. On T2w imaging, the whole vertebral body now shows a homogenous and mildly hyperintense signal compared to muscles.
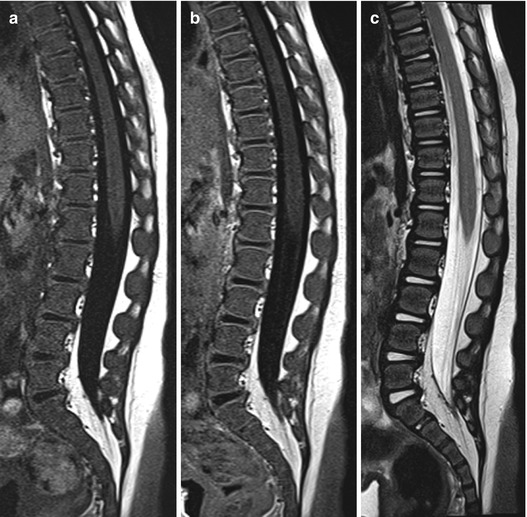
Fig. 2.5
Spine in an 8-month-old infant. Incorporation of the endplates into the vertebral body continues. On T2w the whole vertebral body now shows a homogenous signal. Note the high signal of the nucleus pulposus of the intervertebral disc on T2w. Sagittal T1w (a), contrast-enhanced sagittal T1w (b) and sagittal T2w (c)
In children and adults the signal intensity of the vertebral body depends on its marrow contents.
Imaging: For children, haematopoietic marrow is dominant resulting in a relatively low signal intensity on T1w in MRI (Figs. 2.3, 2.4 and 2.5). The red marrow contains intermixed fat so that its signal intensity in T1w is higher compared to muscles and also compared to the intervertebral disc. The haematopoietic marrow markedly enhances after administration of contrast agent.
Fatty conversion of the marrow starts at the age of 8–12 years around the central venous plexus, yielding increasing signal of the vertebral body on T1w. With increasing age, the replacement of the red marrow by fatty marrow continues.
The anterior part of the arch, which on both sides extends from the dorsolateral part of the body, is the pedicle. The dorsal part of the arch is formed by the paired lamina, which join at midline to the spinous process.
Ossification of the dorsal parts of the arch occurs at the age of 2–3 years, while fusion of the anterior part of the arch with the vertebral body takes place at the age of 3–6.
At each side, the transverse processes arise from the lateral parts of the arch. Moreover, a total of four articular processes can be found at the junction of pedicles and lamina which are called zygapophyses. Each side has a superior and inferior process, which articulates with zygapophyses of the adjacent vertebrae to the facet joint. The area between the superior and inferior articular processes is called the interarticular portion (Fig. 2.7).
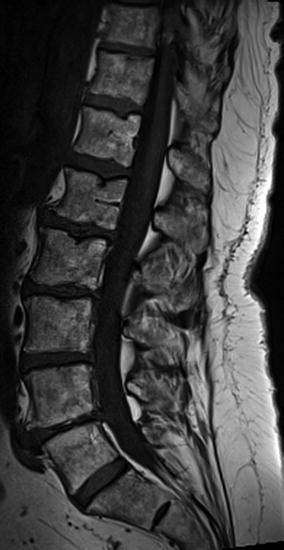
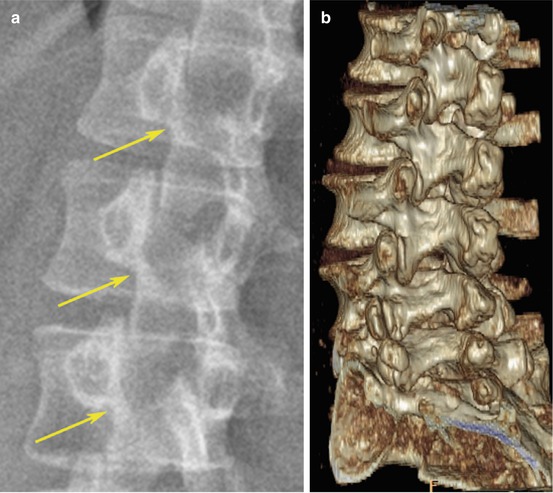
Fig. 2.6
Spine in a 69-year- old male. Sagittal T1w MRI of the lumbar spine shows inhomogeneous signal of the vertebral bodies in this older male due to focal fat deposits
Fig. 2.7
The interarticular portion. On plain film the interarticular portion can be seen best on oblique views. The posterior part of the vertebra forms the “scotty dog”. The neck of the dog represents the interarticular portion which appears as a collar if spondylosis is existent (yellow arrows). Oblique view radiograph (a) and oblique VRT-CT (b)
Around the beginning of puberty, secondary apophyseal ossification centres can be seen at the edges of the spinous and the transverse processes. Synostosis occurs by completion of growth and can be mistakenly diagnosed as a traumatic bone fragment.
Intervertebral (neural) foramen
Bounded by the pedicles, the facet joints, ligamentum flavum, the posterior surface of the vertebral body and the intervertebral disc
Contains nerve roots, dorsal root ganglion, arteries, veins and fat
Vertebral canal
Formed by the vertebral body and arch along with the adjacent vertebrae
Extends from the foramen magnum to the sacrum
Contains the spinal cord with its meninges, the cerebrospinal fluid, spinal nerve roots and small vessels
Lateral recess
The anterolateral portion of the spinal canal
Bounded anteriorly by the intervertebral disc and the vertebral body, posteriorly by the superior articular process, and laterally by the pedicle
Merging into the intervertebral foramen
Contains the spinal nerve roots (Fig. 2.8)
In older patients the vertebral bodies can show inhomogeneous signal due to focal fatty deposits and fibrous components, which may be misdiagnosed as pathology (Fig. 2.6).
The contrast enhancement of the vertebral body decreases with fatty conversion and is normally absent in older children and adults.
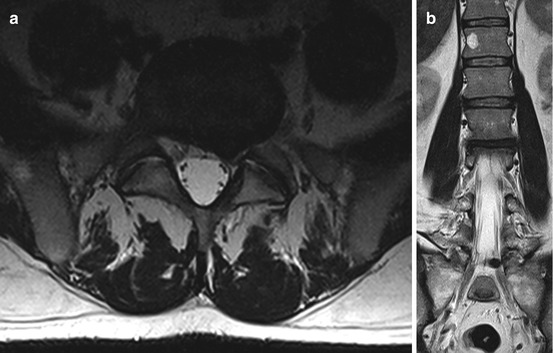
Fig. 2.8
The lateral recess with disc herniation and nerve root compression. The lateral recess is the lateral extension of the spinal canal and contains the spinal roots which can be affected, e.g. due to disc herniation at the segment L 4/5 as in this patient with a left L5 syndrome. Axial (a) and coronal (b) T2w
2.2.2.1 Specific Characteristics of the Spine
Cervical Spine (Fig. 2.9)
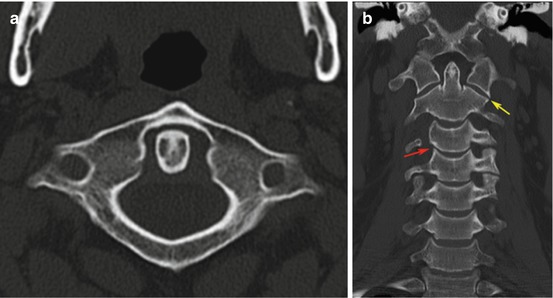
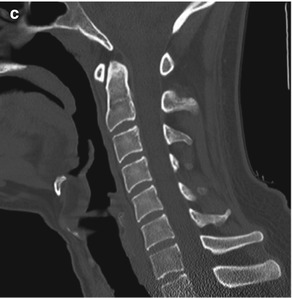
Fig. 2.9


Cervical spine, multislice-CT with axial (a), coronal (b) and sagittal (c) reformations. In the frontal view of the cervical spine, the lateral masses of C1 and C2 normally align (yellow arrow in b). Note the uncinate processes (red arrow in b). The atlanto-dental width is normally under 3 mm in adults (a, c)
Related posts:


Stay updated, free articles. Join our Telegram channel
Full access? Get Clinical Tree
