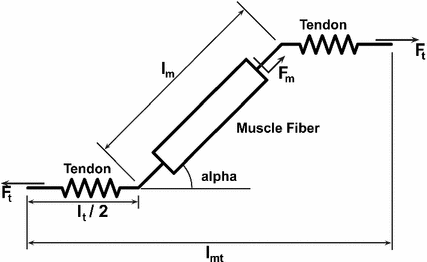
, to the tendon [136]. A common assumption is that muscle maintains a constant volume and the distance between the aponeurosis of origin and insertion is constant. The major effect on musculotendon function is that  increases as fibers shorten. Thus, muscle fibers shorten in a direction that is not colinear with the direction in which tendon stretches.
The length at which active muscle force peaks,  , is called OMFL. Notice that the shortest length at which passive muscle tissue develops force is
  . Given the OMFL and the corresponding PA,
  , at which the muscle develops the Maximum Isometric Force (MIF); the relationship between PA and Muscle Fiber Length (MFL),
  , can be expressed as the following [62]:
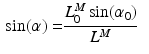
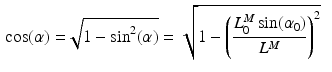
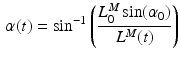
For muscles with a small PA, the PA will have little effect on the force in the musculotendon unit. However, a large PA (i.e. greater than  ) can have a significant effect on muscle force. PA can be directly derived from Eq. 1, at time t:
A muscle can be represented by n motor units being controlled by n nerve axons originating from the CNS, each with its own control  . The muscle fibers of each motor unit i collectively develop a motor unit force
  , which is most likely assumed to sum with the other motor unit forces to produce the net muscle force
  . This assumption allows us to represent musculotendon actuators with a wide range of architectures with a single dimensionless model [14].
, is called OMFL. Notice that the shortest length at which passive muscle tissue develops force is . Given the OMFL and the corresponding PA, , at which the muscle develops the Maximum Isometric Force (MIF); the relationship between PA and Muscle Fiber Length (MFL), , can be expressed as the following [62]:(1)
(2)
) can have a significant effect on muscle force. PA can be directly derived from Eq. 1, at time t:(3)
. The muscle fibers of each motor unit i collectively develop a motor unit force , which is most likely assumed to sum with the other motor unit forces to produce the net muscle force . This assumption allows us to represent musculotendon actuators with a wide range of architectures with a single dimensionless model [14].1.2 Hill-Type Muscle-Tendon Model
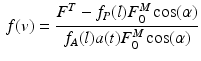
The general arrangement for a muscle-tendon model has a muscle fiber in series with an elastic or viscoelastic tendon (Fig. 1). The muscle fiber has a contractile component in parallel with an elastic component [25]. The Hill-type muscle model is used to estimate the force that can be generated by the contractile element of the muscle fiber, using a Force-Length-Velocity (FLV) relation controlled by muscle activation. The general form of the function is given by:
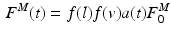
where  is the time varying muscle fiber force; f(l) is the normalized length dependent fiber force; f(v) is the normalized velocity dependent fiber force; a(t) is the time varying muscle activation; and
  is the MIF. Commonly, Hill’s equation [74] is modified and used as an expression [16, 131], although nothing precludes the use of other expressions [73].
(4)
is the time varying muscle fiber force; f(l) is the normalized length dependent fiber force; f(v) is the normalized velocity dependent fiber force; a(t) is the time varying muscle activation; and is the MIF. Commonly, Hill’s equation [74] is modified and used as an expression [16, 131], although nothing precludes the use of other expressions [73].Fig. 1
Schematic of muscle-tendon unit showing muscle fibre in series with the tendon
Muscles could be imagined having an active part which generates force when activated, like a motor, and an in-parallel passive part that applies a resistive force when stretched beyond a resting length, like a rubber band [25]. Sometimes a muscle elastic element, distinguishable from tendon elasticity is included in series with the active part, which is due to the contractile elements [136]. These yield a MIF when the sarcomeres are at an OMFL (i.e. when there is optimal overlap of the actin and myosin myofilaments). When the muscle length is above that optimal length, it cannot generate as much force because there is less actin-myosin overlap which reduces the force-generating potential of the muscle.
1.2.1 Force-Length Relation
The static property of muscle tissue is defined by its isometric Force-Length curve (FLc). This property can be studied when activation a(t) and fiber length  are constant. Full activation
  occurs when muscle tissue has been maximally excited
  . Conversely, muscle tissue that has been neither neurally nor electrically excited for a long time is said to be passive
  [136]. MIF,
  , is assumed to be proportional to Physiological Cross-Sectional Area (PCSA), where PCSA is defined as the ratio between muscle volume and OMFL:
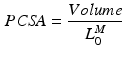
Typically, the volume of a muscle is calculated from its weight multiplied by the density of muscle tissue: 1.06 g/cm [100]. The proportionality constant relating
  to PCSA represents the Maximum Muscle Stress (MMS) [62].
are constant. Full activation occurs when muscle tissue has been maximally excited . Conversely, muscle tissue that has been neither neurally nor electrically excited for a long time is said to be passive [136]. MIF, , is assumed to be proportional to Physiological Cross-Sectional Area (PCSA), where PCSA is defined as the ratio between muscle volume and OMFL:(5)
[100]. The proportionality constant relating to PCSA represents the Maximum Muscle Stress (MMS) [62].The difference in force developed when muscle is activated and when muscle is passive is called Active Muscle Force (AMF),  .
.
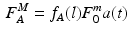
where a(t) is accounted for since the level of muscle activation determines the MIF produced by the muscle.
.(6)
The muscle force-length is also coupled to the level of activation [70]. Lloyd and Besier [88] incorporated this coupling between activation and OMFL into the muscle-tendon model using the following relationship:
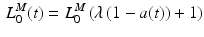
The percentage change in OMFL defines how much the OMFL shifts to longer lengths, at time t and activation a(t).
(7)
Mathematically, it is often more helpful to consider the force-length relationship in dimensionless units. Zajac [136] represented this property in terms of Normalized Muscle Force (NMF),  , and Normalized Muscle Fiber Length (NMFL),
  .
.
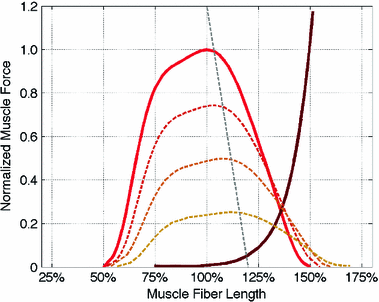
As depicted in Fig. 2, the effective operating range of muscle begins at roughly  and ends at
  ; muscle cannot generate active force beyond these lengths. Furthermore, when muscle is stretched to lengths greater than
  , it generates a significant amount of Passive Muscle Force (PMF),
  . It is due to the elasticity of the tissue that is in parallel with the contractile element. Passive forces are very small when the muscle fibers are shorter than their OMFL, and rise greatly thereafter [117].
, and Normalized Muscle Fiber Length (NMFL), .(8)
(9)
and ends at ; muscle cannot generate active force beyond these lengths. Furthermore, when muscle is stretched to lengths greater than , it generates a significant amount of Passive Muscle Force (PMF), . It is due to the elasticity of the tissue that is in parallel with the contractile element. Passive forces are very small when the muscle fibers are shorter than their OMFL, and rise greatly thereafter [117].(10)
Fig. 2
Normalized forcelength relationship for muscle. Thick dark lines indicate maximum activation, whereas the light thin lines are lower levels of activation
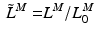
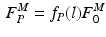
The total normalized muscle force is the sum of the active and passive components, which can be scaled to different muscles to provide total isometric muscle force,  , by:
, by:
![$$\begin{aligned} F^{M}= & {} \left[ F_{A}^{M} + F_{P}^{M}\right] \cos (\alpha )\nonumber \\= & {} \left[ f_{A}(l)a(t) + f_{P}(l)\right] F_{0}^{M}\cos (\alpha ) \end{aligned}$$](/wp-content/uploads/2016/12/A334034_1_En_5_Chapter_Equ11.gif)
It is also worth noting the importance of the fiber lengths operating range with respect to the required excursion of a muscle. Brand et al. [22] defined muscle excursion as the difference between the maximum physiological length,  , and the minimum physiological length,
  , of the muscle: the extreme lengths of a musculotendon actuator when a joint is moved through its full range of motion. For muscles with a large excursion, one can expect the value of
  to be relatively large; conversely, for muscles with a small excursion, the value of
  should be relatively small. Unfortunately, the relationship between OMFL and musculotendon excursion has been shown to vary widely among muscles, and it cannot be used to define the value of
  precisely. As discussed in [62], also the value of TSL,
  , affects the relation between OMFL and musculotendon excursion. If we assume that the total length,
  , of a musculotendon actuator is given by the sum of muscle length,
  , and tendon length,
  , then the tendon length will affect the length of the muscle when the actuator is at
  and
and  . If tendon is assumed to be sufficiently stiff so that a change in its length is negligible compared to a change in muscle length, then all variation in musculotendon length,
  , can be attributed to a change in muscle length. On the other hand, if an actuator has minimum and maximum physiological lengths which are both relatively large, then one can expect the value of TSL,
  , to be large and the value of OMFL,
  , to be small. Conversely, if
  is relatively small, then
  should be small and
  should be large. It is clear that
  ,
,  ,
,  , and
, and  are all related.
, by:(11)
, and the minimum physiological length, , of the muscle: the extreme lengths of a musculotendon actuator when a joint is moved through its full range of motion. For muscles with a large excursion, one can expect the value of to be relatively large; conversely, for muscles with a small excursion, the value of should be relatively small. Unfortunately, the relationship between OMFL and musculotendon excursion has been shown to vary widely among muscles, and it cannot be used to define the value of precisely. As discussed in [62], also the value of TSL, , affects the relation between OMFL and musculotendon excursion. If we assume that the total length, , of a musculotendon actuator is given by the sum of muscle length, , and tendon length, , then the tendon length will affect the length of the muscle when the actuator is at and . If tendon is assumed to be sufficiently stiff so that a change in its length is negligible compared to a change in muscle length, then all variation in musculotendon length, , can be attributed to a change in muscle length. On the other hand, if an actuator has minimum and maximum physiological lengths which are both relatively large, then one can expect the value of TSL, , to be large and the value of OMFL, , to be small. Conversely, if is relatively small, then should be small and should be large. It is clear that , , , and are all related.1.2.2 Force-Velocity Relation
Muscle tissue is subject to a constant tension when it’s fully activated. It first shortens then stops (i.e. isometric contraction). The length at which shortening terminates corresponds to the length at which such a force can be sustained in steady-state [136]. From a set of length trajectories, obtained by subjecting muscle to different tensions, a Force-Velocity relation can be constructed for any length  , where
  . Finally, at OMFL,
  , a Maximum Shortening Velocity (MSV),
  , can be defined from the Force-Velocity curve (FVc). At this velocity, muscle cannot sustain any tension, even when fully activated.
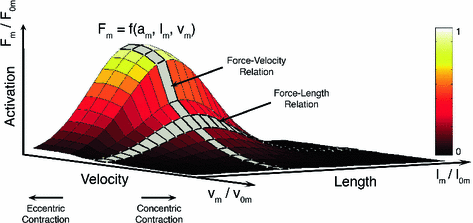
, where . Finally, at OMFL, , a Maximum Shortening Velocity (MSV), , can be defined from the Force-Velocity curve (FVc). At this velocity, muscle cannot sustain any tension, even when fully activated.Fig. 3
The Active Force-Length-Velocity (FLV) surface of muscle is defined by the muscle’s Optimal Fiber Length (OFL), Maximum Shortening Velocity (MSV), and Maximum Isometric Force (MIF). Active muscle force generation can be constrained to this surface and scaled by the level of muscle activation. Force-Length and Force-Velocity curves are highlighted in gray
The shape of the FVc determines the mechanical power output that active muscle delivers. During shortening, muscle delivers power (power output is positive), with peak power output occuring when muscle shortens at about  [136]. The shape of FVc during lengthening is very important during computer simulation of movement. Common assumption are that (Fig. 3):
[136]. The shape of FVc during lengthening is very important during computer simulation of movement. Common assumption are that (Fig. 3):1.
The FV relation scales with length and activation in one of two ways: either the velocity-axis intercept remains constant under all conditions or decreases with a(t) and  );
);
);2.
No discontinuity in slope at  exists, even though experiments and cross-bridge theory suggest one;
exists, even though experiments and cross-bridge theory suggest one;3.
The FVc at any instant is unaffected by preceding events, even though it is known that prestretched muscle tissue subsequently shortens faster.
MSV,  , is commonly defined as the number of OMFL per second, and it is treated as a constant. However, it could be varied depending on the relative fiber mixes in muscles. Yamaguchi et al. [134] listed the fiber mixture percentages to be considered as common starting point, but it is well known that people do have different fast-twitch to slow-twitch fiber ratios. A detailed discussion about the ways in which the force-length and force-velocity relationships could be most readily combined for shortening muscle can be found at [25].
, is commonly defined as the number of OMFL per second, and it is treated as a constant. However, it could be varied depending on the relative fiber mixes in muscles. Yamaguchi et al. [134] listed the fiber mixture percentages to be considered as common starting point, but it is well known that people do have different fast-twitch to slow-twitch fiber ratios. A detailed discussion about the ways in which the force-length and force-velocity relationships could be most readily combined for shortening muscle can be found at [25].Given a value of  , PA is calculated using Eq. 3. Subsequently, since the muscle-tendon length,
  , is a known input of the model (it is directly related to the musculotendon kinematics), the tendon lenght is computed as follows:
Once tendon length is established, also tendon force,  , can be determined (see Sect. 1.3). Given the total muscle force (Eq. 11), the corresponding normalized velocity dependent fiber force, f(v), can be computed as follows:
Once f(v) is calculated, we can solve for fiber velocity,  .
.
, PA is calculated using Eq. 3. Subsequently, since the muscle-tendon length, , is a known input of the model (it is directly related to the musculotendon kinematics), the tendon lenght is computed as follows:(12)
, can be determined (see Sect. 1.3). Given the total muscle force (Eq. 11), the corresponding normalized velocity dependent fiber force, f(v), can be computed as follows:(13)
.1.3 Tendon Model
Tendons are commonly defined as a external portion to muscle passive elements that act like rubber bands. Tendons do not carry any load their length is below the TSL and generates a force proportional to the stretch distance if their length is above TSL. Given the tendon length,  , tendon strain (i.e. tendon stretch relative to its resting) can be defined as follows:
Data suggest that the same strain is experienced throughout internal and external tendon. It is also convenient to assume that the Stress-Strain properties of external and internal tendon are the same, where the Tendon Stress,  , is defined by the ratio of tendon force,
  , to Tendon Cross-Sectional Area (TCSA), as follows:

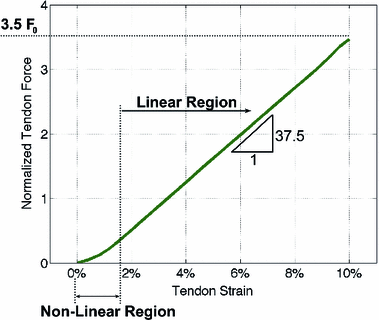
Notice that the tendon force varies with the strain only when the tendon length is greater than the TSL, otherwise the tendon force is zero. Hence, tendon behavior can be modeled through a generic Force-Strain curve (FSc). As depicted in Fig. 4, the tendon tangent modulus of elasticity (i.e., the slope of the tendon stress-strain curve) increases with strain at low strains, and then is constant at higher strains until failure. Zajac [136] observed from the literature that the strain in tendon is 3.3 % when the muscle generates MIF, corresponding to a nominal value for  of 32 MPa.
, tendon strain (i.e. tendon stretch relative to its resting) can be defined as follows:(14)
, is defined by the ratio of tendon force, , to Tendon Cross-Sectional Area (TCSA), as follows:(15)
of 32 MPa.Fig. 4
Mechanical properties of tendon
1.4 Musculo-Skeletal Kinematics
Once the muscle-tendon force is computed, it is important to compute the corresponding contribution to joint moment. This requires knowledge of the muscle’s moment arm, r, which can be shown to be a function of the muscle’s length [95]. To compute both the length and the moment arm for a musculotendon unit, a musculoskeletal model is required. Musculotendon kinematics estimations can be produced by a software that model the geometry of the bones, the complex relationships associated with joint kinematics, and the musculotendon paths wrapping around points and surfaces [41]. This is based on obstacle detection and may cause discontinuities in the predicted musculotendon kinematics [61]. On the other hand, it is desirable that musculotendon kinematics equations are continuously differentiable to enable the computation of analytical Jacobians for the forward simulation of the musculoskeletal system [2, 113].
Sets of differentiable polynomial regression equations have been proposed to estimate  and r from nominal values of both parameters corresponding to combinations of discrete joint angles or Generalized Coordinates (GCs) [95]. This required gathering data sets on both
  and r and manually identifying the best-performing equations that depended on the muscle, number of GCs, and the fitted musculotendon parameter. This necessitated computing and storing coefficients for all equations for
  and r for each muscle before use. Alternatively, continuously differentiable multidimensional cubic splines can be used, but are yet to be examined as a means to estimate musculotendon kinematics. In [113] a single spline function per muscle was used to estimate
  and r.
and r from nominal values of both parameters corresponding to combinations of discrete joint angles or Generalized Coordinates (GCs) [95]. This required gathering data sets on both and r and manually identifying the best-performing equations that depended on the muscle, number of GCs, and the fitted musculotendon parameter. This necessitated computing and storing coefficients for all equations for and r for each muscle before use. Alternatively, continuously differentiable multidimensional cubic splines can be used, but are yet to be examined as a means to estimate musculotendon kinematics. In [113] a single spline function per muscle was used to estimate and r.2 From EMG Signals to Muscle Activation
This section covers some issues related to the neural controls for a NMS systems and models. In NMS simulation environments, the neural control signal or muscle activation level defines the input of the forward dynamics used to study the human motion. This physiological command indeed specifies the amplitude and the timing of the subject’s muscle activation. It can be obtained directly from experimentally measured electromiographic (EMG) signals (EMGs control strategy) or from a synergy analysis (synergies control strategy). Both the control strategies require recording EMG signals from a set of subject’s muscles, then a pre-processing of data to obtain a neural control signals utilized in the subsequent steps. EMG pre-processing aims to cut off different non-physiologic signal components due to the acquisition process, such as motion artifacts and 50 Hz noise. It also includes the low pass filtering, to match muscle characteristics, and the optional EMG normalization procedure.
In synergies control strategies, the muscle synergies are first calculated. The main idea behind this method is to express the experimental EMG signals as a weighted sum of a limited number of muscle synergies. This analysis aims to reduce the dimensionality and the redundancy of the human motor system.
Finally, the muscle activation dynamics represent the contribution of the neural control on the activation of each muscle. Once again this processing step is common to both the strategies.
2.1 EMG Pre-Processing
Electromyography is the study of muscle function through the analysis of the electrical signals from the muscles [136]. EMG signals are emitted before muscle contraction and can be detected through superficial non-invasive electrodes. Furthermore, the EMG signal is the result of all the motor unit action potentials occurring during the contraction. This activity, measured at a given electrode location, is expressed by an electric signal (in the order of millivolts) either positive and negative.
EMG signals recording could be affected by unpredictable variables such as: the placement of the electrodes on the subject muscle, the skin characteristics, the amount of tissue between the electrodes and the muscles, the cross talk from nearby muscles, muscle fatigue, the electrodes and amplifier quality and durability through the acquisition process, the electrical and magnetic noise, etc. The influence of these external factors must be removed, or at least smoothed, before computing the muscle activation [25]. This pre-processing phase can be addressed in different ways.
The first operation is to remove any DC offset and low frequency noise that can be due to the use of low quality amplifiers or electrodes, or due to the movement of the electrodes themselves. This can be done through a high-pass filter with a cutoff frequency in the range of 5–30 Hz, depending on the type of filter and electrodes used. A good strategy is to implement a digital zero-phase delay filter (e.g., forward and backward pass 4th order Butterworth filter). This way filtering does not shift EMG signals in time. The next step is to visually inspect each obtained signal to check the presence of 50 Hz electromagnetic interference. For the affected trials a 50 Hz notch filter (usually of order 10) should be used. Then the signal must be rectified based on its the absolute value for each sample to obtain a rectified EMG signal.
2.1.1 EMG Normalization
EMG signals are extremely sensitive to a large number of external factors that can not often be controlled in clinical settings. A very comprehensive review of this problem is available in [38]. EMGs normalization aims to reduce this variability facilitating the comparison of EMG signals across muscles, subjects, or acquisition session from same subject [38, 83]. A concise and precise analysis of the importance of EMG normalization can be found in [83] with a discussion of the dangers of misinterpreting the signals when this step is not preformed correctly.
The general procedure for the EMGs normalization requires to divide the EMG from a specific task by the EMG from a reference contraction or event of the same muscle. Recent papers [28, 32, 33, 38, 77] partially discussed the benefits and limitations of different normalization methods within a more general analysis while a more complete review and critical comparison of normalization strategies can be found in [29]. According to the available results, a standard normalization procedure is still far from being defined.
One of the most used strategies, suggested also by the Journal of Electromyography and Kinesiology (JEK), is the Maximum Voluntary Contraction (MVC) normalization. This strategy divide each EMG signal by the reference one recorded during an MVC task. Similarly, the SENIAM project [96] suggests to use as denominator in the normalization process the EMG from a reference contraction, and uses MVC as an example. Both strategies refer to static MVC although it could also be dynamic. However, non of them provides a guideline to define the best strategy depending on a specific objective. Either JEK and SENIAM advised electromyographers to report information about the joint angles of the subject during the MVC acquisition. The main benefit of using MVC as normalization method is the possibility to understand the level of activation of the muscle during the task in terms of percentage of the MVC. However, electromyographers should pay high attention that subjects are reaching their true maximum contraction during the MVC acquisition, otherwise the results could be uninterpretable.
Another widely used strategy concerns a division by the peak of the EMG recorded during the task or the acquisition. This approach does not need to perform ad-hoc trials. However, most of researches indicate that this method reduces inter–subject variability and has poor intra-subject reliability. Therefore it is better to avoid the use of this strategy to compare EMGs among different trials, muscles or individuals.
2.1.2 Muscle Filtering Effect
The normalized and rectified EMG signals should be low pass filtered to match the muscle filtering effect. Indeed, although the electrical signals that pass through the muscle have components over 100 Hz, the forces that the muscle generates is at much lower frequency. There are many mechanisms in muscle that require this filtering: calcium dynamics, finite amount of time for signals propagation along the muscle, and muscle and tendon viscoelasticity. The cutoff frequency typically used is in the range of 3–10 Hz.
This step is the last one in the pre-processing of the raw EMG signals. The output of this process can be used to directly evaluate muscle activation or elaborated to extrapolate muscle synergies.
2.2 Muscle Synergies
The concept of muscle synergy was proposed for the first time by Bernstein in 1967 [17]. The idea is that the CNS uses this strategy to reduce the redundancy in the motor control task of musculoskeletal system with multiple degrees of freedom. Recent interpretations suggest that afferent signals and supra spinal descending motor control commands interact, select, and correctly activate a low-dimension set of muscle synergies through time modulated activation coefficients. Synergies can be thought as neural networks produced at corticospinal levels, specifying an invariant profile of activation for the motoneurons innervating a set of muscles [31]. The result is a weighted distribution of the neural drives to different muscles. Experimental results, obtained both in humans and animals, support the hypothesis that biomechanical tasks reflect a synergistic muscle control. Moreover, there is evidence that different biomechanical conditions, such as speed and load, share the same synergies [30, 76].
Different studies have used low-dimensional sets of multi-impulse curves within musculoskeletal models of the human lower extremity assessing the mechanical role of muscles during human locomotion [4, 93, 102] and the conceptual idea of muscle synergies in relation to the biomechanics of human and animal movement [58, 79, 94, 123, 137]. Since the multi-muscular EMG patterns observed during motor behaviors have a lower dimensionality with respect to the number of muscles and associated motor units (MTUs) [19, 37], the same excitation patterns can be expressed using a low-dimensional set of muscle synergies. Hence, a low-dimensional controller of single-impulse synergies could be designed to be generic to subjects and motor tasks, but sufficiently selective to drive a subject-specific musculoskeletal model of the human lower extremity [112]. In this same work, the static behavior and simplified structure of the generic synergies have been compensated using the experimental joint kinematics as an error correction factor. This approach provides a musculoskeletal model of human locomotion which can be operated in an open-loop forward dynamics way without using numerical optimization to match the experimental joint moments, reducing the computational cost. Moreover, since the musculoskeletal is calibrated on a specific subject, it can estimate movement-specific joint moment even if driven by subject-generic and task-generic synergies. In this scenario no EMG recordings are needed for the model operation, allowing its use in the development of neurorehabilitation technologies simplifying the human-robot interface.
A common approach to muscle synergies identification is based on a Non-negative Matrix Factorization (NMF) technique [82]. A good practice when using this technique is pre-process the data with the peak normalization strategy for EMG amplitude (Sec. EMG Normalization) where the peak is evaluated across all the available tasks. Then, a normalization in time follows [65, 76]. Finally, a  matrix is created, where m is the number of recorded muscles and n is the number of trial frames per the number of trials per the number of subjects.
matrix is created, where m is the number of recorded muscles and n is the number of trial frames per the number of trials per the number of subjects.The NMF is applied to the matrix with a number of non-negative factors identified together with their associated weightings. The extracted, experimental non-negative factors are linearly combined with their associated weightings to produce an  matrix of reconstructed EMGs and then compared to the original EMG matrix. The NMF is iterated within an optimization procedure adjusting the non-negative factors until they minimize the least squared error between experimental and reconstructed EMG data. In this procedure the dimensionality of the non-negative factor set is increased until the accuracy of the reconstructed EMG data reach a pre-defined threshold. This is assessed by means of the Variation Accounted For (VAF) index, which is defined as:
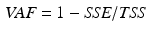
where SSE (sum of squared errors) represents the unexplained variation and TSS (total sum of squares) is the total variation of the EMG data. A minimal VAF value of  is a good choice for the threshold to consider the reconstruction quality as satisfactory [65].
matrix of reconstructed EMGs and then compared to the original EMG matrix. The NMF is iterated within an optimization procedure adjusting the non-negative factors until they minimize the least squared error between experimental and reconstructed EMG data. In this procedure the dimensionality of the non-negative factor set is increased until the accuracy of the reconstructed EMG data reach a pre-defined threshold. This is assessed by means of the Variation Accounted For (VAF) index, which is defined as:(16)
is a good choice for the threshold to consider the reconstruction quality as satisfactory [65].Several other algorithms can be used to identify muscle synergies combination. In [126] these algorithms have been compared on both simulated and experimental data sets with the main goal of investigating their ability to identify the set of synergies from a common data set. The obtained results are quite similar for all the algorithms with no significant differences in performances or accuracy.
2.3 From EMG to Neural Activation
In order to account for the time varying features of the EMG signals, a detailed model of muscle activation dynamics should be considered. In this paragraph, we will refer with the term EMGs (e(t)) both to the pre-processed EMGs and to the synthetic EMG retrieved from the weighting of the muscle synergies.
The next processing steps are indeed common to both the control strategies. The first proposal for modeling the neural activation dynamics was the following first-order linear differential equation [25, 136]:
![$$\begin{aligned} \frac{d\,u(t)}{d(t)} + \left[ \frac{1}{\tau _{\textit{act}}} \cdot (\beta + (1-\beta )e(t))\right] \cdot u(t)\frac{1}{\tau _{\textit{act}}}e(t) \end{aligned}$$](/wp-content/uploads/2016/12/A334034_1_En_5_Chapter_Equ17.gif)
where  is the time delay associated to the activation dynamics and
  is a constant that can vary in the range (0, 1). This modeling approach captures very well the activation dynamics but requires to be solved numerically for a discrete signal, using a numerical integration approach, such as Runge-Kutta algorithm. Therefore, a more efficient model is required.
(17)
is the time delay associated to the activation dynamics and is a constant that can vary in the range (0, 1). This modeling approach captures very well the activation dynamics but requires to be solved numerically for a discrete signal, using a numerical integration approach, such as Runge-Kutta algorithm. Therefore, a more efficient model is required.A critically damped linear second order differential equation has been used with quite good results [98]. An approximated version of this differential equation have been proposed [25, 110]:
where d is the electromechanical delay and the coefficients  ,
,  and
and  define the second order dynamics. The electromechanical delay have been shown to be in a range from 10 to 100 ms [25, 36]. The selection of these four parameter is critical for the stability of the equation. Therefore the following relationships must be verified:


Another condition that must be verified ensure the unitary gain of the equation:
Through the combination of previous constrains only the three parameters d,  , and
, and  are required to fully describe the transformation.
(18)
, and define the second order dynamics. The electromechanical delay have been shown to be in a range from 10 to 100 ms [25, 36]. The selection of these four parameter is critical for the stability of the equation. Therefore the following relationships must be verified:(19)
(20)
(21)
(22)
(23)
, and are required to fully describe the transformation.2.4 From Neural Excitation to Muscle Activation
This paragraph illustrates how the nonlinear relation between the neural excitation u(t) and the muscle activation a(t) can be modeled. A possible explanation for this non-linearity can be found in the size principle, i.e. the size of the recruited motor units is related to the force that has to be expressed.
Several studies have shown that the effect of this nonlinearity is significant only at lower excitation (up to 30–40 % of the maximum). For this reason, a first attempt to model this relation, presented in [133], uses a power function in the first 30–40% and a linear function for the remainder. The power function is expressed as:
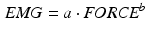
where the authors referred with EMG to the neural excitation u(t) and as FORCE to the muscle force (linearly related to the muscle activation a(t)).
(24)
Both of them indicated in capital letters to underline that are normalized to their maximum value. The coefficients a and b were computed basing on experimental measurements. However, this approach has two main disadvantages: the need to evaluate two parameters and the not-smoothed connection between the two expression.
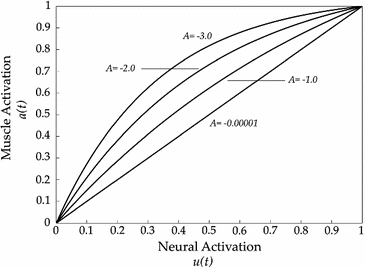
Fig. 5
Changes in the neural excitation u(t) to muscle activation a(t) curve depending on the nonlinear shape factor A
Another approach correct these disadvantages is proposed in [25, 91]. This solution uses a logarithmic function for the first 30 % and a linear expression for the reminder:
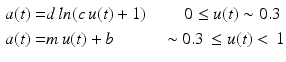
where the coefficients d, c, m, and b can be simultaneously solved and therefore reduced to a single parameter A, which characterizes the amount of nonlinearity, varying from 0 to approximately 0.12. A simpler formulation, [25, 88, 90, 92] is the following:
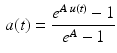
The coefficient A in Eq. 26 is named nonlinear shape factor and it is allowed to vary from 0 to  where
where  indicates a linear relationship as shown in Fig. 5. The value of A is determined through the usage of the calibration procedure.
(25)
(26)
where indicates a linear relationship as shown in Fig. 5. The value of A is determined through the usage of the calibration procedure.3 Differences in Task-Dependent Central Control Strategies for Same or Similar Joint Biomechanics
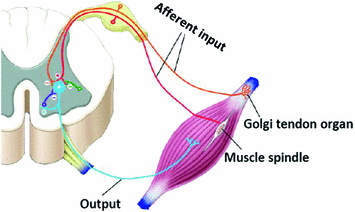
Neuromuscular control in humans is still unknown due to the high complexity of our neuro-musculoskeletal systems and its high motor redundancy [23, 81, 111]. Humans learn and adapt different dexterous tasks in an interactive manner with external environments taking advantage of their past knowledge of motor actions and their biomechanical structure. [18, 116, 130]. Many elements in the human body dynamically cooperate to perform tasks planned in the brain. Task parameters are planned in different areas in the brain, known as central control unit, to create a motor program that contain the necessary central motor command to perform the task. The central motor commands are then transmitted through the brain stem and spinal cord to alpha-motor neurons which are known are local controllers of the muscular system Fig. 6. Motor neurons in spinal cord drive the muscle contraction to actuate skeletal segments that in turn generate the desire motion and dynamic properties (i.e. forces and torque). Sensory signals are sent to local and central control units during the action execution to modulate the dynamic properties in the biomechanical system.
 Cord Plasticity and Neuromodulation After SCI
 Rehabilitation Therapy: Recovery Mechanisms and Their Implications for Machine Design
 Technologies for Cerebral Palsy
 in Neurorehabilitation and Neural Engineering
 Technologies for Spinal Injury
 Technologies Application in Stroke and Traumatic Brain Injury Patients


Related posts:
Rehabilitation Therapy: Recovery Mechanisms and Their Implications for Machine Design
Technologies for Spinal Injury
Technologies Application in Stroke and Traumatic Brain Injury Patients
Stay updated, free articles. Join our Telegram channel
Full access? Get Clinical Tree
