Fig. 1
Illustration of a selection of measured parameters. Above: CTA, below: DSA. Left: Initial imaging at admission. Right: imaging during the vasospasm period. The petrous or cavernous segments (depending on visibility) were taken as reference for normalization in the AP view. A Middle cerebral artery, M2 segment; B M1 segment of the middle cerebral artery; C anterior cerebral artery, A1 segment; D and E internal carotid artery, cavernous and petrous segments, respectively
Results
Between 2009 and 2012, we retrospectively studied 128 cases of aneurysmal subarachnoid hemorrhage. Of these, a total of 91 patients underwent CTA due to clinically suspected vasospasm (the appearance of a new neurological deficit or increased Doppler velocity values). Of these, 38 patients had DSA within 24 h of CTA and were available for the final analysis. Fifteen of these were men and 23 women with ages ranging from 42 to 64 years (mean, 53 years). The mean time difference between the CTA and DSA was 10 h and 18 min. A total of 627 arteries were studied in both CTA and DSA. We assessed the correlation between CTA and DSA at admission and at clinical onset of CVS. The correlation between CTA and DSA at admission was 0.641 (p < 0.0001; Fig. 2). The correlation between CTA and DSA in the vasospasm period was 0.835, with a significant p value (p < 0.0001; Fig. 2). The overall correlation regardless of the timing of the imaging between CTA and DSA was 0.706, with a significant p value (p < 0.0001; Fig. 2). The correlations for the different measured arterial segments are displayed in detail in Table 1. All proximal arterial segments (BA, A1, M1, P1) revealed significant correlations between CTA and DSA (p < 0.05). However, distal arterial segments appeared to not be reliable enough for the assessment of the arterial diameter on CTA, with a low correlation (p > 0.05). The correlation for the proximal middle cerebral artery (M1) is displayed in Fig. 2.
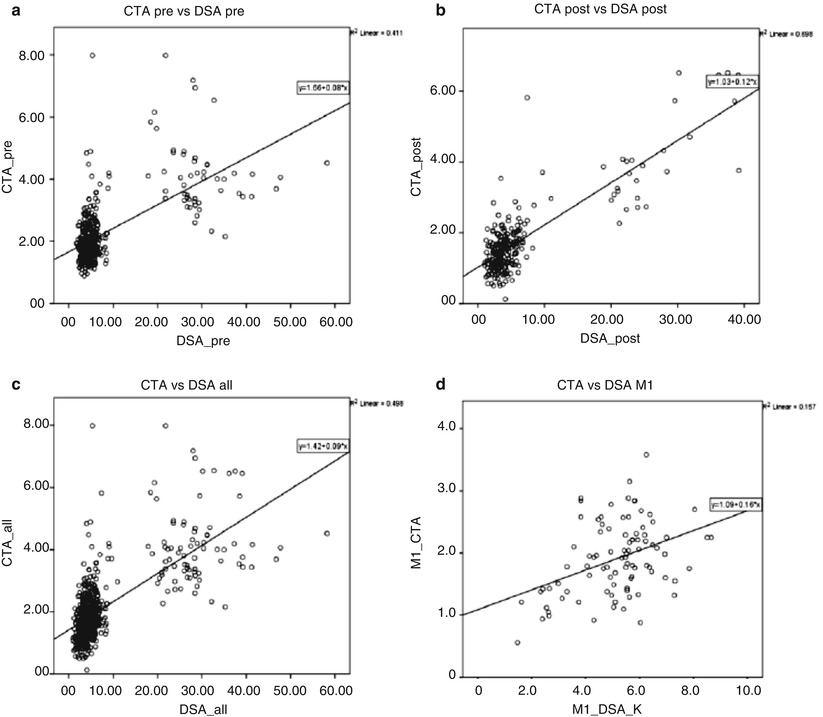
Fig. 2
The x-axis represents diameters obtained from DSA after normalization. The y-axis represents diameters obtained from CTA. (a) CTA and DSA by admission before the vasospasm period showed a significant correlation of 0.641 (p < 0.0001); (b) CTA and DSA also correlated in the vasospasm period (Pearson coefficient of 0.835 (p < 0.0001)); (c) the overall correlation of CTA and normalized DSA values was good, at 0.706 (p < 0.0001); (d) example of correlation between CTA and DSA of M1 segment caliber showing a correlation of 0.396 (p < 0.0001)
Table 1
Pearson’s Correlation Coefficient and significance levels were calculated for CTA and DSA in the following artery segments: M1 (proximal middle cerebral artery), M2 (post bifurcation branches of middle cerebral artery), A1 (anterior cerebral artery), A2 (pericallosal artery), P1 (pre-communicating posterior cerebral artery), P2 (post-communicating posterior cerebral artery), and basilar artery trunk
Segment | Correlation | P-value |
|---|---|---|
A1 | 0.488 | <0.0001 |
A2 | 0.149 | 0.152 |
M1 | 0.396 | <0.0001 |
M2 | 0.093 | 0.385 |
P1 | 0.344 | 0.003 |
P2 | 0.201 | 0.078 |
Basilar | 0.450 | 0.005 |
Discussion
The main finding of this study is that CTA is a reliable, fast, and noninvasive tool to assess proximal cerebral artery diameters during the management of cerebral vasospasm after aSAH. CTA has emerged as an alternative noninvasive modality for imaging of the cerebral arteries. Its usefulness was demonstrated for imaging and therapeutic decision making for cerebral aneurysms [3–5]. In this study, we assessed the reliability of CTA as a noninvasive, alternative imaging tool for the diagnosis of cerebral arterial vasospasm. Angiographic vasospasm is seen up to 40–70 % of patients and leads to ischemic deficits in 15–36 % of patients [6–9]. It usually occurs in a delayed fashion from 48 h to 14 days after hemorrhage [10, 11]. CTA has been compared with DSA for assessment of vasospasm in several prospective [12, 13] and retrospective [1, 14–16] studies. These studies showed high accuracy of CTA for the diagnosis of severe and proximal vasospasm. However, there is little mention of how vessel diameters were measured, and inaccuracies induced by using maximum intensity projections on CTA or by the lack of a millimeter scale in DSA have not been addressed to date. By normalizing all arterial diameters to the diameter of the extradural segment of the internal carotid artery, we tried to develop an objective and easy tool for clinicians to evaluate vasospasm in patients after aneurysmal SAH. This method succeeded in all proximal artery segments independently of the time point of measurements. Moreover, our study yielded lower correlation between CTA and DSA for the diagnosis of peripheral vasospasm as compared with proximal vasospasm. This finding confirms the notion that in vasospasm, the evaluation of post-bifurcation segments A1, M2, and P2 is beyond the resolution of CTA. Another limitation is poor image quality of CTA caused by movement artifact or the presence of streak artifacts from metal devices that obscure adjacent arteries.
Related posts:
 Role of Erythropoietin in Aneurysmal Subarachnoid Haemorrhage: From Bench to Bedside
Modulation of Spreading Depolarizations
Factors of Temporary Arterial Occlusion During Anterior Communicating Artery Aneurysm Repair
Impairment in Aneurysmal Subarachnoid Hemorrhage Patients with Delayed Cerebral Infarction: Prevalence and Pattern
Role of Erythropoietin in Aneurysmal Subarachnoid Haemorrhage: From Bench to Bedside
Modulation of Spreading Depolarizations
Factors of Temporary Arterial Occlusion During Anterior Communicating Artery Aneurysm Repair
Impairment in Aneurysmal Subarachnoid Hemorrhage Patients with Delayed Cerebral Infarction: Prevalence and Pattern
 Changes in Brain Tissue Oxygen During Endovascular Treatment of Cerebral Vasospasm
 Secondary Injury After Subarachnoid Hemorrhage in Light of Multimodal Advanced Neuroimaging, Intracranial and Transcranial Neuromonitoring: Beyond Vasospasm
Stay updated, free articles. Join our Telegram channel

Full access? Get Clinical Tree


