Fig. 28.1
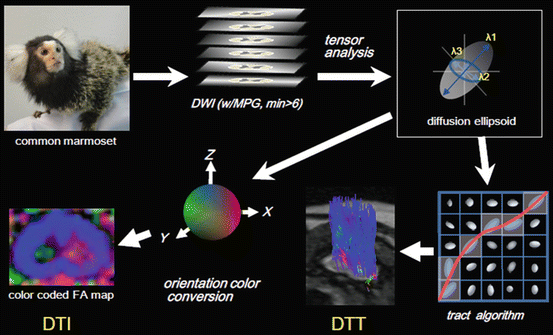
Diffusion of water molecules. (a) Isotropic diffusion is represented as a sphere. (b) Anisotropic diffusion is approximated by a diffusion ellipsoid. The diffusion ellipsoid is calculated from an eigenvalues (λ 1, λ 2, λ 3) and eigenvectors (v 1, v 2, v 3)
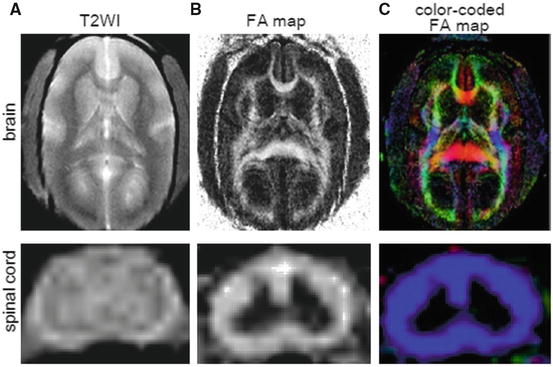
Fig. 28.2
Conventional MRI and diffusion tensor imaging in the brain and spinal cord of a living common marmoset. (a) T2-weighted MR images. (b) FA maps. (c) Color-coded FA maps. (Reprinted from Fujiyoshi et al. [31])
Color-Coded FA Maps and RBG Color: FA maps that show anisotropy in different colors according to its axis are called color-coded FA maps (or “color maps”). Color maps make it possible to differentiate fibers based on the direction in which they run. The colors are arbitrary, but red (Red) is often assigned to the left-right, blue (Blue) to the superior-inferior, and green (Green) to the anterior-posterior orientation, and this system is referred to as RBG color [35]. Figure 28.2 shows a color map of an axial section of the common marmoset spinal cord, in which the white matter fibers can be seen as blue tracts in the craniocaudal direction.
Diffusion Tensor Tractography: MRIs that make use of tensor analysis, such as FA maps and color maps, are collectively called DTI. In the broadest sense DTT can be considered a subtype of DTI, but DTT is often deliberately differentiated from DTI. DTT reveals the course of fibers, such as those in the white matter, by tracking the direction of the major axis of the ellipsoid of every voxel, i.e., by tracking the predominant directions of anisotropy and reconstructing it in three dimensions. Numerous algorithms for tracking anisotropy exist, but the fiber assignment by continuous tracking (FACT) algorithm [36] is the best known. Simply stated, the fiber tracts are reconstructed by tracking the major axis of the largest diffusion ellipsoid for every neighboring pixel (voxel). DTT can clearly depict white matter fibers, such as the CST and corpus callosum in the brain, which have been difficult to distinguish by conventional MRI, and there is even a report of it being used for neurosurgical navigation [37]. An advantage of DTT is that the researcher or clinician can selectively choose the information to be depicted any number of times, by setting a region of interest (ROI).
Several software programs have been developed for DTT analysis, but we use the free software dTV for DTI analysis developed by the Image Computing and Analysis Laboratory, Department of Radiology, University of Tokyo Hospital, Japan. The dTV software is available at http://www.ut-radiology.umin.jp/people/masutani/dTV.htm [10]. The steps for performing DTI and DTT are shown in Fig. 28.3.
28.4 DTT of the Spinal Cord
Clinical Need for DTT of the Spinal Cord: The spinal cord white matter is composed of many nerve fiber bundles, but tissue specimens appear uniform, and it is impossible to observe the individual projections unless a special dye is used. Moreover, because proton relaxation times are very similar for different fiber bundles, it is impossible to tell them apart by DTI, even using the black and white contrast provided by T1- or T2-weighted MR imaging (T1WI or T2WI). Thus, although information about fiber tracts and the integrity of axons in the spinal cord is extremely important, it has been difficult to obtain in vivo. Even when the latest artifact-reducing imaging sequences and high-magnetic-field MRI scanners are used, the fiber bundles comprising individual tracts in the spinal cord white matter cannot be distinguished. To make a prognosis or select the appropriate treatments for the spinal cord injuries that we have discussed here, it is extremely important to know where axons have been destroyed or demyelinated and to what extent axons have been spared. Until now however, even using the best imaging technology available, T1WI and T2WI, only the location of the injury and the degree of compression have been detectable.
In the last decade or so, many reports have described the use of DTT to depict neuronal fibers in the white matter of the brain. High-resolution data for the spinal cord, in contrast, has been difficult to obtain, because the spinal cord is smaller than the brain, it is located deep in the body, and imaging it requires discriminating among tissues and materials with different magnetic properties, such as the spinal cord white matter, cerebrospinal fluid, vertebrae, muscle, and air that are intermingled within a small space [19, 20]. Thus, although occasional reports on the use of DTT to depict the spinal cord in humans have been published, their precision has been low, and few have included histological studies [23–25]. To apply DTT of the spinal cord clinically, this method must be verified by conducting a detailed comparison between the DTT and histological findings. We therefore performed DTT imaging of the spinal cord in a primate, the common marmoset, and examined its accuracy by conducting comparative tissue studies.
DTT of the Cervical Cord of a Primate, the Common Marmoset: We created a reproducible model of SCI in the common marmoset, which is a primate and therefore more closely related than rodents to humans, and found that the transplantation of human neural stem cells contributed to functional recovery in this model [1, 8]. Unfortunately, there are still no reports of curing complete spinal cord injuries in humans, although functional recovery can be anticipated if approximately 5–10 % of the axons are spared from injury. At the animal experiment level, injured axons can be evaluated histologically by injecting a tracer, such as biotinylated dextran amine (BDA), into the primary motor cortex of the cerebrum, but such an analysis obviously cannot be used in the clinic.
To examine whether DTT might be used to assess injured axons in humans, we first used it to examine common marmosets with spinal cord injuries. In these animal experiments, the images and spin-echo sequence were acquired by a 7-Tesla MRI, and we obtained the first clear DTT depiction of the primate spinal cord [37]. To determine whether the DTT results accurately reflected the condition of the axons, we created a simpler cervical cord (C5/6) hemisection injury model and performed DTT 2 weeks later after sacrificing the animal (postmortem model). In a reconstruction of the nerve fiber interruption, DTT clearly depicted the hemisection injury, which was detectable by conventional MRI only in the form of T1 and T2 contrast (Fig. 28.4). Moreover, the DTI and DTT results reflected the histological results obtained with Luxol fast blue (LFB) and other staining methods.
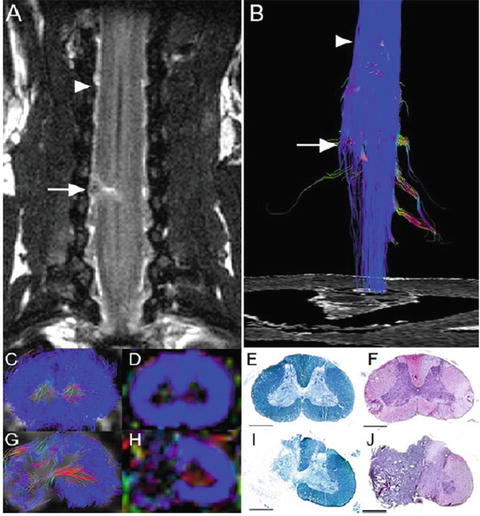

Fig. 28.4
DTT of the hemisected spinal cord at 2 weeks after injury in a postmortem common marmoset. (a) Coronal T2-weighted MRI depicted the hemisection injury as a low-intensity area with no change in the cord caudal to the injury. (b) DTT of the hemisected spinal cord. The ROI was placed in the upper cervical spinal cord and DTT was traced in the caudal direction revealing disruption of white matter fibers on the hemisected side. The traced tracts became untraceable at the injury site while tracts on the contralateral side continued caudally. Arrows indicate the hemisection site and arrowheads indicate the point 8 mm cranial to the injury site in (a) and (b). DTT (c, g), FA map (d, h), LFB staining (e, i), and HE staining (f, j) of the spinal cord 8 mm cranial to the injury site (c–f) and at the hemisection site (g–j). While normal FA and anatomy of the spinal cord was confirmed cranial to the hemisection site, there was a significant decrease in FA of the white matter fibers at the hemisection site (g and h). Consistent with these changes in DTT (g) and color-coded FA map (h), demyelination was seen at the hemisection site (i). (Scale bars: 1 mm). (Reprinted from Fujiyoshi et al. [38])
Next, by optimizing the depth of anesthesia to minimize artifacts from respiratory movements and cerebrospinal fluid pulsation, and by making various modifications based on the findings in the postmortem model, we were able to use DTT to reproducibly depict the different fiber tracts of the spinal cord in living common marmosets (Fig. 28.5). Moreover, we were able to depict the pyramidal decussation with DTT, which has been difficult to depict by other methods (Fig. 28.6), and demonstrated that DTT was could be used as a tool for fiber tracking instead of conventional tracers.
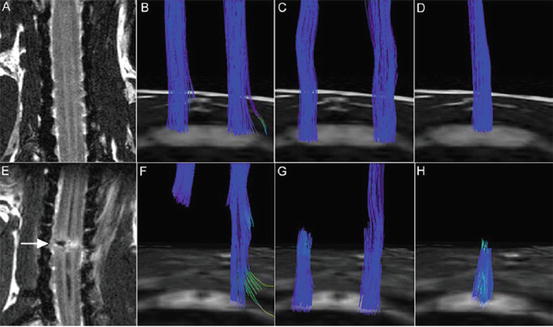
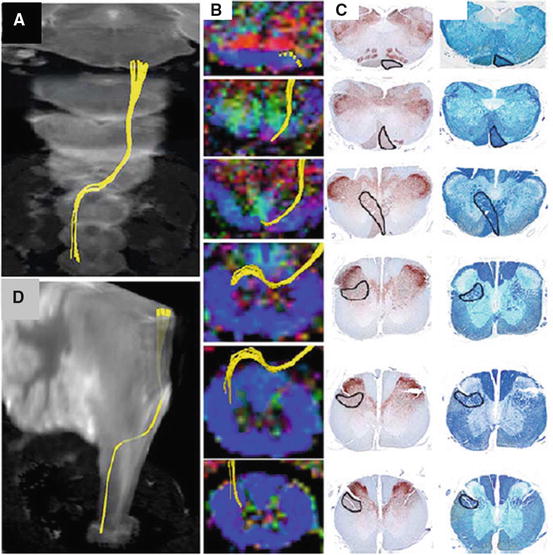

Fig. 28.5
In vivo pathway-specific DTT of intact and injured spinal cords in live common marmosets. (a–d) T2WI and tract-specific DTT of the intact spinal cord. (e–h) Hemisected spinal cord 2 weeks after injury. DTT of the CST (b, f), spinothalamic tract (c, g), and dorsal column-medial lemniscus pathway (d, h) in both groups revealed tract disruption at the hemisection site (C5/6 level) in all pathways. Although there are some limitations, pathway-specific DTT conducted in live animals yielded results similar to those observed in postmortem animals, especially with respect to major tract morphology. (Reprinted from Fujiyoshi et al. [38])

Fig. 28.6
Pathway-specific DTT in a postmortem common marmoset revealing the course of the corticospinal tract with pyramidal decussation. (a, b) DTT of the pyramidal decussation superimposed on three dimensional MR images to macroscopically confirm that the pyramidal decussation was depicted in the proper height in the medulla and the upper cervical cord, using the cerebellum as a reference point. (c) DTT of the pyramidal decussation superimposed on axial color-coded FA maps. (I) Axial histological slices of the same points in (c) stained for CaMKII-α to reveal the location of CST fibers (d) and LFB to delineate the configuration of the white matter (e). In each slice, the area through which the DTT CST tract passes was positive for CaMKII-α and LFB, confirming the accuracy of DTT. (Scale bars: 1 mm) (Partial modification of Fujiyoshi et al. [38])
We also performed longitudinal DTT, behavioral, and histological analyses before and after contusive SCI in common marmosets. By comparing the tract fiber estimate depicted by DTT with neuronal fibers labeled with anti-neurofilament antibodies, we determined the optimal fractional anisotropy (FA) threshold for fiber tracking to be 0.40. The ratio of the number of tract fiber estimate at the lesion site to the number before SCI was significantly correlated with the functional recovery after SCI. Moreover, comparison of the longitudinal pre- and post-SCI FA and axial diffusivity (λ∥) values revealed that they decreased after injury at the sites caudal to the lesion epicenter in the CST and rostral to the lesion epicenter in the dorsal column [39] (Figs. 28.7 and 28.8). In summary, diffusion imaging is more sensitive than conventional MRI for precisely determining the extent of spinal disorders via noninvasive, longitudinal examinations, in both human patients and animal models. Moreover, FA analysis may prove more useful than other diffusional indices, because of its simplicity, accuracy, and ability to reveal diverse spinal cord disorders especially in the clinical situation.
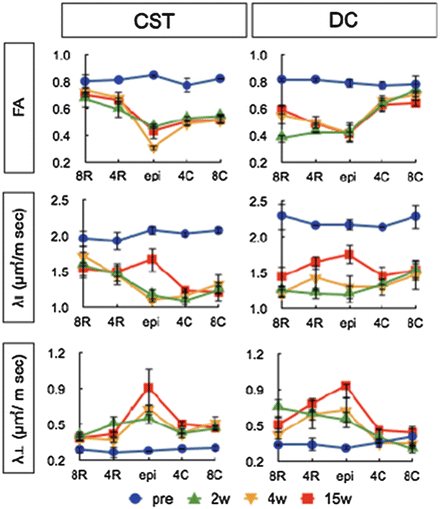
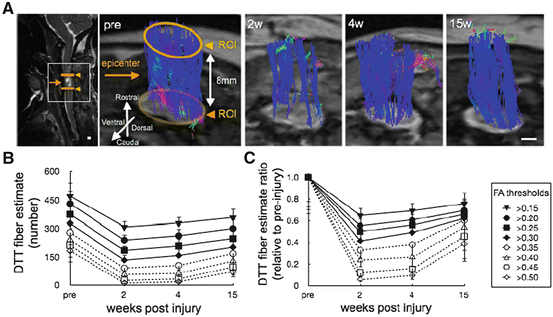

Fig. 28.7
Alteration in FA values in corticospinal tract- and dorsal column-specific ROIs. Changes in the FA, λ∥, and λ⊥ values for the CST- and DC-specific ROIs at sites epicenter (epi), 4 and 8 mm rostral away from the lesion epicenter (4R, 8R), 4 and 8 mm caudal away from the lesion epicenter (4C, 8C). FA and λ∥ values of the CST at epi, 4C and 8C were significantly lower than the pre-injury values after the injury. In contrast, the FA and λ∥ values of the DC at epi, 4R and 8R were significantly decreased after the injury and gradually recovery in FA was shown. λ∥ and λ⊥ values were increasing in epicenter of both DC and CST in chronic phase. (Reprinted from [39])

Fig. 28.8
Change in DTT fiber estimate over time after SCI with different FA thresholds. (a) Time-dependent changes in DTT fibers estimate after contusive SCI shown by two ROI-based fiber tracking (FA threshold >0.20; 50° angle of deflection threshold; 8 mm distance between the two ROIs). The yellow arrow indicates the lesion epicenter and yellow arrowheads indicate the rostral and caudal ROIs. Quantitative analysis of the number of two-ROI DTT fiber estimate (b) and its value relative to the pre-injury fiber estimate (c) using different FA thresholds. (b) The number was lower 2 weeks after injury compared with their pre-injury number and gradually increased. The number of DTT fiber detected decreased as the FA threshold increased. (c) The pattern of change in the DTT fiber estimate ratio was similar to that in the number of DTT fiber estimate. The DTT fiber estimate ratio decreased as the FA threshold increased. Scale bar indicates 0.5 mm. (Partial modification of [39])
28.5 DTI of the Spinal Cord
As the performance of MRI devices improves, the number of DTI studies of the spinal cord should increase. There are two categories of such studies. One involves visualizing the spinal cord disorders by tractography, including the visualization of inflammatory and degenerative disorders [40, 41], the localization and characterization of spinal cord tumors [25, 42], and characterization of the deformation and interruption of local fibers caused by arteriovenous malformations [43] and Brown-Sequard syndrome [44].
The other category involves the quantitative analysis and examination of correlations between diffusion and both functional and histological conditions. Budde et al. revealed that axial diffusion in the ventrolateral white matter in the experimental autoimmune encephalomyelitis (EAE) mouse model was significantly negatively correlated with the EAE clinical score and was significantly lower in mice with severe EAE than in mice with moderate EAE [45]. In the ventral white matter tracts of the spinal cord of ALS-affected mice, the diffusion values altered with disease progression [46, 47]. In an SCI study, Kim et al. identified the spared, normal ventrolateral white matter by the hyperacute axial diffusion 3 h after injury, and a histological analysis performed 14 days later showed a good correlation with the spinal contusion injury [48]. Loy et al. demonstrated that axial diffusion in ventral white matter differentiated mild, moderate, and severe contusive SCI, with good histological correlation [49]. In summary, these recent studies indicate that the quantitative DTI parameters are sensitive and specific biomarkers for spinal cord white matter integrity.
Several clinical studies suggest that the increased sensitivity of DTI makes it appropriate for the early detection of myelopathic changes in patients with cervical myelopathy. A significant positive correlation between the FA at the compressed level and the clinical assessment has been demonstrated [50, 51]. This correlation was also seen in patients with SCI [23, 52]. Chang et al. revealed that quantitative fiber tract results correlate to some extent with the severity of cervical SCI in patients [53].
28.6 Limitations of DTT and Future Prospects
Resolution: DTT does not depict the axons themselves, although this is frequently misunderstood. The voxel size required for analyzing anisotropy is far greater than the diameter of an axon, so the diffusion anisotropy of fiber bundles composed of 102–103 axons or more is what is actually depicted.
Depiction of Complicated Axonal Pathways: Closely related to the resolution problem, the anisotropies of fibers oriented in different directions within the same voxel sometimes cancel each other out. This is the result of a partial volume effect that stops the tracking. Conversely, if the anisotropy is not cancelled out, the sum of the conflicting information allows tracking, but sometimes leads to the depiction of a structure that cannot actually exist. Therefore, DTT images do not always reflect actual anatomical structures. We have addressed this issue by setting a threshold value for FA that reduces the likelihood of depicting an erroneous tract and setting a threshold value for anisotropy tracking that prevents sharp changes in direction. At present, we consider it necessary to interpret DTT results cautiously, drawing on all of the anatomical and histological information available, just as when reading ordinary MRI scans. Complicated, multiaxial neural pathways can be analyzed by using a high b value3 [54, 55]. By increasing the b value, we have succeeded in clearly depicting the optic chiasm (Fig. 28.9), brain stem, and cervical nerve roots (Fig. 28.10), but because these analyses require an enormous amount of time, they have not reached the point of clinical application.
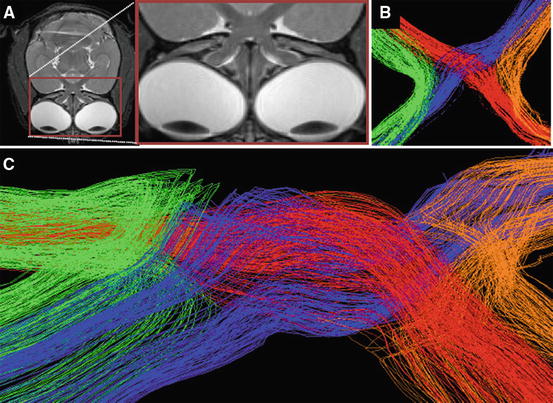
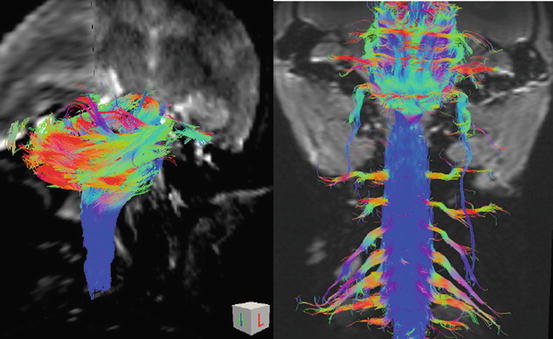

Fig. 28.9
HARDI (high angular resolution diffusion imaging) of the optic chiasma in the common marmoset. (a) T2-weighted MR images (axial) of the common marmoset brain. (b, c) Overview (b) and frontal view (c) of HARDI in the optic chiasma. HARDI was found to depict the path of the optic nerve in a more anatomically and histologically correct manner

Fig. 28.10
HARDI (high angular resolution diffusion imaging) of spinal cord, the brain stem, cervical nerve roots, and cranial nerves in the common marmoset
Thus, the b value is an index that indicates the degree of diffusion, and higher b values mean greater diffusion. For the DTT images that we obtained in this study, we used b = 1,000. By contrast, a “high” b value is 2,500 or more, which makes it possible to detect intracellular diffusion and the diffusion of more complicated nerve pathways that cannot be perceived by conventional DWI.
28.7 Clinical Application of DTT
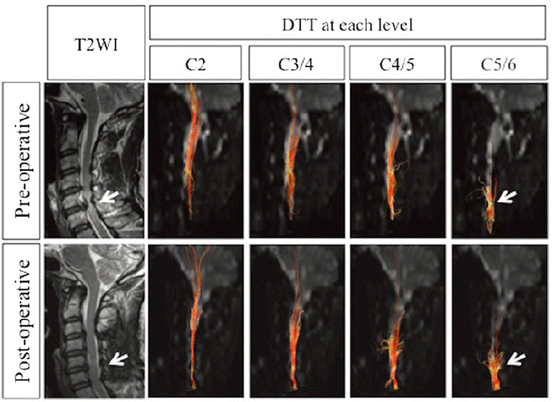
By exploiting our DTT findings from the spinal cords of marmosets, we have already applied this method clinically to a fairly large number of cases. We are currently assessing the usefulness of DTT for examining cervical spondylotic myelopathy [56] (Fig. 28.11), ossification of the posterior longitudinal ligament (OPLL), and spinal cord tumors, as well as SCI [31] (Fig. 28.12). The application of DTT is restricted to diseases of the cervical region, because it is difficult to obtain high-resolution images in the trunk, which currently prevents detailed analysis. We hope that future advances in the development of MRI hardware and software will enable researchers to overcome the problems of long image acquisition time and resolution. Moreover, we believe that by revealing more anatomical structural information about the tracts, it will be possible to detect and evaluate the lesions of even more spinal cord diseases.

