Fig. 6.1
(a) (Aphasia score) Change in aphasia test scores pre and post sham or rTMS treatment. There is a significant larger change in global aphasia scores for the TMS group. In the AAT subtest, a significantly larger change for the TMS group was observed in picture naming and trends in the subtests comprehension, token test, and writing. No difference was observed for word repetition. (b) (AVI) The activation volume index is a measure of task associated activated brain volume with positive values indicating larger activated networks in the left hemisphere. The graph shows the treatment-associated changes in AVI. In the TMS group, larger networks are recruited in the left hemisphere after the treatment (positive change in AVI indicates left-ward shift), whereas no such shift of network activity to the left hemisphere occurs in sham-treated subjects. (c) (Correlation) Significant linear relationship between left-ward shift in network activity (AVI) and change in global aphasia test score
During verb stimulation before initiation of treatment, all patients showed an abnormal activation pattern involving large parts of the language network in the nondominant right hemisphere (Fig. 6.2).In right-handed patients who received real rTMS over the contralesional IFG before each SLT session, a shift of activation to the ipsilateral dominant hemisphere was observed, and the change in the activation volume (AV) indices (AVI calculated from: AV ipsilat – AV contralat divided by AV ipsilat + AV contralat) was significantly larger (36.6 ±31.55) than in sham-stimulated patients (−7.6 ± 45.42), P = 0.006, paired t-test), thus indicating a larger shift of network activity toward the left, ipsilesional hemisphere (Fig. 6.1b). There was a significant interaction between treatment effect and AVI before and after treatment (P = 0.023) (Fig. 6.1c). There was no difference in AVI within the sham group between the two time points and between the sham and tms group prior to treatment. However, AVI was significantly higher in the rTMS group after treatment when compared to pretreatment (P = 0.001) and to sham group (Fig. 6.2b).
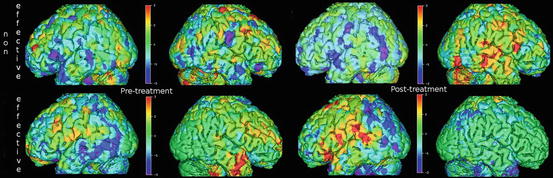
Fig. 6.2
(Effect shift) Language activation PET scans of a sham-treated subject (top row) show bilateral activity pretreatment, which consolidates in the right hemisphere after treatment (non-effective shift). In a TMS-treated subject (bottom row), the initially bilateral activity shifts to the left hemisphere posttreatment (effective shift)
In our study PET could be applied during NIBS to demonstrate the immediate modulation of network activity as well as longer-lasting alterations related to recovery, thus lending direct support to the hypothesis of the relationship between activation shift and improvement of subacute poststroke aphasia. The results of this randomized controlled trial with rTMS of the contralesional homotopic IFG indicate that NIBS is more efficient than sham treatment in right-handed patients in the subacute stage after stroke. Although only one stimulation site was tested in different types of aphasia, the intervention group experienced a significantly larger improvement in the global AAT score than the sham group. Our study demonstrated again the change in activation pattern in all patients and the rTMS effect, which is based on the inhibition of overactivation in homotopic speech areas of the contralesional hemisphere. As a proof of principle, the shift of activation back to the dominant hemisphere was associated with significant improvement of the language function in the group treated with rTMS combined with SLT. However, in the sham-treated group, the activation in the contralesional hemisphere usually became more accentuated, despite this group showing some improvement of language function after SLT.
As a consequence, determination of altered activation patterns in poststroke aphasia by fMRI or PET might help to select the best stimulation site – e.g., the contralateral homotopic Broca’s or Wernicke’s area (Abo et al. 2012) – and will be of importance in patients with altered speech dominance. Two populations that may exhibit altered speech dominance are left-handed and right-handed patients with so-called crossed aphasia. In both left- and right-handed subjects, language dominance is thought to be distributed along a continuum from pure left over relative bilateral to predominantly right-sided dominance based on functional imaging and evoked flow transcranial Doppler studies (Knecht et al. 2000). While a right-ward dominance pattern is rare in right-handers, it is more frequently observed in left-handers. It has also been shown that the extent of right-sided dominance (independent of handedness) predicts the efficacy of rTMS applied to the left hemisphere to interfere with language processing (Knecht et al. 2002). The exact localization of language functions in right hemispheric aphasia could be determined in selected cases by PET of glucose metabolism (Cappa et al. 1993), by direct cortical stimulation (Oishi et al. 2006), or by fMRI (Vandervliet et al. 2008). However, contrary to right-handers, TMS did not achieve a significant shift of network activity back to the ipsilesional hemisphere in two left-handed patients with right hemispheric dominance (Heiss et al. 2013). This finding might point against the hypothesis that the situation in left-handed aphasics is a simple reversal of the mechanisms in right-handers and that recovery might depend much more on the preexisting bilateral network organization than in right-handers. This preliminary observation indicates that a patient’s susceptibility to develop aphasia after stroke is strongly related to the preexisting dominance pattern. To what extent the recovery from aphasia is related to this is unknown. In these cases identification of the activation pattern in poststroke aphasia might give hints for the changes in the functional network and for eventually effective modifications by NIBS.
References
Baker JM, Rorden C, Fridriksson J (2010) Using transcranial direct-current stimulation to treat stroke patients with aphasia. Stroke 41(6):1229–1236PubMedCentralCrossRefPubMed
Barwood CH, Murdoch BE, Whelan BM, Lloyd D, Riek S, O’Sullivan J, Coulthard A, Wong A, Aitken P, Hall G (2011) The effects of low frequency repetitive Transcranial Magnetic Stimulation (rTMS) and sham condition rTMS on behavioural language in chronic non-fluent aphasia: short term outcomes. NeuroRehabilitation 28(2):113–128PubMed
Brady MC, Kelly H, Godwin J, Enderby P (2012) Speech and language therapy for aphasia following stroke. Cochrane Database Syst Rev (5):CD000425
Cappa SF, Perani D, Bressi S, Paulesu E, Franceschi M, Fazio F (1993) Crossed aphasia: a PET follow up study of two cases. J Neurol Neurosurg Psychiatry 56(6):665–671PubMedCentralCrossRefPubMed
Eliassen JC, Boespflug EL, Lamy M, Allendorfer J, Chu WJ, Szaflarski JP (2008) Brain-mapping techniques for evaluating poststroke recovery and rehabilitation: a review. Top Stroke Rehabil 15(5):427–450PubMedCentralCrossRefPubMed
Engelter ST, Gostynski M, Papa S, Frei M, Born C, Ajdacic-Gross V, Gutzwiller F, Lyrer PA (2006) Epidemiology of aphasia attributable to first ischemic stroke: incidence, severity, fluency, etiology, and thrombolysis. Stroke 37(6):1379–1384CrossRefPubMed
Related posts:
 Basic Principles of rTMS in Motor Recovery After Stroke
Therapeutic Applications of rTMS for Aphasia After Stroke
Basic Principles of rTMS in Motor Recovery After Stroke
Therapeutic Applications of rTMS for Aphasia After Stroke
 rTMS in Dysphagia After Stroke
Therapeutic Applications of rTMS for Tinnitus
rTMS in Dysphagia After Stroke
Therapeutic Applications of rTMS for Tinnitus
 Neurophysiology of rTMS: Important Caveats When Interpreting the Results of Therapeutic Interventions
 rTMS in Visual Hemineglect After Stroke
Stay updated, free articles. Join our Telegram channel

Full access? Get Clinical Tree


