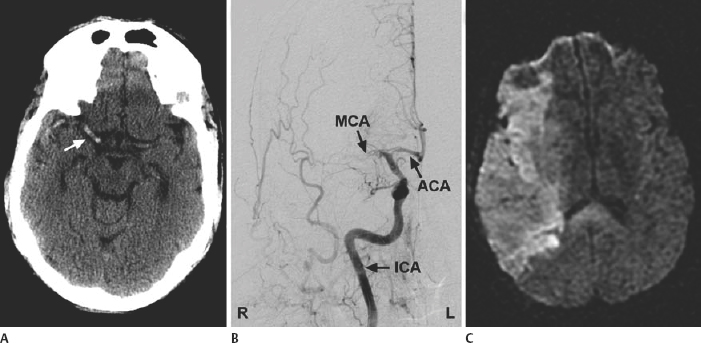
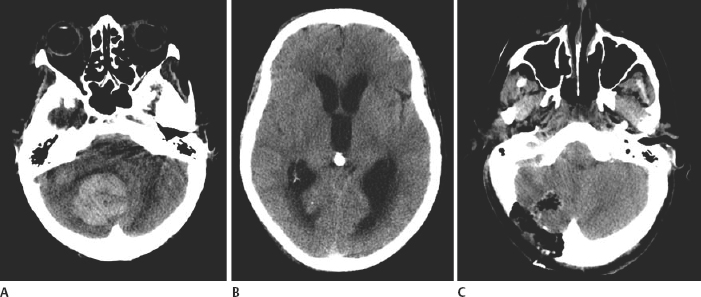
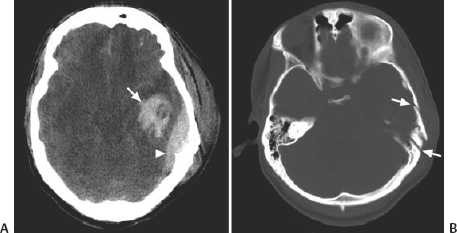
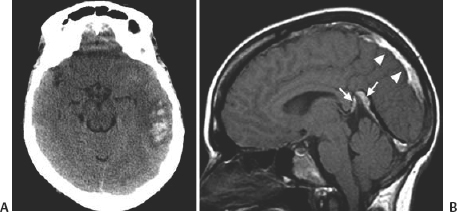
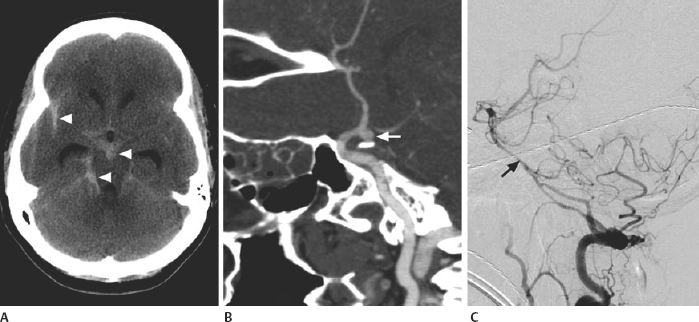
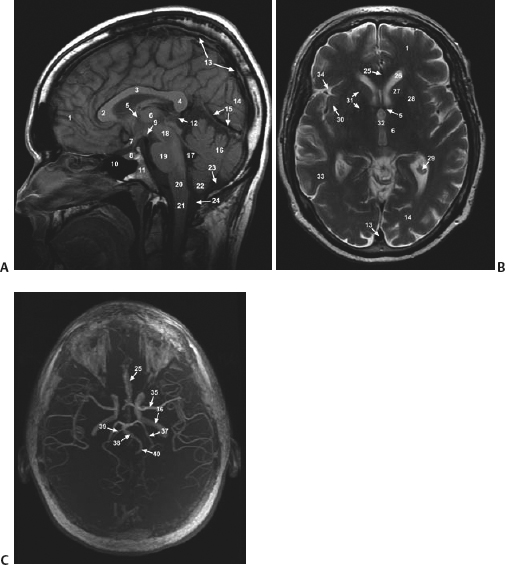
21 Basics of Neuroimaging Chitra Venkatasubramanian and Christine A. Wijman Imaging of the central nervous system (CNS) has undergone exciting advances in the last decade, and one can now choose from a variety of imaging techniques to detect, monitor, and treat neurologic diseases. However, this has also led to increasing challenges with regard to which imaging modality to choose for a particular disease, when to order a study, what to look for in a scan, and how to recognize critical information that needs immediate attention. The imaging studies that are most commonly ordered in the neuro-intensive care unit (NICU) are CT (computed tomography), CTA (CT angiography), MRI (magnetic resonance imaging), MRA (MR angiography), and digital subtraction angiography (DSA). CT uses x-rays and radiation detectors to measure the degree of attenuation of x-rays during passage through tissues and a computer to transform the information into a cross-sectional image. Helical CT involves continuous rotation of the x-ray tube during simultaneous movement of the CT table. Three-dimensional (3D) data are acquired and then divided into individual slices of variable thickness. The absorption coefficients (or degree of attenuation) are measured in Hounsfield units (HU) with the resultant image in varying shades of black, gray, and white, depending on the HU of the tissues (Fig. 21.1). Tissues with higher HU appear bright on CT (e.g., bone, acute blood), and those with lower HU appear dark (e.g., cerebrospinal fluid [CSF], air, fat) as compared with the brain parenchyma. Bone is +1000 HU, water is 0, and air is -1000 HU. Fig. 21.1 Noncontrast-enhanced head computed tomography (CT) scan showing normal anatomy. (A) Level of the rostral pons, (B) level of the third ventricle, (C) level of the pineal gland, and (D) level of the corona radiate. (1) Frontal sinus, (2) frontal lobe, (3) sylvian fissure, (4) temporal lobe, (5) uncus, (6) pons, (7) fourth ventricle, (8) temporal horn of lateral ventricle, (9) insula, (10) third ventricle, (11) cerebral peduncle, (12) midbrain, (13) superior colliculus, (14) quadrigeminal cistern, (15) vermis of the cerebellum, (16) occipital lobe, (17) falx cerebri, (18) genu of corpus callosum, (19) caudate, (20) septum pellucidum, (21) thalamus, (22) pineal gland (calcified), (23) putamen, (24) internal capsule, (25) lateral ventricle, (26) foramen of Monro, (27) parietal lobe, (28) corona radiata. Noncontrast-enhanced CT is readily available, noninvasive, and cheap and is the first choice for scanning in emergency situations. With a short acquisition time and low susceptibility to motion, it is particularly advantageous for postoperative, critically ill, and restless patients. It can be used in patients with MRI contraindications (e.g., pacemakers, large body habitus, metallic fragments near the eye). It can also accommodate ancillary equipment (e.g., ventilators). Furthermore, the recent introduction of portable CT scanners offers the option to image the brain in patients who are too unstable to be transported. Fig. 21.2 Acute ischemic stroke. (A) Noncontrast head computed tomography scan 3.5 hours after acute onset of left hemiplegia shows hyperattenuation of the right middle cerebral artery (MCA) (arrow) in the sylvian fissure (“dense MCA sign”). (B) Cerebral angiogram 1.5 hours later shows abrupt cutoff of the right MCA just beyond the internal cerebral artery (ICA) bifurcation into the MCA and anterior cerebral artery (ACA). (C) Axial diffusion weighted magnetic resonance imaging scan 24 hours after stroke onset demonstrates restricted diffusion (bright area) involving the entire right MCA territory. Fig. 21.3 Intracerebral hemorrhage. (A, B) Noncontrast-enhanced head computed tomography scan shows a large right cerebellar hemorrhage, extending into the cerebellar vermis with brainstem compression, obliteration of the fourth ventricle, and obstructive hydrocephalus. (C) The patient subsequently underwent emergent right suboccipital craniotomy and hematoma evacuation. Fig. 21.4 Head trauma. (A) Noncontrast-enhanced head computed tomography (CT) scan in a patient with traumatic brain injury shows a left temporal contusion (arrow) and epidural hematoma (arrowhead), diffuse subarachnoid hemorrhage, and cerebral edema with obliteration of the basal cisterns. (B) CT (bone window) shows multiple fractures of the temporal bone and mastoid (arrows), underlying the epidural hematoma. Fig. 21.5 Cerebral venous thrombosis. (A) Noncontrast-enhanced head computed tomography (CT) scan shows a left temporal hemorrhagic venous infarct secondary to transverse sinus thrombosis, which was diagnosed by CT and magnetic resonance (MR) venogram. (B) Sagittal T1-weighted MR image from a different patient shows bright signal along the posterior two-thirds of the superior sagittal sinus (arrowheads), the straight sinus, and the vein of Galen (arrows), consistent with (subacute to early chronic phase of) cerebral venous thrombosis. Fig. 21.6 Subarachnoid hemorrhage. (A) Noncontrast head computed tomography (CT) scan shows subarachnoid blood (arrowheads) in the basal cisterns, right sylvian fissure, and along the tentorium with associated hydrocephalus. (B) CT angiography (reconstructed sagittal view) shows a saccular aneurysm of the left posterior communicating artery (arrow). (C) Cerebral angiogram (right vertebral artery injection, lateral view) 10 days later shows severe vasospasm of the basilar artery (arrow). Contrast-enhanced CT involves intravenous injection of iodinated contrast, which appears bright on CT. Contrast-enhanced CT is useful for visualizing blood vessels and studying diseases that result in blood-brain barrier (BBB) leakage (e.g., meningitis, brain tumors, brain abscesses). Iodinated contrast is contraindicated in patients with a serum creatinine >2 mg/dL (unless the patient is already receiving renal replacement therapy) and in those with a history of allergic reactions to contrast, iodine, or shellfish. Pretreatment can be given in those with a contrast allergy (methylprednisolone 50 mg intravenously [IV] x 1 prior to contrast administration and 50 mg IV 6 hours later, along with diphenhydramine 50 mg 1 hour prior to contrast). The most important measures to prevent nephrotoxicity are adequate hydration and discontinuation of nephrotoxic medications. CTA involves the administration of a time-optimized bolus of contrast through a peripheral vein (typically an 18- or 20-gauge IV). Blood vessels (up to 1 mm) are enhanced, and the resultant information is processed by a computer and displayed as 2D or 3D black-and-white or color images. CTA can be acquired in minutes and is ideal for vascular imaging of neuro-ICU patients. The venous phase of CTA gives excellent anatomical detail of the cerebral veins and sinuses for diagnosis of cerebral venous thrombosis (CVT). However, CTA is a structural study, not a dynamic study, and does not provide information about blood flow. A blood vessel may opacify fully with contrast but still have impaired flow. CT perfusion (CTP)2 is a newer technique for qualitative and quantitative assessment of brain perfusion. CTP uses a bolus injection of IV contrast with dynamic acquisition of sequential CT slices to track the “first pass” of the contrast through the head and neck vasculature. Cerebral blood flow, blood volume, and mean transit time maps are obtained. Brain areas with decreased perfusion appear as a change in intensity/color on these maps. Quantification of cerebral blood flow, blood volume and transit time is possible with specialized software. Though some scanners only provide information at 2 levels, newer scanners can provide information over multiple levels. The total body dose of radiation delivered from CTP is slightly more than that of non-contrast HCT (2.8 mSV vs 1.5-2.5 mSV respectively). Water and fat in body tissues have weakly magnetic hydrogen protons. These align briefly with a strong external magnetic field from the MRI scanner and are subsequently disturbed with a radiofrequency (RF) pulse. Once this pulse is turned off, the proton “relaxes” back to its original alignment and emits a weak radio signal. A computer combines all such signals to create an magnetic resonance (MR) image.3 The following are the routinely obtained MR sequences. These sequences are based on measures of independent proton relaxation mechanisms obtained by varying the RF pulse. The different T1 and T2 times of body tissues result in contrast between tissues. T1 gives excellent anatomical detail (Fig. 21.5B, Fig. 21.7A), whereas T2 is especially sensitive to tissue water (Fig. 21.7B, Fig. 21.8). Most pathologic processes of the brain are associated with increased water (edema) and appear “dark” on T1 and “bright” on T2 (Table 21.1).
Imaging Modalities
Computed Tomography

Noncontrast-Enhanced Head Computed Tomography
Clinical Indications and Uses
Limitations
Contrast-Enhanced Head Computed Tomography
Computed Tomography Angiography
Clinical Indications and Uses
Computed Tomography Perfusion
Clinical Indications and Uses
Magnetic Resonance Imaging
T1- and T2-Weighted MRI Scans
Related posts:


Stay updated, free articles. Join our Telegram channel

Full access? Get Clinical Tree


