Fig. 2.1 Contributions of diffusion and CSF flow to blood–CSF barrier function. Molecules in serum at a concentration C S diffuse through the tissue along the diffusion pathway (x) into the CSF of the subarachnoid space (concentration in CSF: CL). The molecular flux J depends on the local concentration gradient c/x or dc/dx and the diffusion coefficient D (Fick’s First Law). When the CSF flow rate decreases (and thus also the volume turnover), the molecular flux, which remains steady, enters a smaller volume, and thus the concentration of proteins in the CSF rises. As the concentrations (CL) change, the local gradient (dc/dx) changes as well (Fick’s Second Law). This is why the bulk CSF flow rate (F) has a nonlinear influence on blood-derived proteins in CSF—that is, on the blood–CSF barrier function. The flow rate of a molecule in the CSF is r= F/A, with A being the variable cross-section of the subarachnoid space volume fraction, Δs, = A • Δ y. J has a reciprocal relation to the flow rate of a molecule in CSF, r.
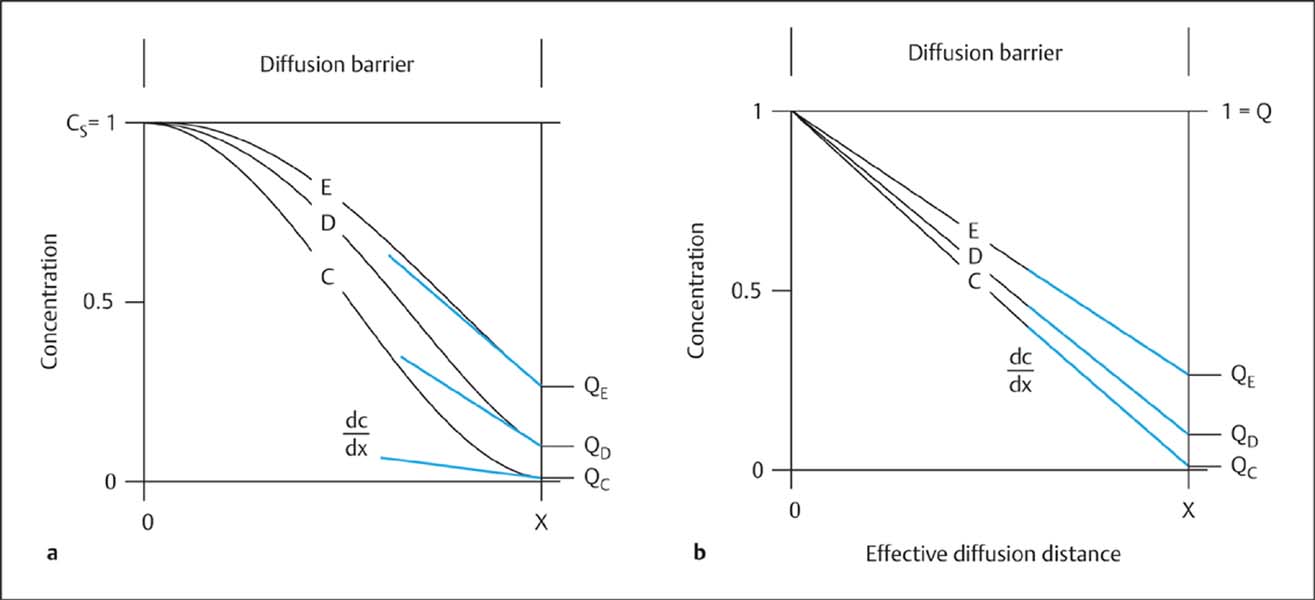
Fig. 2.2 a, b Dynamics of blood-derived proteins between blood and CSF before (curve C) and after (curves D and E) pathological reduction of the CSF flow rate. Comparison of the nonlinear model (a) with the linear model (b) of the blood/CSF protein concentration gradient. The serum concentration (CS) of an individual protein has been normalized, its maximum value being CS = 1. Corresponding CSF concentrations are presented as dimension-free CSF/serum quotients (QC, QD, QE) with values ranging between 0 and 1. The idealized diffusion barrier is illustrated as the effective diffusion distance (x) (Reiber, 1994 a). As the CSF flow rate drops (from C to E), the protein concentration rises (e. g., IgM). The calculated overall ratio between blood and CSF concentrations is the same in a and b, but in a the local concentration gradient (dc/dx) at the border with the subarachnoid space (at x) increases in curves C to E, due to the increasing mean penetration depth (Reiber, 1994 a), whereas in the linear model (b) it decreases. The molecular flux J (Fig. 2.1) increases nonlinearly from C to E (a), whereas it would decrease linearly from C to E in model b. Only the nonlinear model can give a quantitative explanation of the empirically observed nonlinear increase in CSF protein concentration as CSF flow rate drops and QAlb increases (Figs. 2.4 and 2.5).
The blood–brain barrier is defined in morphological terms, whereas the blood–CSF barrier is defined in terms of function: after all, CSF protein concentrations are measured a long way away from the actual “barrier”—after a long CSF pathway with constant opportunities for exchange—and then related to the serum concentration in venous blood.
Biophysical Model of Blood–CSF Barrier Function
Comparison with earlier models. The new paradigm of blood–CSF barrier function and dysfunction was derived from the laws of diffusion (Reiber, 1994 a, 1994 b). It replaces many linear and nonlinear empirical data fits that were not supported by any physiological or biophysical theory (for references see Reiber, 1994 a). The essential difference of the new paradigm from earlier models, which assumed that the overall concentration gradient between blood and CSF was linear (Fig. 2.2 b), is that it assumes a nonlinear concentration gradient between blood and CSF, with a steady state between molecular diffusion and CSF flow rate (Figs. 2.1, 2.2 a). In this molecular flux/CSF flow model, proteins diffusing from the blood through the tissue into the CSF are eliminated by bulk flow with the passing CSF, and these two processes create a dynamic equilibrium—a steady state. Without CSF flow, the protein concentration in CSF would gradually approach the serum concentration (as it does in a corpse shortly after death, when CSF flow ceases).
Protein concentrations in CSF. The sigmoid change in tissue concentration along the diffusion barrier from the blood into the CSF (Fig. 2.2 a) is determined by:
• Diffusion.
• CSF flow rate.
The rate of protein diffusion into the CSF space—the molecular flux (J in Fig. 2.1)—depends on:
• The size of the protein molecules (Table 3.1).
Related posts:


Stay updated, free articles. Join our Telegram channel

Full access? Get Clinical Tree


