Fig. 1
(a) Schematic drawings of experimental design. (b) Schematic drawing of samples dissection and collection at the ischemic penumbra for TEM assays. MB methylene blue; REP reperfusion; MCAO middle cerebral artery occlusion; TEM transmission electron microscope; ADC apparent diffusion coefficient; T2WI T2-weighted Imaging; TTC 2,3,5-triphenyltetrazolium chloride
MR Imaging
Sequential MRI was performed in 15 rats (MRI: n = 7 for MB-treated rats, n = 8 for vehicle-treated rats) at 0.5, 2.5, and 48 h post-occlusion on a 7.0 T scanner (BioSpec, Bruker, Billerica, Germany) with a four-channel phased-array rat-head coil. Diffusion-weighted images (DWI) were acquired using a spin-echo echo-planar-imaging sequence with the following parameters: field of view (FOV) = 4 × 4 cm, matrix = 128 × 108, slice thickness (THK) = 1 mm, repetition time (TR) = 4500 ms, echo time (TE) = 35 ms, number of averages (NA) = 1, b values = 1000 s/mm2. Quantitative maps of the apparent diffusion coefficient (ADC) were calculated based on two different b-values (0, 1,000 s/mm2). T2-weighted turbo-spin echo images (T2WI) were acquired using a fast spin echo sequence (FOV = 4 × 4 cm, matrix = 320 × 240, THK = 1 mm, NS = 20, NA = 1, TR = 3140 ms, TE = 37 ms). Image analysis was performed using OsiriX software (http://www.osirix-viewer.com). For the lesion size quantification on T2WI and ADC maps, the lesion and brain areas in the same slice were delineated by two people by consensus using an operator-defined region of interest (ROI) on each of the lesion-containing slices, and the volume of the lesion and brain regions were then summed for each animal. The contralateral brain area was also measured using the same methods. The area of the different structures involved in the ischemic process was delineated on the images according to rescaled drawings from the Paxinos and Watson atlas [25]. The hyperintense pixels in T2WI and hypointense pixels in ADC in the ipsilateral cortex were then selected as those with a significantly higher or lower signal (p < 0.05) than in the contralateral hemisphere. The lesion volume on T2WI (Vu) and ADC were determined as the sum of the hyper- or hypointense area in each slice multiplied by the slice thickness. To compensate for the effects of brain swelling, a corrected lesion volume (Ve %) and brain swelling (Swelling %), expressed as the volume increase of the affected hemisphere, were calculated using following equation as previously described [10]:
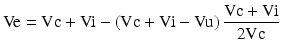
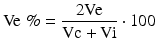
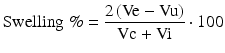 where Ve and Vu indicate corrected and uncorrected lesion volume, respectively, and Vi and Vc indicate volume of the ischemic and contralateral hemisphere, respectively.
2,3,5-Triphenyltetrazolium Chloride (TTC) Staining
TTC staining was performed in separate groups of rats at 48 h after stroke for final lesion volume analysis (n = 8 for MB-treated rats, n = 7 for vehicle-treated rats). The rats were deeply re-anesthetized with chloral hydrate at a dose of 800 mg/kg. The rats were sacrificed by decapitation and brains were harvested and cut into 2-mm-thick coronal sections. The sections were incubated in 2 % solution of TTC (Sigma Chemical, St. Louis, MO) for 15 min and then fixed in 4 % buffered formaldehyde solution for 24 h. Images of the stained sections were captured using a scanner (N-TEK NuScan 900, San Jose CA. USA) and analyzed for infarct volume using Image-J (NIH, Bethesda, Maryland). Percentage of infarct volume (Infarct %) was calculated using the following equation as previous described [34]:
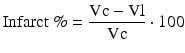 where Vc is the volume of contralateral hemisphere and Vl is the volume of nonischemic tissue in the lesion hemisphere. Brain swelling (Swelling %) was calculated as previously described [10]:
 where Vi is volume of ischemic hemisphere.
Transmission Electron Microscopy
For the TEM study, three rats from each group were sacrificed at 2.5 or 48 h after tMCAO or sham surgery (n = 3 each). Rats were anesthetized and perfused with 4 % paraformaldehyde and 2.5 % glutaraldehyde buffer (pH 7.4). The brains were harvested and the ischemic penumbra was dissected as described previously [2]. Briefly, a 2-mm section was cut at 5 mm from the anterior tip of the frontal lobe. A longitudinal cut was made from top to bottom approximately 2 mm from the midline through the ischemic hemisphere of this section. Then, a transverse diagonal cut was made at approximately the “one o’clock” position to separate the core (i.e., striatum and overlying cortex) from the penumbra. Brain blocks (1 × 1 × 1 mm3) were separated from the penumbra region (Fig. 1B). The samples were then fixed in 1 % osmium tetroxide, dehydrated in graded ethyl alcohol, and embedded in epoxy resin. The epoxy-embedded blocks were sectioned with an ultramicrotome (Leica, UC6, Wetzlar, Germany), placed on 200-mesh copper grids, and then stained in saturated uranyl acetate and lead citrate. Sections (40-nm thick) were analyzed using H-7650 transmission electron microscope (Hitachi, Chiyoda, Tokyo).
Statistical Analysis
The data are presented as mean ± standard error of the mean (SEM). Independent t-test and the Mann-Whitney U-test were performed to compare the differences between the MB-treated and vehicle-treated group. A two-tailed value of p < 0.05 was taken to be statistically significant.
Results
Acute Treatment of MB Reduced ADC and T2WI Lesion Volume Induced by Transient Focal Cerebral Ischemia
We determined the effect of acute MB treatment on the progression of ADC and T2WI lesion induced by transient focal cerebral ischemia. At 0.5 h after tMCAO, ADC detected ischemic lesion within the MCA territory, including basal ganglia and the frontoparietal cortex, in both vehicle and MB treated rats. No significant difference was found in ADC lesion between vehicle- and MB-treated groups, which were 266.5 ± 15.13 and 284.31 ± 18.73 mm3, respectively (p > 0.05, Fig. 2a, b). The ADC-defined ischemic lesion was partially recovered at 1.5 h after reperfusion (2.5 h after stroke) in both vehicle- and MB-treated rats, which were 70.19 ± 20.37 and 53.99 ± 13.29 mm3, respectively (p > 0.05). At 48 h after stroke, the ADC lesion increased, accompanied by T2WI lesion. The final ADC lesion volume at 48 h after MCAO was 346.76 ± 15.01 and 219.6 ± 16.58 mm3 in vehicle-treated and MB-treated groups, respectively (p < 0.001, Fig. 2a, b).
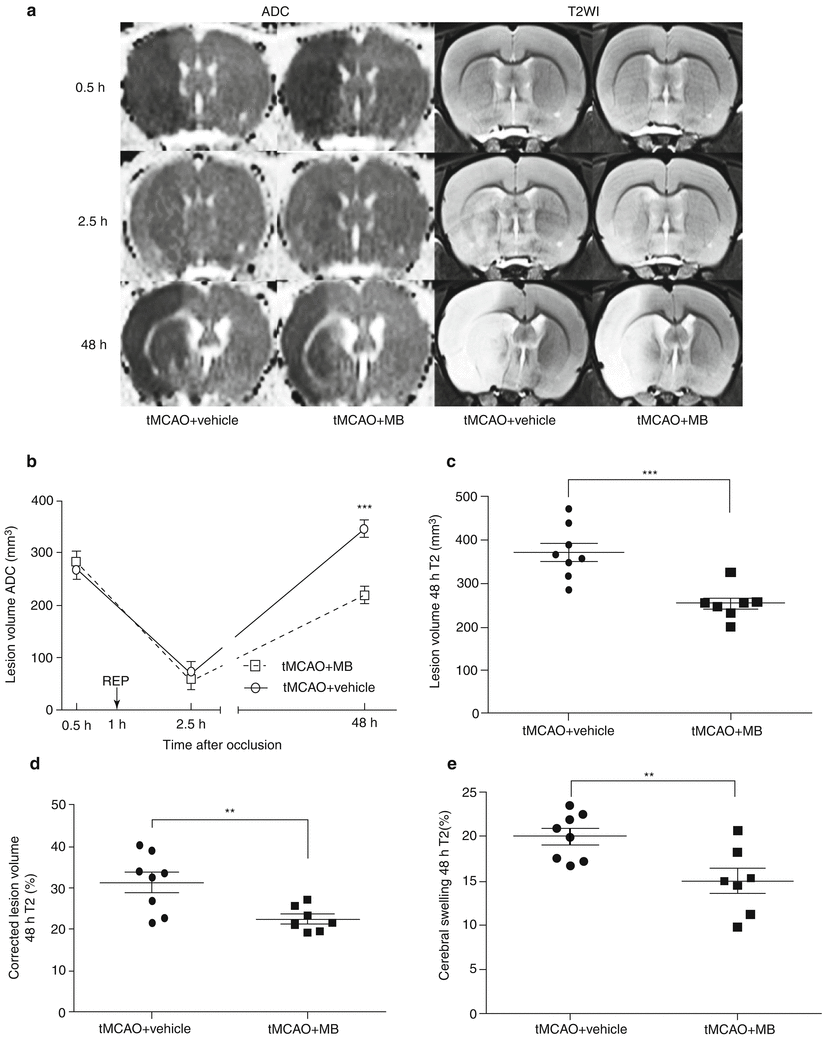
Fig. 2
(a) Representative ADC, T2WI images at 0.5, 2.5 and 48 h after tMCAO from vehicle-treated and MB-treated rats. (b) Temporal evolution of apparent diffusion coefficient (ADC)-defined ischemic lesion volumes in vehicle (circles) and MB groups. Arrow indicates reperfusion (REP). (c) Quantitative analysis of T2WI-defined lesion volume in vehicle and MB-treated groups at 48 h after stroke. (d) Quantitative analysis of corrected T2WI lesion volume in vehicle and MB-treated groups at 48 h after stroke. (e) Quantitative analysis of cerebral swelling estimated in T2WI at 48 h after stroke. Values are the mean ± SEM.,**p < 0.01 vs. vehicle; ***p < 0.001 vs. vehicle
T2WI failed to detect lesions in both groups at 0.5 and 2.5 h after tMCAO (Fig. 2a). At 48 h after stroke, T2WI lesion volume was 372.45 ± 21.15 and 254.56 ± 14.30 mm3 in vehicle and MB groups, respectively (p < 0.001, Fig. 2a, c). MB treatment significantly decreased ischemic brain swelling as compared with vehicle treatment, which was 20.03 ± 0.93 and 14.95 ± 1.43 % in vehicle and MB group, respectively (p < 0.01, Fig. 2e). The corrected T2WI lesion volume was 31.42 ± 2.46 and 22.51 ± 1.16 % in vehicle and MB group, respectively (p < 0.01, Fig. 2d).
Consistently, neuropathological analysis demonstrated that MB decreased the final infarct lesion volume induced by transient focal cerebral ischemia. At 48 h after tMCAO, the TTC-staining defined infarct lesion volume was 36.90 ± 1.49 and 30.52 ± 2.06 % in vehicle and MB groups, respectively (Fig. 3a, b, p < 0.05). In addition, MB treatment significantly ameliorated ischemic brain swelling, which was 14.39 ± 1.50 and 9.54 ± 1.38 % in the vehicle and MB groups, respectively (p < 0.05) (Fig. 3c).
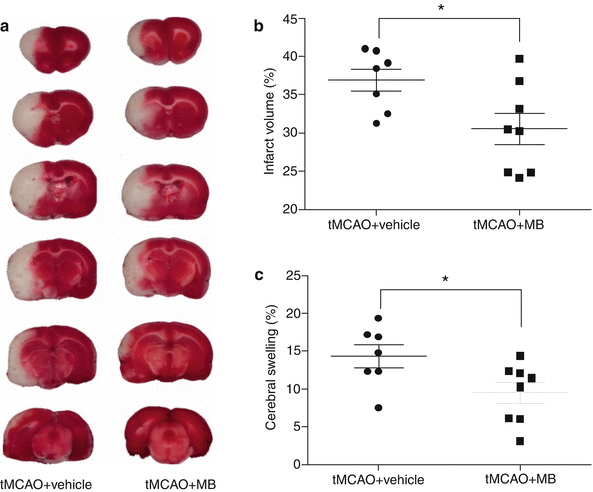
Fig. 3
(a) Representative TTC staining of brain sections in vehicle- and MB-treated rats at 48 h following the tMCAO. (b) Quantitative analysis of TTC-defined lesion volume in vehicle and MB groups. (c) Quantitative analysis of brain swelling in vehicle and MB groups. Values are the mean ± SEM.*p < 0.05 vs. vehicle
Acute Treatment of MB Attenuated Edema of Neurovascular Unit Component
We determined the effect of MB on edema in neurovascular components induced by transient focal cerebral ischemia using TEM. The cortical capillary of sham-operated rats have normal endothelial cells, basal lamina, and astrocyte foot processes (Fig. 4a, b). In the vehicle-treated stroke rat brains, swollen astrocyte foot processes were observed in the penumbra regions at 2.5 h after stroke (Fig. 4c). The enlargement of astrocyte foot process was even more severe at 48 h after stroke, accompanied by detachment of astrocyte foot processes, plasma membrane from the basal lamina and endothelial cell swelling were observed (Fig. 4d). In the MB-treated rats, very mild edema was found at the astrocyte foot processes at 2.5 h after stroke (Fig. 4e). At 48 h after stroke, less edema was observed at the astrocyte foot process in MB-treated rats compared with vehicle-treated animals (Fig. 4f).
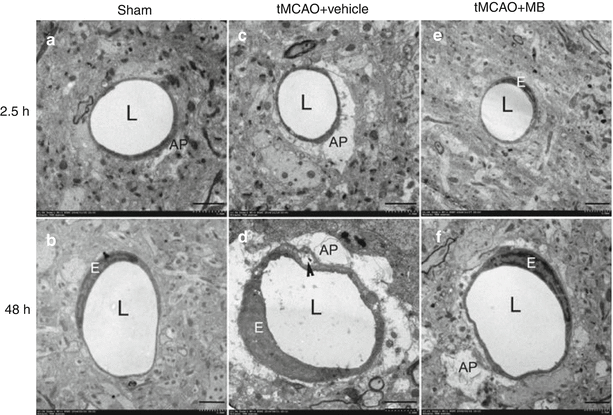
Fig. 4
Representative electron microscopy images of cortical vessels in the ischemic penumbra at 2.5 or 48 h after tMCAO. (a, b) cortical capillary in a sham-operated rat. The lumen (L) is circular, the endothelial cells nucleus is crescent shaped, and the cytoplasmic rim is thin and compact. Perivascular astrocytic foot processes (AP) are relatively flat and difficult to delineate. (c) Cortical capillary with highly swollen perivascular astrocytic foot processes in a vehicle-treated rat at 2.5 h after stroke. (d) In the penumbra of a vehicle-treated rat at 48 h after stroke, cortical capillary lumen became irregular, and astrocyte foot processes were seriously enlarged. The cytoplasm of the endothelial cell is expanded. Detachment of the foot process plasma membrane from the basal lamina was observed (arrowhead). (e) In the penumbra of a MB-treated rat at 2.5 h after stroke, cortical capillary with normal endothelial cells, basal lamina, and astrocyte foot processes. (f) In the penumbra of a MB-treated rat at 48 h after stroke, cortical capillary with mild enlargement of perivascular spaces. L lumen, AP astrocytic foot process, E endothelial cell. Bar = 2 μm
In the cortex of sham-operated rats, neurons have well-defined nuclei with prominent nucleoli (Fig. 5a, b). In the vehicle-treated stroke rats, TEM at 2.5 h after stroke demonstrated that most neurons at the penumbra were shrunken, accompanied with a lack of perikaryal cytoplasm and triangular nuclei, surrounded by swollen vacuoles and astrocytic processes (Fig. 5c). At 48 h after stroke, necrotic neurons show cytoplasmic and nuclear disintegration with marked chromatin clumping and discontinuous cellular membranes (Fig. 5d). In the MB-treated rats, the neuron damage was remarkably alleviated with only mild nuclei deformation observed at the penumbra region at 48 h after stroke (Fig. 5e, f).
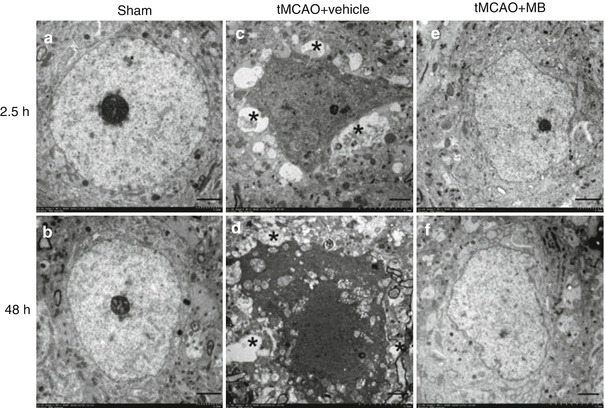
Fig. 5
 Mediators of Remote Ischemic Conditioning: Important Role of eNOS/NO/Nitrite
(Danio rerio) Developed as an Alternative Animal Model for Focal Ischemic Stroke
Volume Determination in Subarachnoid Hemorrhage Using Rats
Role of Matricellular Proteins in Brain Edema after Subarachnoid Hemorrhage
Effect of Gender on Acute Hydrocephalus after Experimental Subarachnoid Hemorrhage
-4, and the mTOR Pathway Following Germinal Matrix Hemorrhage
Mediators of Remote Ischemic Conditioning: Important Role of eNOS/NO/Nitrite
(Danio rerio) Developed as an Alternative Animal Model for Focal Ischemic Stroke
Volume Determination in Subarachnoid Hemorrhage Using Rats
Role of Matricellular Proteins in Brain Edema after Subarachnoid Hemorrhage
Effect of Gender on Acute Hydrocephalus after Experimental Subarachnoid Hemorrhage
-4, and the mTOR Pathway Following Germinal Matrix Hemorrhage


Representative electron microscopy images of neurons in the ischemic penumbra at 2.5 or 48 h after the ischemic stroke. (a, b) Normal neuron with a large circular nucleus containing a dark nucleolus and a 1–2-μm-thick rim of perikaryal cytoplasm. (c) In a vehicle-treated rat at 2.5 h after stroke, shrunken neurons with condensed nuclei and cytoplasm are surrounded by a ring of swollen astrocytic processes (marked by asterisks). (d) In a vehicle-treated rat at 2.5 h after stroke, necrotic neurons show cytoplasmic and nuclear disintegration with marked chromatin clumping and discontinuous cellular membranes. (e, f) In MB-treated rats at 2.5 or 48 h after stroke, neuron with mild nuclei deformation. Bar = 2 μm
Related posts:
Mediators of Remote Ischemic Conditioning: Important Role of eNOS/NO/Nitrite
(Danio rerio) Developed as an Alternative Animal Model for Focal Ischemic Stroke
Volume Determination in Subarachnoid Hemorrhage Using Rats
Role of Matricellular Proteins in Brain Edema after Subarachnoid Hemorrhage
Effect of Gender on Acute Hydrocephalus after Experimental Subarachnoid Hemorrhage
-4, and the mTOR Pathway Following Germinal Matrix Hemorrhage
Stay updated, free articles. Join our Telegram channel
Full access? Get Clinical Tree
