Fig. 13.1
2D [1H,1H] HRMAS spectra from controls (left) and GBM (right) tumor biopsies, acquired with a 600 MHz (1H) NMR spectrometer at an MAS rate of 3 kHz and at −8 °C. Assigned: Alanine (Ala), γ-amino-butyric acid (GABA), Choline (Cho), Glutamine (Gln), Glutamate (Glu), Glycerophosphocholine (GPC), Lipids (Lip), Myoinositol (Myo), Phosphocholine (PC), Phosphorylethanolamine (PE), N-acetyl-aspartate (NAA), and Taurine (Tau)
The microscale genome array studies were performed with the commercially available Affymetrix U133Plus® array (Santa Clara, CA). Total experimental RNA were isolated using the modified protocol of the RNeasy purification kit (Qiagen). The Ribo-SPIA protocol (www.nugeninc.com) was used for mRNA labeling and amplification. We used 20 ng total RNA for first strand cDNA synthesis, and the entire procedure for amplification, fragmentation and labeling was performed in 1 day. Normalization and analysis of the expression values was performed using both dChip (http://biosun1.harvard.edu/complab/dchip/) and GC-RMA. Comparison of the expression profiles between tumor biopsies and control tissue microarrays was performed using significant analysis of microarrays (SAMs) (http://www-stat.stanford.edu/~tibs/SAM/) to obtain a list of differentially expressed genes with a false discovery rate (q-value) <0.05 and to properly take into account the substantial multiple comparison problem.
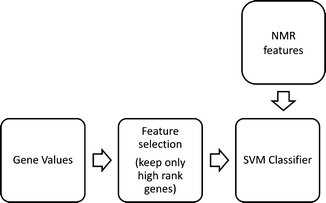
The architecture of our classification system is shown in Fig. 13.2. We first performed a feature selection process by which the high dimensionality of the feature space (consisting of 54,675 genes) was reduced by selecting only the most relevant genes for the classification task. Then, a Support vector machine (SVM) classifier was constructed to these reduced feature vectors in order to optimally partition the space according to class. Finally, the constructed reduced feature space from the gene expression values was combined with the NMR features in order to examine their impact on the classifier.


Fig. 13.2
Classification system architecture
Feature selection methods typically rank genes according to their differential expressions among phenotypes and pick the top-ranked genes. There are two general schemes for feature selection: filters and wrappers (Inza et al. 2004). We used the minimum redundancy – maximum relevance (MRMR) method (Hanchuan et al. 2005), because it is a powerful framework for selecting features that capture class characteristics in a broad spectrum by reducing mutual redundancy within the feature set. Thus, it offers greater robustness and generalization properties to the reducing feature space of samples which can significantly improve classification accuracy.
Support vector machine (SVM) is a very powerful classification method that draws hyperplanes in the feature vector space by maximizing the margin between data samples of different classes. SMV is built upon the use of kernels to construct nonlinear decision boundaries. Here, we used linear kernels and the LIBSVM environment for multi-class SVMs (Hsu and Lin 2002). It should be noted that during all experiments with the SVM, we adopted the standard leave-one-out training/testing scheme. That is, one element of the data was used as a training set, and the left-out element was used for testing the predictive performance of the resulting classifier. The SVM soft-margin constant C was set to 10, chosen based on the results of a few runs on one training set. The results indicated that the value of this parameter was not crucial for our experimental dataset.
Two classification problems were studied: Problem (I) distinguish between normal and tumor classes. All 46 samples of the three tumor categories belonged to the same parent-class, tumor (two-class problem); Problem (II) study the different tumor categories (H, L and M) and subtypes i.e., GBM, AA, meningioma etc. Experiments were designed for the 55−9 = 46 samples in an attempt to distinguish among the different types of tumor (multiple-class problem).
Results
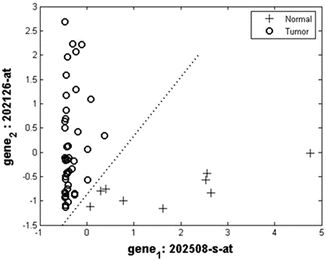
Problem I: In the two-class problem, the performance of the SVM classifier using gene values was perfect. In particular, we obtained 100 % accuracy using only the first two features (genes 202126-at and 202508-s-at) that were selected by the MRMR feature selection method (Fig. 13.3). Their discriminative ability was highy significant as they established a feature space, which could be easily divided into normal and tumor sub-regions. Adding more genes improved further the discriminate between tumor (either high grade or low grade) and metastasis. Among them, gene 1552797_s_at is relevant to a stem cell marker for malignant brain tumors.


Fig. 13.3
Two genes give 100 % accuracy in normal versus tumor classification
Problem II (tumor type and subtype classification): As expected, this classification scheme was more difficult. The classifier had near excellent behavior using the first 9–25 features selected by the MRMR method. Using the first 15 genes, the classifier reached 100 % best accuracy. Specifically, after adding gene 209771_x_at to the feature vectors, the classification performance was 80.4 %; adding gene 229851_s_at increased the performance to 91.3 %; adding gene 225491_at increased it to 95.6 %; adding genes 211991_s_at, 1552797_s_at, 224209_s_at, 206349_at, 204131_s_at and 241938_at increased it to 97.8 %. Finally, the addition of gene 204501_at increased the classification performance to 100 % for anaplastic astrocytoma and menignioma. We also tested the impact of combining selected NMR features (isolated or combined) with the gene values. Using all 15 NMR features and selected genes (obtained from the MRMR genes selection method) increased the classification performance from 95.6 % to 97.8 % for the high grade typing (11 genes and 15 NMR features), from 95.6 % to 100 % for schwanoma subtyping (1 gene 209169_at and 15 NMR features) and from 95.6 % to 97.8 % for metastasis subtyping (12 genes and 15 NMR features).
Using logistic regression we have also investigated how the 15 metabolite values from HRMAS MRS data, the 15 best genes, or their combination predict survival using 49 available binary clinical outcomes (33 survived vs. 16 deceased). We found that gene data alone result to excellent predictivity sensitivity 94 %, specificity 97 %, and accuracy 96 %. HRMAS MRS data had inferior performance with sensitivity 69 %, specificity 85 % and accuracy 80 %. However the combination of genomics and HRMAS MRS data achieved a perfect 100 % classification for all indices. Due to our small sample size we consider these promising results not as a definite proof of the strength of the fusion approach of MRS and genomics but rather as an positive indication of its potential.
Discussion
Previous studies applied MRS succesfuly to answer important clinically question related with treatment response and survival of patients with CNS tumors. Similarly, gene profiling studies have shown greater accuracy than histology in outcome and survival prediction. Here we introduced a novel approach that combines MRS and molecular genomic biomarkers in order to develop a useful tool that allows accurate tumor fingerprinting. This would facilitate diagnosis and treatment course decisions, but also it would enhance our understanding the underlying biological processes, an important step for novel drug development. Our approach demonstrated the potential of HRMAS and its combination with gene expression profiles to offer better tumor classification and survival prediction than each methodology alone.
Stay updated, free articles. Join our Telegram channel

Full access? Get Clinical Tree


