Age
≥75 = 1
<75 = 0
NIHSS
≥18 = 1
<18 = 0
Admission glucose
≥150 mg/dl = 1
<150 mg/dl = 0
Calculating these clinical scores can help predict the outcome and possible risks vs. benefit of endovascular therapy in acute stroke patients.
Neuroimaging
Neuroimaging techniques can help identify vascular anatomy of the acute stroke patient, location of vascular occlusion, and potentially salvageable tissue. The most commonly used techniques include computerized tomography (CT) of the head without contrast, CTA/CTP, MRI/MRA, and magnetic resonance (MR) perfusion.
Identification of the penumbral tissue remains the “Holy Grail” of acute stroke imaging. Astrup et al. proposed the initial concept of penumbra in 1981 [17]. Penumbral tissue is described as the ischemic hypoperfused area surrounding the core infarct zone that is at risk of irreversible damage. As proposed by Hakim, penumbra is an ischemic tissue that is potentially reversible with timely intervention [18]. Cerebral blood flow (CBF) levels between 10–15 mL/100 g/min and 25 mL/100 g/min are likely to identify the penumbral tissue [19].
The rationale behind acute stroke therapy is to reduce infarct size by reperfusing the ischemic penumbral tissue, thereby improving patient outcomes. Initial brain perfusion studies have been done with the PET by mapping CMRO2 and OEF and with use of ligands that preferentially binds to the penumbral tissue [20–23]. But PET scanners are not used for emergent clinical triage due to their limited availability and the time required for studies to be performed. Other modalities relied upon in clinical practice are described below. Perfusion imaging provides physiologic information about the penumbral tissue at a given time. However, it is important to remember the dynamic physiological changes that occur between the time of perfusion imaging acquisition and actual stroke intervention.
Non-contrast CT
Acute stroke imaging begins with a non-contrast computed tomography (NCCT) scan [24, 25]. This imaging modality has become the first-line diagnostic test because of its acquisition speed, widespread availability, accuracy, and cost-effectiveness. In the acute setting, it not only accurately excludes subarachnoid and intracranial hemorrhage but also detects subacute infarct and occasionally identifies other conditions that may mimic acute cerebral ischemia. These findings play a very important role in selecting therapeutic options as well as predicting outcomes. The advent of multi-detector technology has considerably cut down the CT image acquisition time to 1–2 min and produces a better quality image with superior tissue differentiation [26]. The NCCT imaging is based on X-ray beam attenuation values that are expressed in Hounsfield units (HU). Substances denser than water have higher HU and are gray to white in appearance on NCCT, whereas lower density substances have negative HU value and appear dark on the scans. The physiological derangement causing edema (cytotoxic and vasogenic) in ischemic brain tissue is represented as hypodense areas on NCCT [27–29]. When an area is noted as hypodense on NCCT, the probability of it being infarcted is nearly 97 % [30]. As per current guidelines, any patient with stroke-like symptoms who is eligible for IV t-PA should have a NCCT done within 25 min of arrival to the hospital with results to be interpreted within 45 min of arrival [31]. The usual findings of early acute stroke on NCCT are hyperdense artery signs, loss of gray-white matter differentiation, loss of insular ribbon, compression of ventricles, and sulcal effacement. The occlusion of major vessels is sometimes seen as hyperdense artery signs, e.g., hyperdense MCA sign or MCA dot sign. Usually, a hyperdense MCA sign is seen in proximal segments, whereas the dot sign is seen in the distal segments of MCA [32]. These signs usually disappear within a few days after recanalization and resolution of the thrombus [33]. The hyperdense MCA sign is a sensitive indicator of thrombus as is seen in nearly one-half of all cases of angiographically proven larger artery thrombosis [34].
The sensitivity of NCCT in the setting of acute stroke depends on many factors including the time of the scan, the area of infarct, technical specifications of scanner, the viewing methodology, and expertise of the interpreters. The studies have shown that stroke recognition rates are nearly 67 % if the scan is done within 3 h of symptom onset [35, 36]. In a post-hoc analysis of the National Institute of Neurological Disorders and Stroke rt-PA Stroke Study, NCCT had a 31 % sensitivity in detecting early signs of stroke that increased to 82 % at 6 h [37]. There is some evidence indicating patients showing extensive parenchymal hypodensity or involvement of more than one-third of the MCA territory on NCCT should be excluded from treatment with IV rt-PA due to dismal outcomes [24].
The Alberta Stroke Program Early CT Score (ASPECTS) was designed to standardize the detection and reporting of the extent of ischemic hypodensity on NCCT. It is an effective clinical tool that is practical, reliable, and reproducible. ASPECTS is a topographic scoring system that divides the MCA territory into ten segments on two NCCT axial cuts, including: caudate, insula, lenticular nucleus, internal capsule, and M1–M6 cortical regions. The score is obtained by subtracting a point for apparent ischemia in each area from the total score of 10. A score of 0 represents completely infarcted area and a score of 10 indicates normal MCA territory respectively. The patients with ASPECT score of 8–10 have shown less infarct burden and better clinical outcomes [32]. The limitations with ASPECTS application are presence of preexisting white matter disease and interobserver variability [38].
CT Angiography
CT angiography (CTA) is performed through the intravenous administration of a rapid bolus of contrast. Helical CT scan images are acquired to visualize the intracranial and extracranial vasculature. These raw CT images can be reconstructed into three-dimensional images of the circle of Willis and extracranial cerebral arteries. This provides a noninvasive method for rapid evaluation of the cerebral vasculature and can be performed within minutes after NCCT head. Direct visualization of cerebral vasculature provides information about the site of vessel occlusion, vessel tortuosity, and clot size. This information is valuable in planning interventional therapy and achieving recanalization. CTA has sensitivities of about 92–100 % and specificities of 82–100 % for the detection of intracranial large vessel stenosis and occlusion [39]. Clot size exceeding 8 mm in length is associated with poor response to IV t-PA [40]. CTA images also provide visualization of collateral flow to the occluded vessel that can be a marker of penumbral tissue and possibly good outcomes [41]. CTA images are more sensitive than NCCT in visualizing areas of hypoattenuation and correlate well to final MRI DWI images for assessing infracted tissue [42].
CT Perfusion
CT perfusion imaging is widely used for identification of penumbra in acute stroke patients. The images are acquired on ultrafast CT scan by repetitive scanning of a defined area after injection of intravenous contrast. Semiquantitative CBV, CBF, and MTT maps can be generated from the arterial and tissue enhancement curves after administration of bolus of iodinated contrast. Ischemic penumbra is generally defined as areas with reduced CBF and elevated MTT with CBV values above threshold for ischemia [43, 44]. In comparison with MRI perfusion, widespread availability of CT perfusion makes it the more commonly used imaging modality to identify penumbra in acute stroke patients. Perfusion CT color maps can lead to fourfold increase in stroke diagnosis when compared to non-contrast CT alone [45].
Magnetic Resonance Imaging
The magnetic resonance imaging (MRI) is regarded as a most accurate tool in detecting cerebral infarction. The MRI demonstrates high rates of sensitivity and specificity in the diagnosis of acute ischemia [46, 47]. An American Academy of Neurology position statement states that MRI is more diagnostic than NCCT in the first 12 h of acute stroke and also plays a very important role in predicting the clinical prognosis [48]. During acute cerebral ischemia, there is disruption of energy metabolism, leading to failure of the Na+/K+ ATP pump which leads to loss of ionic gradient and net influx of water from extracellular to intracellular environment causing restricted diffusion of water molecules. These areas are readily identified as hyperintense lesions on DWI sequences of MRI. The lesions are correlated with apparent diffusion coefficient (ADC) sequences that demonstrate restricted diffusion as hypointense lesion [49–52].
Treatment outcomes are closely related to the volume of infarct on DWI imaging [53]. Studies have shown that there is nearly a sixfold increase in the risk of ICH when the infarct core volume exceeds 100 ml [54]. The existence of DWI lesion reversal still remains controversial. In a recent study, Labeyrie et al. demonstrated sizeable DWI reversal in patients who had undergone thrombolysis within ≤4.5 h of symptom onset [55]. In a post-hoc analysis of the EPITHET trial, only 6.4 % of patients demonstrated true DWI reversal [56]. DWI hyperintensity is also seen in other conditions like abscesses, aggressive viral infections (e.g., ADEM), and certain tumors.
MR Perfusion
MR perfusion or MR perfusion-weighted imaging is a technique in which the first pass of a bolus of gadolinium-based contrast agent through brain tissue is monitored by a series of T2-weighted MR images. The susceptibility effect of paramagnetic agents like gadolinium leads to a signal loss in the time-to-signal intensity curve. Parametric maps of cerebral blood volume (CBV) and flow (CBF) can be derived from the concentration–time curve using this signal information.
It is generally believed that the DWI lesion reflects core infarct while PWI shows the area of hypoperfused ischemic tissue. Therefore, the combined use of PWI with DWI can visually help identify the penumbral area at risk by measuring volume difference referred to as “PWI-DWI mismatch.”
Studies have shown some benefits of using the MRI diffusion–perfusion imaging-based mismatch for identifying patients for IV thrombolytic [57, 58]. Early changes suggestive of ischemic stroke can be noted on the DWI and ADC images within a few minutes of stroke onset. Stroke patients have been shown to have favorable outcome rate for patient treated with IV t-PA when selected with based on imaging with DWI-PWI mismatch vs. non-contrast CT scan [59, 60].
In DEFUSE trial, patients who were treated with IV t-PA within 3–6-h window were also screened with DWI-PWI imaging. Perfusion abnormality was defined as T max delay of >2 s and greater than 20 % mismatch of PWI-DWI lesion. In DWI-PWI mismatch group, early reperfusion was associated with favorable outcome in 56 %, while only a 19 % favorable outcome was achieved when reperfusion was not achieved. In the group with no DWI-PWI mismatch, lack of early reperfusion was associated with a more favorable outcome [57].
Another randomized trial, EPITHET, intravenous t-PA in the 3–6-h window along with MRI imaging, was used to assess for infarct growth at 90 days. Perfusion abnormalities were defined as T max delay of >2 s and greater than 20 % mismatch of PWI-DWI lesion, similar to DEFUSE trial. 56 % of t-PA patients were noted to have >90 % reperfusion of initial PWI lesion, as compared to 26 % in the placebo group [60].
Pooled analysis of DEFUSE and EPITHET trials showed that patient who had mismatch and had successful reperfusion had better 90-day outcomes compared with unsuccessful reperfusion (OR = 5.6). Reperfusion did not improve favorable outcomes in non-mismatch patients [61].
Based on these trials, patients that have MR perfusion imaging with T max delay of >2 s and greater than 20 % mismatch of PWI-DWI lesion might benefit from revascularization therapies.
When considering triaging patients using advanced neuroimaging, the potential benefits must be weighed against the time required to perform the test. While this loss of time may be justified in patients nearing the end or outside of the commonly accepted therapeutic time window, it may not be justified in patients presenting early in the course.
Transcranial Doppler
The role of Transcranial Dopplers (TCDs) in acute stroke therapy is debatable. Some studies have shown some benefits in using TCD in conjunction with intravenous t-PA therapy [62]. It is a quick, bedside, noninvasive imaging modality to assess blood flow in major intracranial vessels. It is useful in detecting cerebral flow velocity, direction of flow, collateral supply, flow obstruction, and degree of vasospasm. The major vessels that are visualized are MCA, ACA, carotid siphon, vertebral artery, basilar artery, and ophthalmic artery [63, 64]. TCDs are more sensitive and specific in detecting stenosis in anterior circulation when compared to posterior circulation [65]. It also detects microemboli in patients with certain underlying conditions (e.g., carotid artery disease, atrial fibrillation, patients with cardio-embolic source of thrombus) in the form of transient high-intensity signal [66]. The most important use of TCD is monitoring for development of vasospasm in subarachnoid hemorrhages. The parameters which indicate vasospasm are flow velocities more than 200 cm/s, elevated Lindegaard ratios, and a rapid increase in flow velocities [67–69]. TCD’s findings do however depend on bony windows, vessel anatomy, and operator/interpreter.
Assessment of Collaterals
As mentioned, CT or MRI techniques provide us with important information regarding the status of collateral blood flow to the ischemic area. Collaterals can provide flow to the ischemic or penumbral areas when the primary source of arterial inflow is blocked. The presence or absence of collaterals can be critical in predicting patient outcomes and aid in selecting patient that will benefit from endovascular recanalization [70]. The presence of collaterals is shown to be one of the most important predictors of clinical outcome and arterial recanalization [71].
The American Society of Interventional and Therapeutic Neuroradiology/Society of Interventional Radiology (ASITN/SIR) scale (Table 6.2) quantifies and characterizes collaterals on angiography with description of collateral filling, arterial flow, and venous phase of the ischemic territory [72]. Interestingly, beneficial effects were not observed in patients with poor collaterals even when revascularization was achieved [73].
Table 6.2
The ASITN/SIR Collateral Flow Grading System for determining angiographic collateral grade on pretreatment angiography
ASITN/SIR collateral grade | Definition |
|---|---|
0 | No collaterals visible to ischemic site |
1 | Slow collaterals to the periphery of ischemic site, with persistence of some of the defect |
2 | Rapid collaterals to the periphery of ischemic site, with persistence of some of the defect, and to only a portion of the ischemic territory |
3 | Collaterals with slow but complete angiographic blood flow of the ischemic bed by the late venous phase |
4 | Complete and rapid collateral blood flow to the vascular bed in the entire ischemic territory by retrograde perfusion |
Summary
Acute revascularization therapies for acute stroke hold the promise of improving patient outcomes. However, patient selection remains a challenge to the successful implementation of these therapies. We still are unclear as to which patients are most likely to benefit from this treatment approach. A combination of clinical and imaging-based selection is currently the best strategy to maximize benefit by combining baseline characteristics with a dynamic physiological assessment of penumbra.
Case Vignettes
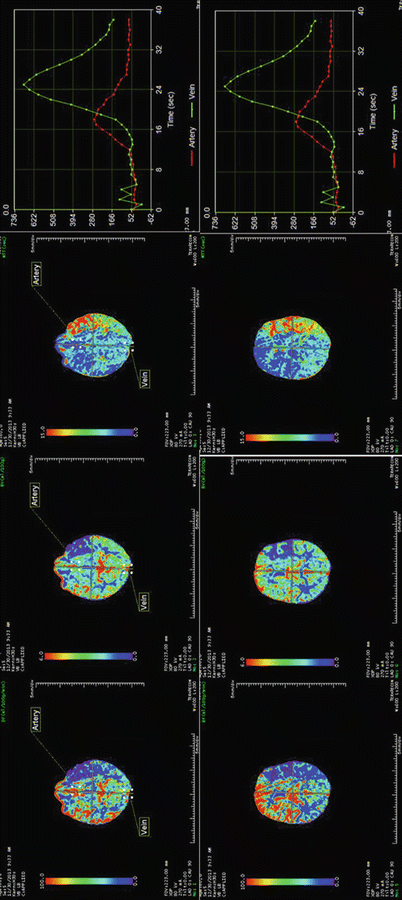
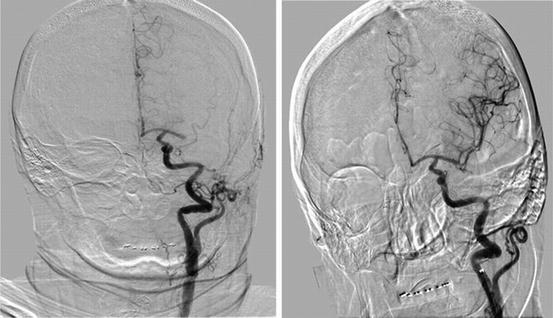
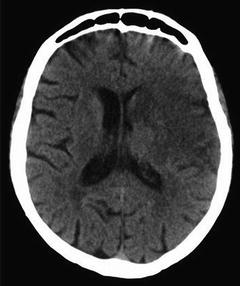
Illustrative Case 1: A 79-year-old, right-handed Caucasian female with past medical history of HTN, HLD, and paroxysmal atrial fibrillation presents with sudden onset of right-sided weakness and speech difficulty 4 h ago. A CT perfusion study was performed to delineate the ischemic penumbra (Fig. 6.1). A large region of salvageable tissue was identified, and the patient was taken to the angiography suite where a right middle cerebral artery occlusion was found (Fig. 6.2a) and successfully recanalized with the aid of a Solitaire stent retriever (Fig. 6.2b) (Covidien, Irvine, CA). A post-procedural repeat NCCT shows only the core infarct (Fig. 6.3).


Fig. 6.1
A large left hemispheric MCA territory stroke with large frontal core infarct and a moderate frontoparietal penumbra (perfusion mismatch) with increased mean transit time and decreased blood flow. These images show both the area of core infarct and area of mismatch suggestive of penumbra in posterior division of the MCA territory

Fig. 6.2
Acute thrombus in the proximal left MCA with no flow to either the superior or inferior division before intervention (a), with restoration of TICI 2B flow post-thrombectomy with the Solitaire device

Fig. 6.3
CT head 2 days later shows hypodensity in the left frontoparietal region which correlates with the area of core infarct on CT perfusion images, while the posterior division with mismatch on CT perfusion was salvaged with mechanical intervention
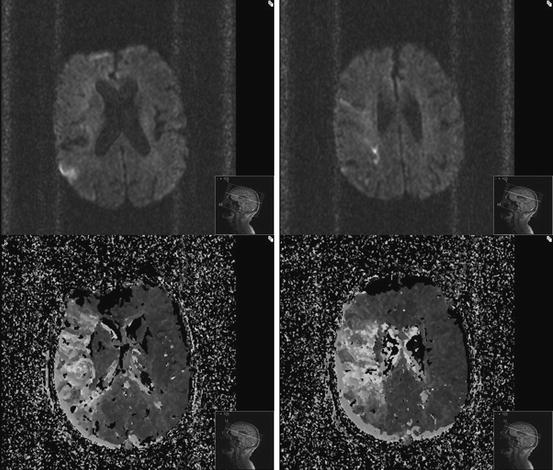
Illustrative Case 2: A 74-year-old, right-handed man woke up with moderate dysarthria, left hemianopsia, left facial paresis, and sensory loss. He arrived in the emergency department 9 h into his stroke symptom onset with NIHSS score of 8. MRI diffusion imaging showed only small punctate areas of restricted diffusion in the RMCA territory (Fig. 6.4a), while perfusion-weighted imaging showed a large region at risk (Fig. 6.4b). MR angiography showed a distal M1 occlusion (Fig. 6.5). The patient was taken for mechanical thrombectomy with the MERCI clot retriever and achieved complete restoration of flow (Fig. 6.6). Follow-up NCCT showed no large territorial infarction (Fig. 6.7).


