Using the Advantage Workstation (GE Healthcare), the same slices of cervical 3D-MRI using 3.0 Tesla (T) Signa system and 18F-FDG PET images were fused automatically. On fusion images, the maximal count at the lesion was adopted as the standardized uptake value (SUVmax). The SUV ratio, similar to SIR, (SUVR) was also calculated.
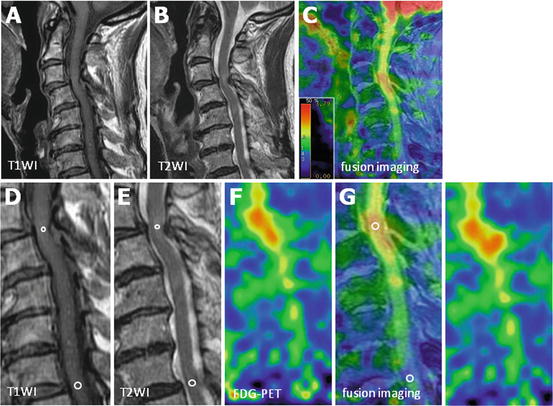
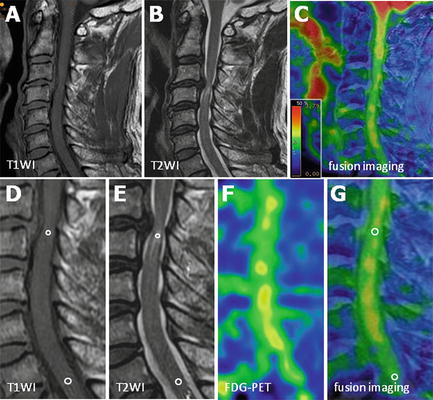
Examples are shown in Figs. 29.1 and 29.2. Figure 29.1 shows a significant increase in 18F-FDG uptake (SUVmax =2.50, SUVR = 1.84) at the level of the lesion (SIR on T1-WI = 1.29, SIR on T2-WI = 1.55). The neurological improvement rate was considered good (75.0 %) at follow-up. On the other hand, Fig. 29.2 demonstrates the no increase in 18F-FDG uptake (SUVmax =1.60, SUVR = 0.87) at the level of the lesion (SIR on T1-WI = 0.99, SIR on T2-WI = 1.48). The neurological improvement rate at follow-up was poor (28.6 %).


Fig. 29.1
An 80-year-old woman with cervical spondylotic myelopathy was treated surgically and showed a neurological improvement rate of 75.0 % at follow-up. (a) Midsagittal T1-weighted MRI, (b) midsagittal T2-weighted MRI, (c) MRI/PET fusion imaging (d, e ), (f) 18F-FDG PET sagittal image, and (g) MRI/PET fusion sagittal slice demonstrate a focal increase in 18F-FDG uptake at the level of increased signal intensity lesion (Reprinted, with permission, from [29])

Fig. 29.2
A 62-year-old man with cervical spondylotic myelopathy was treated surgically and showed a poor neurological improvement rate of 28.6 % at follow-up. (a) Midsagittal T1-weighted MRI, (b) midsagittal T2-weighted MRI, (c) MRI/PET fusion imaging (d, e), (f) 18F-FDG PET sagittal image, and (g) MRI/PET fusion sagittal slice demonstrate inconspicuous 18F-FDG uptake at the level of lesion with increased signal intensity (Reprinted, with permission, from [29])
29.1.2 Relationship Between Signal Intensity Ratio on MRI and Clinical Outcome
The SIR on T1-WIs correlated significantly with preoperative JOA score (R = 0.430; p < 0.05) and postoperative neurological improvement (R = 0.617; p < 0.01). However, there were no correlation between high change in intramedullary signal intensity on T2-WIs and preoperative JOA score (R = 0.174) or postoperative neurological improvement (R = 0.256).
29.1.3 Clinical Significance of SUVmax for Lesions with Increased Signal Intensity
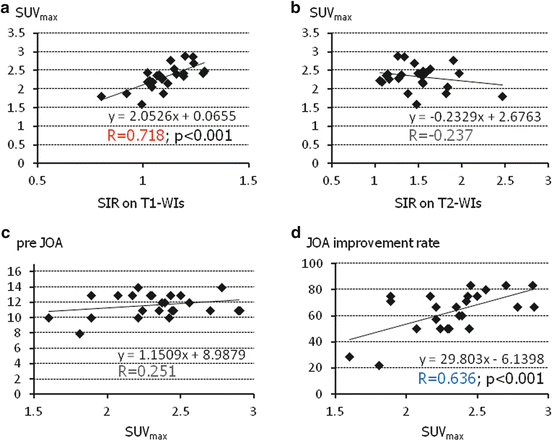
Figure 29.3 shows the relationship between SUVmax for lesions with increased signal intensity on the sagittal plane and SIR on T1-WIs and T2-WIs as well as neurological scores. SUVmax for such lesions correlated significantly with SIR on T1-WIs (R = 0.718; p < 0.001, Fig. 29.3a) but not on T2-WIs (R = 0.237, Fig. 29.3b). Furthermore, SUVmax correlated with postoperative neurological improvement (R = 0.636; p < 0.001, Fig. 29.3d) but not with preoperative JOA score (R = 0.251, Fig. 29.3c).


Fig. 29.3
Relationship between SUV measured at the lesion with increased signal intensity on MRI/PET fusion image and signal intensity ratio (SIR) and neurological scores. SUVmax at the sagittal lesion with increased cord intensity correlated strongly with the SIR on T1-WIs (a) but not on T2-WIs (b). SUVmax did not correlate with preoperative JOA score (c), but correlated with postoperative neurological improvement (d) (Reprinted, with permission, from [29])
29.1.4 Clinical Significance of the SUV Ratio
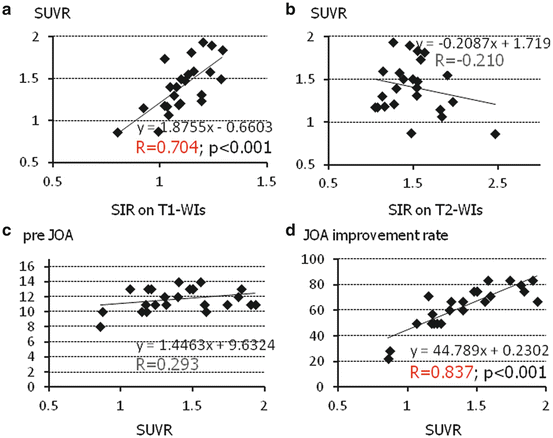
Figure 29.4 shows the relationship between SUVR and SIR on T1-WIs and T2-WIs as well as neurological score. SUVR correlated significantly with SIR on T1-WIs (R = 0.704; p < 0.001, Fig. 29.4a) but not on T2-WIs (R = 0.210, Fig. 29.4b). Furthermore, SUVmax correlated significantly with postoperative neurological improvement, and the correlation coefficient was much higher than that of SUVmax for lesions with increased signal intensity on the sagittal plane (R = 0.837; p < 0.001, Fig. 29.4d), but not with preoperative JOA score (R = 0.293, Fig. 29.4c).


Fig. 29.4
Relationship between SUV ratio (SUVR) on MRI/PET fusion image and signal intensity ratio (SIR) and neurological scores. SUVR correlated strongly with SIR on T1-WIs (a) but not on T2-WIs (b). SUVR did not correlate with preoperative JOA score (c), but correlated with postoperative neurological improvement (d) (Reprinted, with permission, from [29])
29.2 Discussion
Elucidation of the factors that contribute to prognosis of patients with CSM and OPLL has been investigated by several groups [5, 12–15]. It is important to know those factors that determine neurological improvement after surgery. Age at surgery [16], duration of neurological symptoms [5, 13, 14, 16–18], and existence of signal changes on preoperative MRI [2–4, 19, 20] have been considered key predictors of surgical outcome. These factors could also have a significant impact on the surgical outcome of the patients in the present study as well, although we focused herein on the signal intensity changes on MRI and local glucose metabolism at the affected mono-segmental spinal cord lesion on PET using high-resolution MRI/PET fusion imaging.
While the MRI provides the highest specificity in the assessment of morphological changes and intramedullary state of the spinal cord, it is almost impossible to estimate the potential recovery of the spinal cord on preoperative MRI without quantitative analysis. Furthermore, the signal intensity on the MRI is irregular in each scan because different sequence parameters are set for each individual patient. On the other hand, 18F-FDG PEt allows visualization of the metabolic activity of the spinal cord neural tissue in the same condition in each scan, and this parameter correlates closely with neurological prognosis. We quantified previously glucose utilization in the cervical spinal cord of patients with myelopathy [8]. Furthermore, Kamoto et al. [7] reported that the normal metabolic rate of glucose utilization in the cervical spinal cord (SUV) in healthy Japanese subjects (age, 40–70 years) was 1.93 ± 0.23, although this value was found to be 2.12 ± 0.48 and 1.84 ± 0.23 by Nakamoto et al. [21] and Floeth et al. [11], respectively. In another study, we reported that patients with mild to moderate myelopathy have significantly high SUV of the entire cervical spinal cord, while those with marked and profound tetraparesis had significantly low SUV [9]. Thus, a high SUV seems to reflect hyperactive neuronal activity within the spinal cord. In our latest study, patients with poor neurological improvement rate were found to have low preoperative SUV and significantly low postoperative neurological improvement [22]. Unfortunately, our results showed that preoperative SUV was not significantly different among patients with increased signal intensity on MRI.
The combination of the same slice 2 highest-end modalities (3D-MRI using 3T MRI and 18F-FDG PET) in near real-time simultaneous scan has enabled us to image the metabolic function with detectable accuracy at the cervical spinal cord level. Our results showed that 18F-FDG PET is more suitable and sensitive for the detection of changes in low-signal intensity on T1-weighted images on MRI/PET fusion imaging. Our results also suggested that SUVmax for lesions with increased signal intensity correlates with the SIR on T1-WIs and postoperative neurological outcome, but not with SIR on T2-WIs. Additionally, the SUVR is more sensitive to predict neurological improvement than SIR on T1-WIs or SUVmax in signal intensity lesions. Floeth et al. [10] demonstrated a significant decrease in 18F-FDG uptake in the area of the lower cervical cord in patients with myelopathy than the control group. This could be the reason that made SUVR a more sensitive factor than SUVmax at the signal intensity lesion.
Stay updated, free articles. Join our Telegram channel

Full access? Get Clinical Tree


