Fig. 12.1
The general block diagram of the applied image processing (a) and the detailed scheme of algorithm for counting immunopositive and immunonegative cells (b)
The main task of an image processing of the histological slides was automatic recognition and counting of cells, belonging to either immunopositive or immunonegative types. This task was solved by segmenting the image into three parts: the brown cells, the blue cells and the rest, regarded as a background. To construct an efficient segmentation algorithm we have to perform the exact analysis of the processed image and take into account any detailed features characteristic for it, that should be reflected in the methodology of the segmentation procedure. In building these programs we followed the expert observations, which can be summarized in the following points:
the nuclei are stained generally in a homogenous way,
in most cases the cytoplasm or stroma area between the nuclei of the cells are significantly brighter,
the image contains practically only cells subjected to counting,
the size of the cells is stable (small range of changes),
the background is generally not stained.
These observations are very significant in developing the efficient algorithms to quantitative image analysis in neuroblastoma Ki-67 staining specimens. The proposed algorithm was based on the mathematical morphology approach (Soille 2003) and application of the Support Vector Machine (Vapnik 1998; Schölkopf and Smola 2002). To locate the nuclei of the dominant blue color, the grey scale version of the image, based on the difference between the blue and green components was used. This image is subject to the step threshold operations defined as (Soille 2003)
![$$ {T}_{\left[{t}_1,{t}_2\right]}\left[f(x)\right]=\Big\{\begin{array}{ccc}1& if& {t}_1\le f(x)\le {t}_2\\ {}0& else& \end{array} $$](/wp-content/uploads/2017/03/A318343_1_En_12_Chapter_Equ1.gif)
where f(x) represents the pixel intensity and t1, t2 the selected lower and upper threshold values, respectively. The sequential thresholding procedure was developed based on the size restriction of the individual nucleus area and the following conclusion relation:
![$$ {T}_{\left[{t}_{max},{t}_{max}\right]}(f)\subseteq {T}_{\left[{t}_{max-1},{t}_{max}\right]}(f)\subseteq \dots \subseteq {T}_{\left[{t}_0,{t}_{max}\right]}(f) $$](/wp-content/uploads/2017/03/A318343_1_En_12_Chapter_Equ2.gif)
![$$ {T}_{\left[{t}_1,{t}_2\right]}\left[f(x)\right]=\Big\{\begin{array}{ccc}1& if& {t}_1\le f(x)\le {t}_2\\ {}0& else& \end{array} $$](/wp-content/uploads/2017/03/A318343_1_En_12_Chapter_Equ1.gif)
(12.1)
![$$ {T}_{\left[{t}_{max},{t}_{max}\right]}(f)\subseteq {T}_{\left[{t}_{max-1},{t}_{max}\right]}(f)\subseteq \dots \subseteq {T}_{\left[{t}_0,{t}_{max}\right]}(f) $$](/wp-content/uploads/2017/03/A318343_1_En_12_Chapter_Equ2.gif)
(12.2)
The recognition algorithm starts from the minimal value of threshold t1 (close to the white color) and checks if the selected pixels form the objects fully separated from the others, and at the same time fulfills selected size restriction. If yes, they are added to the cell mask. In this process the threshold is changing from the minimal value to the maximal one, corresponding to the darkest pixel in the image. The sequential increase of threshold is repeated in 100 equal steps. If the object was separated in just one step and contained some darker pixels, then in the next few steps these pixels were preserved, forming the whole object. The additional operation of segmentation in the form of the watershed algorithm (Soille 2003) and supplementary brighter nuclei detection procedure were also applied to reduce the number of glued cells.
In the parallel process the other cells in the image (the brown color immunopositive cells and not well segmented blue cells that remained in the mask) are extracted. We start from the grey scale representation of the RGB image subject to thresholding. The threshold value is determined automatically by using the Otsu method (Otsu 1979). As a result of this step we get the set of cells containing the immunopositive cells and the immunonegative (blue) cells. The blue cells extracted in the first stage of thresholding are removed from this set by subtracting both masks. The differential mask is once again segmented by using the watershed method to separate the glued cells. In this way we get the set of brown cells with some (usually small) amount of blue cells that remained in the image after the segmentation procedure done in the first stage.
The final recognition which cell is immunopositive was done by applying the linear Support Vector Machine, working in the classification mode to recognize the brown pixels from the other pixels. The main idea of this classifier is to create a hyperplane that separates both classes with the maximal margin. The input vector for this network is created by three color components of the pixel, represented in the RBG standard. Figure 12.1b depicts the presented above algorithm, stressing these three parallel processes.
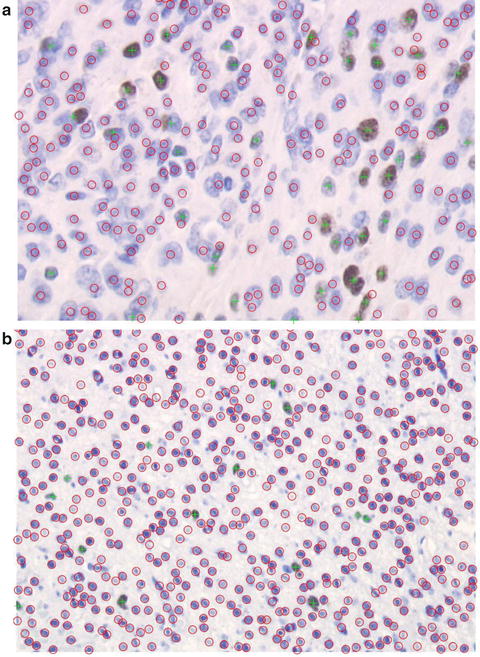
The system delivers the results in the numerical form of MKI indices of the analyzed images as well as graphical form of the annotated images with all recognized cells. The typical graphical output produced by the system, for the images of meningioma and oligodendroglioma are presented in Fig. 12.2a, b. The immunonegative cells depicted in the image are signed by red circle and the immunopositive cells by green plus.


Fig. 12.2
The examples of automatically annotated histological images for the cell counting of (a) meningioma and (b) oligodendroglioma (Ki-67, ×400)
The statistical results of image analysis have shown good accuracy of cell recognition by the developed system and concordance with the results of the human expert. Comparing the results of an automatic and expert evaluation on the set of ten testing images we have found the average discrepancy of the values of mitosis-karyorrhexis index (MKI) equal 0.39 % (the absolute value) which means 4.07 % in the relative terms (2.51 % of standard deviation). The main source of these errors was the limited accuracy recognition of the blue cells. The cause of this problem was the similarity of the blue cells to the background, as well as merging of few cells together in histopathological slides. The minimum (MIN) and maximum (MAX) values of the mitotic level were only slightly different from the true values, and that confirms high quality of the solution achieved by our automatic system.
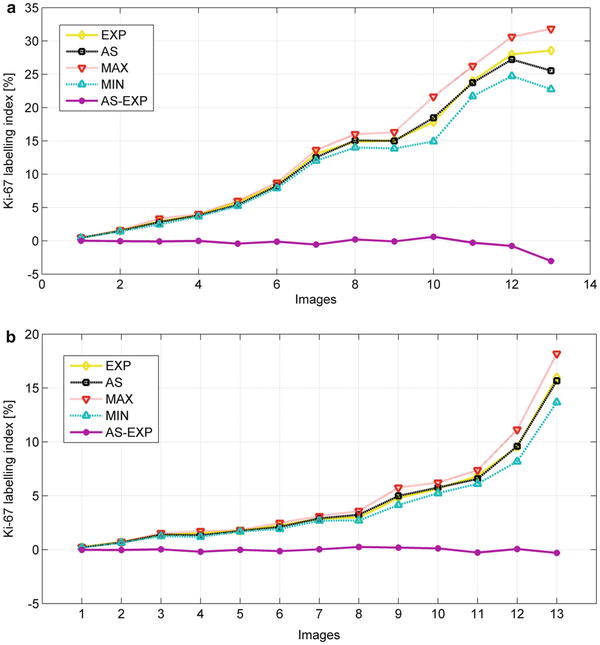
Figure 12.3 presents the graphic illustration of the minimum and maximum mitotic levels for 13 analyzed images representing meningioma (Fig. 12.3a) and oligodendroglioma (Fig. 12.3b) produced by the system and compared to the human expert results. The system’s optimal output is when the lines of automatic system (AS), expert (EX), MIN and MAX are found nearest to each other. Additionally, if the AS line is close to EX line, the mitotic level assessed by the automatic system closely resembles the human expert’s results. The difference between the AS and EX values, i.e., the line (AS-EX) denotes the error line. If MIN and MAX lines lie below and above the AS line in equal distances, the errors are well balanced. On the other hand, if the MAX-MIN range is large, the probability of error is greater and the results generated by AS can be not reliable. The presented plots show that in the significant range of the mitotic level, that is between 0 and 15 %, the AS results are highly acceptable and compatible with the human expert’s results. The detailed description of the algorithm and the numerical results of cell recognition can be found in the paper (Markiewicz et al. 2010).


Fig. 12.3
The graphical interpretation of the mitotic level estimation by our system in meningiomas (a) and oligodendroglioma (b) at Ki-67 staining
The other modified version of the algorithm applied to the analysis of two brain tumors: meningioma and oligodendroglioma at Ki-67 staining was presented in (Markiewicz et al. 2010). The important change was introduction of the prior SVM based classification of pixels before sequential segmentation process. This change eliminated the problem of losing some information which were associated with the conversion of the color image to the gray scale mask used in the previous solution. After application of this introductory step we get automatically the mask appropriate to the recognition of the specific stain reaction regions.
The Support Vector Machine (SVM) classifier of the Gaussian kernel, programmed to recognize the nuclei pixels according to their component’s color, was incorporated to recognize between the brown and blue cells. If the majority of pixels in the cell nucleus were found to be brown, all pixels forming the extracted nuclei were classified as immunopositive. In such case, the cell was added to the immunopositive cell mask. On the other hand, if the majority of pixels in the cell nucleus were blue, the cell was added to the immunonegative mask. The final step of counting the cells of both groups is a simple task for the Matlab program, since it was transformed to summing up the number of cells gathered in the respective masks, done separately for immunopositive and for immunonegative ones.
One of the most important problems with automatic image evaluation of oligodendroglioma Ki-67 specimens is the incidence of the inflammatory, microglia, lymphocytes and stroma cells in the diagnosed view field. The nuclei of these cells are stained immunonegatively in blue color, similar to the negative neoplastic cells. In the case of changing the incidence of these cells, the ratio between immunopositive and immunonegative cells is also changed. For correct diagnosis these cells must be recognized from lesion cells and eliminated. Two different but commonly used methods of texture features generation have been applied to solve the problem. The Markov Random Field model as a source of features (Chellappa and Chatterjee 1985; Wagner 1999) and selected Unser texture features have been exploited. The details of such solution are to be found in the paper (Warowny and Markiewicz 2010).
The actually developed automatic system has enabled to start the statistical quantitative analysis of many patients at H&E and Ki-67 staining. The experiments made on the basis of 24 patients of meningiomas and 26 patients of oligodendrogliomas were directed to the assessment of the tumor cell numbers in the fields of view selected by the pathologist. It was found that all patients suffering from meningioma had the mean of 623 cells in one field of view with the standard deviation of 102 cells. Moreover 95 % of investigated fields of view contained between 386 and 781 cells (very wide range). The average size of the nuclear area of the meningioma cells at this staining was equal 184.5 pixels at standard deviation (SD) of 118 pixels.
Stay updated, free articles. Join our Telegram channel

Full access? Get Clinical Tree


