Fig. 1
The effects of CUS treatment on fEPSP slopes of LTP. (a) Time course of fEPSP slopes evoked in the prelimbic area (PrL) in medial prefrontal cortex (mPFC) by stimulation of the CA1 region. Each point represents mean ± SEM of averaged evoked responses for 2 min epochs. High frequency stimulation is indicated by arrows. (b) Mean fEPSP slopes for the last 20 min of recording after HFS (**p < 0.01)
3.2 Power Spectra Analysis
Wilcoxon signed-rank test showed that there was a significant increment of the mean power after LTP at both CA1 and PrL regions (in pair test for CA1 of Con group: p = 0.046; CA1 of Dep group: p = 0.116; PrL of Con group: p = 0.028; PrL of Dep group: p = 0.046, Fig. 2). On the other hand, Student’s t-test was used to determine the influence of CUS treatment on the LFPs for pre-LTP. The data showed that only the mean power of LFPs at PrL increased in Dep group (p = 0.046), however the mean power of LFPs at CA1 didn’t change (p = 0.716).


Fig. 2
Mean power spectra in 1–100 Hz of LFPs from CA1 and PrL between pre- and post LTP induction in both two groups *p < 0.05 between pre- and post LTP by Wilcoxon test, and #p < 0.05, ##p < 0.01, ###p < 0.001 between two groups by Student’s t-test
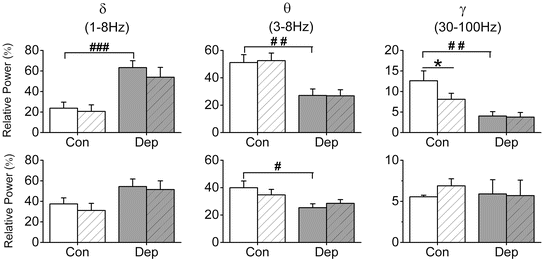
The power spectra in delta (1–3 Hz), theta (3–8 Hz) and gamma (30–100 Hz) were extracted, and the relative power percent of these three frequency bands were obtained by  (Fig. 3). Wilcoxon test showed that the relative power percent didn’t increase after LTP in all the frequency bands at both CA1 and PrL regions, especially for the gamma rhythm in CA1 which was reduced significantly (p = 0.028). As for the comparison between groups, it can be seen that there is an increased tendency only on delta rhythm (CA1 delta: p = 0.001) and a decreased tendency on theta and gamma rhythms of rats in depression (CA1 theta: p = 0.009; PrL theta: p = 0.028; CA1 gamma: p = 0.009).

 (Fig. 3). Wilcoxon test showed that the relative power percent didn’t increase after LTP in all the frequency bands at both CA1 and PrL regions, especially for the gamma rhythm in CA1 which was reduced significantly (p = 0.028). As for the comparison between groups, it can be seen that there is an increased tendency only on delta rhythm (CA1 delta: p = 0.001) and a decreased tendency on theta and gamma rhythms of rats in depression (CA1 theta: p = 0.009; PrL theta: p = 0.028; CA1 gamma: p = 0.009).
Fig. 3
Relative power percent (%) on delta, theta and gamma rhythms between pre- and post-LTP at CA1 (upper panel) and PrL (lower panel) regions in both groups. *p < 0.05 between pre- and post LTP by Wilcoxon test, and #p < 0.05, ##p < 0.01 between two groups by t-test
3.3 Unidirectional Phase Coupling
The results implied that on theta rhythm the unidirectional index c CA1→PrL of pre-LTP reduced significantly in Dep group (p = 0.024). However, the c CA1→PrL index on theta rhythm was increased significantly after LTP induction in both Con (p = 0.028) and Dep (p = 0.046) groups, measured by Wilcoxon test. Also, the relative increment (post/pre ratio) of c CA1→PrL index in Con groups was higher than that in Dep group (p = 0.043) (Fig. 4b).


