Fig. 19.1 CSF report from the Neurochemistry Laboratory, University of Göttingen, Germany, which formed the basis for a variety of commercial software developments adaptable to local analytical profiles. A report that integrates a patient’s CSF/serum data makes it possible to recognize a typical disease-related pattern. Together with possible analytical and clinical plausibility controls, it also forms part of a qualified quality assessment of CSF analysis. The data presented here originate from a patient with definitive multiple sclerosis. At the time of the first “diagnostic” puncture, the question was whether there were any signs of inflammation. The combination of a normal cell count, a humoral immune response (oligoclonal IgG; IgGIF = 74%; IgMIF = 57%), and a polyspecific immune response with increased antibody indices combined for measles, rubella, and varicella-zoster indicates a chronic inflammatory process. Differential diagnosis: multiple sclerosis or autoimmune disease with CNS involvement.
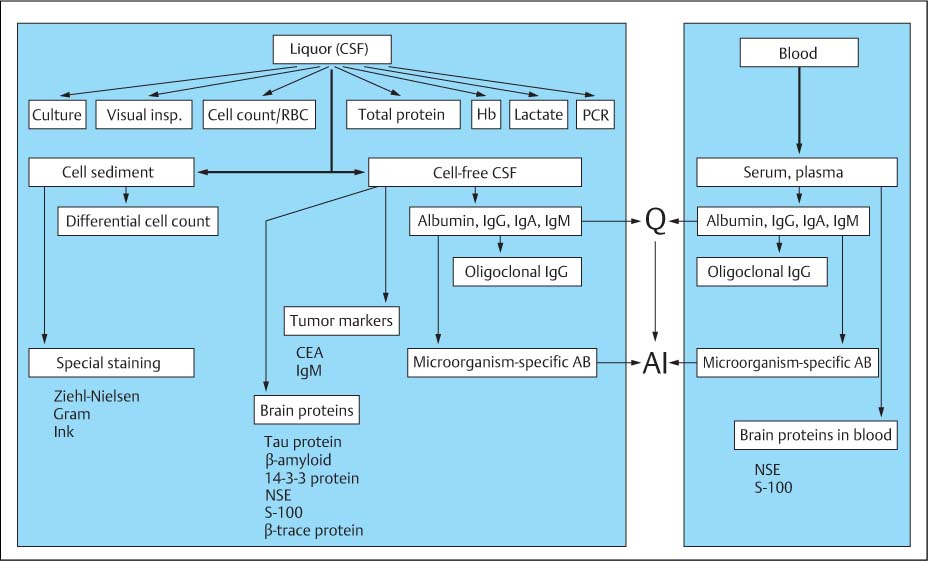
Fig. 19.2 Flow chart of CSF analysis.
A. Emergency program | • Cell count • Total protein (may be only semiquantitative determination) • Lactate • May include a screening test for detection and differentiation of bacterial pathogens |
B. Basic program and more detailed analysis (depending on clinical indication for analysis on and protein data) | • Cytology (cell count, differential cell count, detection of bacteria); if possible, always make a cell preparation (even when cell count is normal) for evaluation when needed. • Total protein (quantitative determination) (used as reference value for dilutions used in subsequent automated nephelometric analysis of single proteins) • Albumin, IgG, IgA, and IgM • Qualitative, sensitive determination of oligoclonal IgG (if IgG quotient is not clearly larger than the albumin quotient) • Detection of microorganism-specific antibodies • Lactate (determine in all cases of barrier dysfunction with moderately increased cell counts). |
C. Special parameters with confirmed clinical relevance | • Specific microorganism detection by PCR (acute inflammation) • MRZ antibody response (chronic inflammation, MS) • Tau protein, β-amyloid1–42, 14–3-3 protein, NSE, or S 100B (dementia, degeneration) • CEA, IgM (tumors) • β-Trace protein (CSF fistula, posttraumatic leak) • Tumor cytology (differentiation of tumors) • Antineuronal antibodies (neurological symptoms of systemic tumors) • Ferritin in cases of hemorrhage |
Evaluation
Quotient Diagram (Reibergram)
Characteristics of quotient diagrams. The quotient diagrams with their hyperbolic reference ranges (also known as Reibergrams, Fig. 5.21) were discussed in detail in Chap. 5, “Quotient Diagrams (Reibergrams).” They are well suited to detecting intrathecal synthesis of IgG, IgA, and IgM based on the analysis of lumbar, cisternal, or ventricular CSF from patients of any age (including newborns). What does differ (between ventricular, cisternal, and lumbar CSF), however, is the age-related reference range of the albumin quotient (Chap. 21, “Proteins”), which, as supported by theory (Reiber, 1994, 2003), has various limits for a blood–CSF barrier dysfunction. As a normal expression of a hyperbolic function we find QIgG > QAlb when QAlb < 0.6 × 10⁻³, even if the CSF is normal (e. g., ventricular CSF). This means that the definition of an intrathecal humoral immune response as QIgM > QIgA, QIgA > QIgG, QIgG > QAlb (which is supported by both theory and practice) should not be applied when QAlb < 1.0 × 10⁻³, not least because of analytical imprecision.
The following should also be taken into account when evaluating quotient diagrams:
• Exchange equilibrium: The quotient diagrams may be used only when the exchange between blood and CSF is at equilibrium. Infusion of plasma expanders after major loss of blood or after plasmapheresis may mimic IgG synthesis, or the IgG quotient may be too low after therapeutic administration of immunoglobulins. Depending on the size of the molecules involved, it may take 8–48 hours until a new equilibrium is established between the compartments (for references see Reiber, 1994).
• Paired analysis: An important prerequisite for the most sensitive use of quotient diagrams is paired analysis of CSF and serum samples in the same analytical run in a corresponding concentration range, which will guarantee quotients to be unbiased by different calibration curves of different accuracies and slope-related variations of the concentrations (Reiber et al., 2003 a).
• Contamination with blood: Heavy contamination of the CSF with blood makes the evaluation of quotients difficult or even impossible (for corrective calculation, see Chap. 21, “Cells”). This applies particularly to QIgM associated with low albumin quotients, which could easily lead to a false interpretation as intrathecal IgM synthesis. Basically, however, even in this situation it should always be remembered that, as supported by theory, despite any contamination with blood, a numerically larger quotient for the larger molecule (e. g., QIgG > QAlb or QIgM > QIgA) indicates intrathecal synthesis. The quotients should always be calculated, even when the erythrocyte count is high (> 7000 erythrocytes/μL), but should be reported as numbers only, without evaluation in the diagram or calculation of an intrathecal fraction.
Typical disease-related patterns. The real significance of IgG, IgA, and IgM quotient diagrams is that they facilitate the recognition of disease-related patterns (Table 19.2, Fig.19.3 ff.).
The response types listed in Table 19.2 show a one-, two-, or three-class response and varying dominance of one particular immunoglobulin class; the tabular presentation, although clear, is of far less practical value than Figs. 19.3 and 19.4, which allow the complex response patterns of the bacterial and viral diseases to be recognized at a glance. It is precisely this possibility of recognizing a specific immunoglobulin pattern at a glance that makes the graphical presentation in the report so attractive (Chap. 19, “Integrated CSF Report”). The diagnostically relevant patterns relate to the first, “differential diagnostic” puncture.
For an adequate interpretation of the intrathecal immune response, however, knowledge of special neuroimmunological response conditions (no isotype switch, Chap. 5, “Immunoglobulins” and Fig. 5.22) and of the temporal dynamics of the intrathecal humoral immune response are both of special relevance (Fig. 19.5).
In looking for disease-specific data patterns, it should not be forgotten that in some diseases typical “pictures” are more the exception than the rule. This may have to do with the localization of the disease process in the brain: only processes that are close to the CSF space can show up clearly in the CSF analysis (Chap. 2).
Pointers toward further analysis. Often the patterns in the quotient diagrams in the context of the differential diagnosis offer the basis for further, more detailed analysis.
Facial nerve palsy. In the case of germ-induced facial nerve palsies, Borrelia-induced disease shows a characteristic immunoglobulin pattern with IgM dominance (Fig. 19.3 d; see also Fig. 5.21) which should be taken as a pointer to further analysis of the Borrelia-specific antibody index. If, on the other hand, the facial nerve palsy is caused by zoster virus (Fig. 19.4 a), the CSF proteins look mostly normal (in about 50% also without oligoclonal IgG). In this case a VZV PCR might perhaps be recommended.
Opportunistic infections in HIV-positive patients. The diagnosis of opportunistic infections in HIV-positive patients is often not easy. The quotient diagram always gives a clear indication of an opportunistic infection by a two- or threeclass immune response (possibly with barrier dysfunction), which is not observed in pure HIV encephalopathy (Fig. 19.4 c). Here, PCR should be considered.
Oligoclonal IgG
When there is doubt about whether intrathecal IgG synthesis is occurring (QIgG ≤ QAlb; IgGIF < 10%), detection of oligoclonal IgG bands by means of isoelectric focusing is the most sensitive way of demonstrating that it is. The interpretation is based on the five types of band patterns (see Fig. 4.13 legend) according to the international consensus (Andersson et al., 1994). In acute diseases, the detection of an immune response by oligoclonal IgG is clinically less sensitive than the antibody index used for detecting the causative antigen (Felgenhauer and Reiber, 1992) (Chap. 5, “Antibody Index”).
Because of the relative sensitivities of the detection methods (Chap. 5, “Antibody Index”), the presence of an intrathecal IgG fraction (IgGIF > 10%) without oligoclonal IgG represents a contradiction—but not the other way around.
Microorganism-Specific Antibodies in CSF and Serum
Antibodies Against the Causative Antigen
In many differential diagnoses, detecting the causative antigen is the decisive diagnostic step. Direct germ detection (by PCR) is often not sensitive enough; antibody detection via the antibody index (see Chap. 5, “Antibody index”) is much more sensitive (Table 19.3).
Subacute sclerosing panencephalitis. A relative high antibody index is often found in this (now disappearing) CNS infection caused by measles, but this does not constitute definite confirmation of SSPE because a polyspecific response (e. g., in MS) can produce similarly high antibody index values (e. g., up to 45) for antibodies with the same high affinity. Only by means of the specific fraction (F s) is it possible to identify antibody synthesis as being directed against a causative antigen (Quentin and Reiber, 2004; Table 19.4).
Zoster ganglionitis (facial nerve palsy). This is caused by the varicella-zoster virus (VZV). With otherwise completely normal CSF findings (Fig. 19.4 a; Fig. 5.26 a and Chap. 5, “Antibody Index”)—even the absence of oligoclonal IgG—the only sign is an increased VZV antibody index (VZV AI = 2.1, Table 19.3).
HSV encephalitis. No earlier than 1–2 weeks after the onset of the disease, a humoral immune response is recognizable (Fig. 19.4 b) that becomes manifest either through the presence of oligoclonal IgG or an increased antibody index. In addition to the dominating herpes simplex antibody (e. g., HSV AI = 37.9, Table 19.3), concomitant VZV antibody synthesis is also observed (VZV AI = 13.0, Table 19.3). Here, too, the level of the absolute concentration (serum titer, or Fs in Table 19.4) helps to decide which of the two parameters represents the causative antigen.
HIV infection. Oligoclonal IgG is found in both stages of pure HIV encephalopathy (Table 19.3) and with opportunistic Toxoplasma infection of the CNS. Whereas a two- or three-class immune response with barrier dysfunction is found in the patients with opportunistic infection (Fig. 19.4 c), the IgG quotient in the patient with the HIV encephalopathy (Fig. 19.4 c) is below the discrimination line (QLim).
MRZ antibody reaction.
Related posts:


Stay updated, free articles. Join our Telegram channel

Full access? Get Clinical Tree


