Treatments’
Surgery day
Post-op day 1
Post-op day 2
6 h post–op “Early” start
6 h post–op
9 h post–op
Every 4 h: 8 AM until 8 PM
8 AM
12 PM
NS
1.4 ml NS
1.4 ml NS
1.4 ml NS
1.4 ml NS
E
HS
Bolus 2.4 ml HS
1.4 ml HS
1.4 ml HS
1.4 ml HS
E
Con
Bolus 0.5 ml Con
0.1 ml Con
0.1 ml Con
1.4 ml NS
E
Con + HS
Bolus 0.5 ml Con
0.1 ml Con + 1.4 ml HS
0.1 ml Con + 1.4 ml HS
1.4 ml HS
E
Con + HSb
Bolus 0.5 ml Con + 2.4 ml HS
0.1 ml Con + 1.4 ml HS
0.1 ml Con + 1.4 ml HS
1.4 ml HS
E
24 h post–op “Late” start
6 h post–op
9 h post–op
8 AM
Every 4 h: 12 pm until 8 PM
8 AM
12 PM
NS
1.4 ml NS
1.4 ml NS
1.4 ml NS
1.4 ml NS
1.4 ml NS
E
HS
1.4 ml NS
1.4 ml NS
Bolus 2.4 ml HS
1.4 ml HS
1.4 ml HS
E
Con
1.4 ml NS
1.4 ml NS
Bolus 0.5 ml Con
0.1 ml Con
0.1 ml Con
E
Con + HS
1.4 ml NS
1.4 ml NS
Bolus 0.5 ml Con
0.1 ml Con + 1.4 ml HS
0.1 ml Con + 1.4 ml HS
E
Con + HSb
1.4 ml NS
1.4 ml NS
Bolus 0.5 ml Con + 2.4 ml HS
0.1 ml Con + 1.4 ml HS
0.1 ml Con + 1.4 ml HS
E
Tissue Preparation and Fluoro-Jade Histochemistry
Animals were euthanized at 48 h post-MCAO and perfused with 0.9 % saline followed by 4 % paraformaldehyde in phosphate buffer (pH 7.4). The brains were harvested and processed as previously described [1]. Sections were collected from six bregma points, ranging from 1.7 to −2.3 mm. For determination of infarct volume, Fluoro-Jade (Histochem, Jefferson, AR, USA) staining was performed to label degenerating neurons. This method was adapted from that originally developed by Schmued et al. [26] and has been subsequently detailed [11].
Immunohistochemistry
Immunohistochemistry was performed to detect activated microglia [12]. Sections were incubated overnight at 4 °C with mouse anti-rat CD11b antibody (Ox-42; 1:3,000; Serotec, Raleigh, NC, USA) in PBS with 2 % goat serum, 0.3 % Triton X-100. The following day, slides were washed with PBS and incubated 1 h at room temperature with horse anti-mouse secondary antibody (1:300; Vector Laboratories Inc., Burlingame, CA, USA) in antibody solution (2 % serum, 0.3 % Triton X-100 in PBS). Slides were then washed with PBS and incubated in Avidin-Biotin Complex (ABC; Vector Laboratories Inc.) mixture for 1 h. Next the slides were washed and then visualized using a DAB/peroxide solution (Vector Laboratories Inc.).
Image Analyses
Images of the brain sections were taken with a 1× objective (for Fluoro-Jade and brain edema) on a Zeiss Axioskop2 microscope (Carl Zeiss Inc., Thornwood, NY, USA) using Open Lab software (Improvision Ltd., Lexington, MA, USA). Hemispheric areas were measured using Image J software (National Institutes of Health). Photomicrographs were processed using Jasc Paint Shop Pro to sharpen and enhance contrast to the same specifications for all slides.
Fluoro-Jade stained slides were used to calculate infarct volume. Total area of positive staining was measured in the ipsilateral and contralateral hemispheres for each section. The area values for six representative bregma points throughout the infarct were totaled for each animal, and infarct volumes were calculated as the percent of the contralateral hemisphere.
For edema, thaw-mounted slides were air-dried overnight before imaging. The area of each hemisphere was measured and the ventricular areas were subtracted from the hemispheric area. The total adjusted area for each hemisphere was determined across all six bregma points, and edema for each animal was calculated as a percentage of the contralateral hemisphere.
For CD11b immunohistochemistry, images were taken with a 10× objective. Three regions of the striatum were imaged (upper right, middle left, and lower center) for the first four bregma points collected (1.7 to −1.3). The area fraction of CD11b-positive staining was calculated for each image, and data are expressed as the average area fraction for each group.
Statistical Analyses
Data from all experiments were quantified and analyzed using GraphPad Prism 6.0 (GraphPad, La Jolla, CA, USA) software. For all statistical tests, the threshold for significant differences between groups was set at p < 0.05. For behavioral tests, significant effects of treatment were determined using unpaired, two-tailed t-tests with Welch’s correction. For all other data, main effects were determined using one-way or two-way analysis of variance (ANOVA) followed by Fisher’s least squares difference test for pairwise comparisons between treatment groups.
Results
Infarct Volume
Infarct volume was measured with Fluoro-Jade staining to determine the efficacy of HS and conivaptan, both alone and in combination, when administered either 6 h or 24 h following MCAO. Total area occupied by staining was calculated for each animal and was expressed as a percentage of Fluoro-Jade positive area in the ischemic hemisphere relative to the contralateral hemisphere.
Both HS and conivaptan elicited protection when administered 6 h after MCAO (Fig. 1). NS controls showed large expanses of Fluoro-Jade throughout the striatum and adjacent cerebral cortex (Fig. 1a), whereas staining appeared markedly reduced in sections from animals treated with HS or Con (Fig. 1b, c). Quantification of total infarct volume (Fig. 1d) showed significant reductions in the 6 h HS (p = 0.0411, t = 1.825) and Con (p = 0.050, t = 1.678) relative to NS controls, whereas there were no significant differences in the combined Con + HS (p = 0.0922, t = 1.370) or Con + HSb groups (p = 0.3296, t = 0.4489) compared to NS controls.
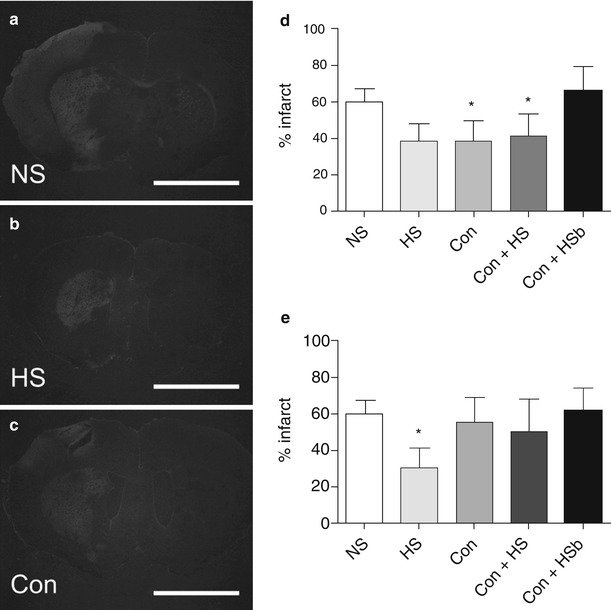
Fig. 1
(a–c) Representative micrographs of Fluoro-Jade stained sections from rats treated with NS, HS, or Con 6 h after MCAO. Fluoro-Jade staining was abundant throughout the striatum and cerebral cortex after treatment with NS (a), whereas staining was markedly reduced in sections from rats treated with HS (b) and Con (c). Quantification of infarct volume (d) showed significant reductions in rats treated with HS or Con (p < 0.05), whereas there was no significant difference between NS controls and rats that received Con + HS or Con + HSb. *p < 0.05, n = 4−6 per group. Scale bars = 2 mm. NS, normal (0.9 %) saline. HS, hypertonic (5 %) saline. Con, conivaptan. Con + HS, conivaptan + hypertonic (5 %) saline maintenance. Con + HSb, conivaptan/hypertonic (5 %) saline bolus + hypertonic (5 %) saline maintenance. Quantification of infarct volume in rats treated with NS, Con, Con + HS, or Con + HSb 24 h after MCAO (e). Data show a significant reduction in infarct volume following treatment with HS relative to NS controls (p < 0.05), whereas there were no significant differences after treatment with Con. Combined treatments produced no protective effect, as the Con + HS and Con + HSb groups showed no significant differences relative to NS controls. *p < 0.05, n = 4–6 per group. NS, normal (0.9 %) saline. HS, hypertonic (5 %) saline. Con, conivaptan. Con + HS, conivaptan + hypertonic (5 %) saline maintenance. Con + HSb, conivaptan/hypertonic (5 %) saline bolus + conivaptan/hypertonic (5 %) saline maintenance
Interestingly, the results from the 24 h post-treatment groups were not entirely consistent with those obtained from the 6 h groups (Fig. 2). Similar to the 6 h treatments, animals that received HS 24 h after MCAO showed significant reductions in infarct volume (p = 0.0207, t = 2.217) relative to NS controls, while there were no significant differences from controls in the combined Con + HS (p = 0.2722, t = 0.6204) or Con + HSb (p = 0.4399, t = 0.1532) groups. However, unlike the 6 h treatment, animals that received Con 24 h after MCAO showed no significant difference in infarct volume (p = 0.3753, t = 0.3235) compared with NS controls.
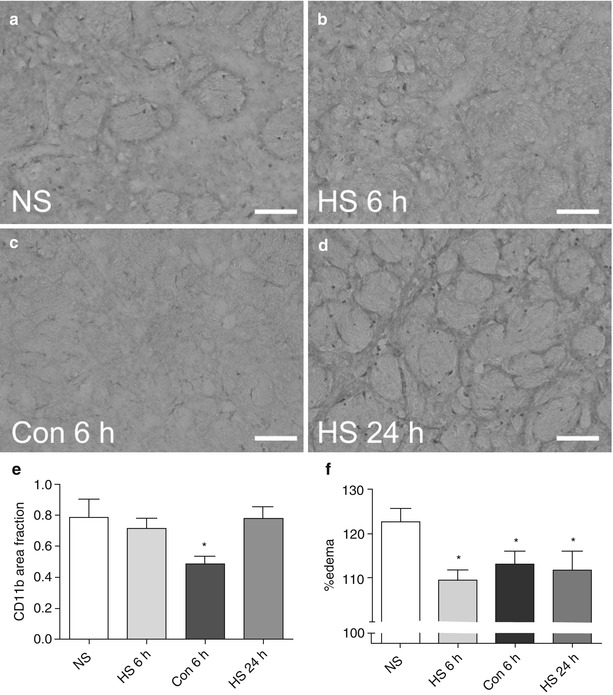
Fig. 2
 of Behavioral Deficits in Rodents Following Brain Injury Across Species, Gender, and Experimental Model
 Infarction After Aneurysmal Subarachnoid Hemorrhage
 Volume Determination in Subarachnoid Hemorrhage Using Rats
 Endothelial Growth Factor in Brain Edema Formation After Subarachnoid Hemorrhage
 in Brain Swelling and Infarction Volume over Four Days After Hypoxia Ischemia in Neonatal Rats
 Injection of Noncellular Cerebrospinal Fluid from Subarachnoid Hemorrhage Patient into Rat Ventricles Leads to Ventricular Enlargement and Periventricular Injury


(a–d) Representative micrographs of CD11b immunohistochemistry in sections from rats treated with HS or Con 6 h after MCAO, or HS 24 h after MCAO. Immunohistochemical staining shows a profile of ubiquitous CD11b-positive cells within the striatum of an NS control (a) that resembles sections from rats treated with HS (b, d). Treatment with Con 6 h after MCAO resulted in reduced numbers of CD11b-positive cells (c). Quantification revealed a significant reduction in the area occupied by CD11b staining in the 6 h Con group (p < 0.05) relative to NS controls and HS groups. *p < 0.05, n = 4–6 per group (e). Quantification of brain swelling in rats treated with HS or Con 6 h after MCAO, or HS 24 h after MCAO (f). Brain swelling was calculated in groups that showed efficacy in reducing Fluoro-Jade staining to assess whether edema might account for the observed effects. Data show significantly reduced brain edema in 6 h HS, 6 h Con and 24 h HS rats relative to NS controls (p < 0.05), thus establishing a relationship between neurodegenerative injury and brain swelling. *p < 0.05, n = 4–6 per group. NS, normal (0.9 %) saline. HS 6 h, hypertonic (5 %) saline administered 6 h after MCAO. Con 6 h, conivaptan administered 6 h after MCAO. HS 24 h, hypertonic (5 %) saline administered 24 h after MCAO. Scale bars = 50 μm. NS, normal (0.9 %) saline. HS 6 h, hypertonic (5 %) saline administered 6 h after MCAO. Con 6 h, conivaptan administered 6 h after MCAO. HS 24 h, hypertonic (5 %) saline administered 24 h after MCAO
Related posts:
of Behavioral Deficits in Rodents Following Brain Injury Across Species, Gender, and Experimental Model
Infarction After Aneurysmal Subarachnoid Hemorrhage
Volume Determination in Subarachnoid Hemorrhage Using Rats
Endothelial Growth Factor in Brain Edema Formation After Subarachnoid Hemorrhage
in Brain Swelling and Infarction Volume over Four Days After Hypoxia Ischemia in Neonatal Rats
Injection of Noncellular Cerebrospinal Fluid from Subarachnoid Hemorrhage Patient into Rat Ventricles Leads to Ventricular Enlargement and Periventricular Injury
Stay updated, free articles. Join our Telegram channel
Full access? Get Clinical Tree
