Chapter 14 Neuromuscular electrical stimulation: nerve–muscle interaction
INTRODUCTION
It is well known that physical performance capabilities are affected by the amount and types of daily physical exercise. Someone who exercises on a regular basis has a leaner body mass and greater strength than someone who takes little or noexercise (Enoka 1997). Andersen and colleagues (1999), looking ahead to the possibilities of genetic enhancement, raised the issue of whether elite runners, swimmers, cyclists and cross-country runners are born different from the rest of us or whether ‘proper’ training and determination could turn almost anyone into a champion.
Recent findings have contributed to our understanding of how human muscle adapts to exercise or the lack of it and the extent to which muscle alters in response to different challenges. Voluntary muscle strength increases with training but the mechanisms involved remain controversial (Gandevia 2001) and there is marked intersubject variation (Enoka 1997). Detraining effects have been shown to affect cardiorespiratory endurance, muscle endurance, muscle strength and power (see the section Effect of immobilization, below).
Selecting appropriate electrical stimulation and exercise regimens are two of the ongoing challenges in rehabilitation in the twenty-first century. In respect of electrical stimulation, much has been gained from animal studies, in which variables can be controlled and extensive investigations undertaken. In drawing evidence from existing human studies, there is a need to distinguish between evidence drawn from studies involving normal healthy individuals and studies on the many different patient groups (Bax et al 2005).
BACKGROUND
Differences in the distribution of fibre types in whole human muscles were first established in autopsy studies (Johnson et al 1973). Advancesin histochemical techniques (see Chapter 5), together with more acceptable methods of taking muscle biopsies from human subjects (Edwards et al 1977), were complemented by the examination of contractile properties using electrophysiological techniques. Increasingly, teams of researchers from a range of scientific and clinical backgrounds have become involved in studies to monitor the changes that occur in the genetic, molecular, physiological, and biochemical components of living human muscle (see Chapter 5).
Investigation of changes in fundamental characteristics of human skeletal muscles are often accompanied by measurements of individual or group muscle performance in either isometric or isokinetic contractions or using kinemetric technology (Hortobàgyi et al 2000, Liu et al 2003, Short et al 2005). These can, or possibly should, at least include measurements of peripheral fatigue and the time course of muscle contraction in addition to monitoring changes in electrophysiological activity using surface EMG (see below).
MONITORING AND MEASUREMENT
Recent years have seen a growing elucidation of peripheral and central electrophysiological responses and objective documentation of the clinical benefits that neuromuscular electrical stimulation (NMES) can provide (Alon 2003). Evidence has shown that these changes are extensive and occur at a number of levels (including changes at a molecular level in the contractile proteins, and at a biochemical level in respect of the metabolic enzymes) affecting the structural and physiological characteristics of skeletal muscle. So far in clinical studies of electrical stimulation, the tendency has been to focus on changes in maximum voluntary strength (MVC) and levels of muscle activation (see below).
Assessment of any aspect of muscle strength in clinical and experimental situations usually requires the full cooperation and motivation of the subject. Gandevia (2001) provided a summary of the well-established experimental details and critical procedures that should always be in place when measuring muscle strength. These include:
VOLUNTARY MUSCLE ACTIVATION
The ability to activate all of the motor units of a muscle can be tested using twitch superimposition, now often know as twitch interpolation (Enoka & Fuglevand 1993, Herbert & Gandevia 1999, Rutherford et al 1986). Figure 14.1 shows that twitch interpolation occurs during an MVC when a single pulse or, as in this case, a series of single twitches are delivered to the intramuscular branches of the femoral nerve. In Figure 14.1B, a twitch-like increment in force can be detected on the force output as the subject attempts to achieve a maximal voluntary contraction of their muscles but fails to recruit all of their quadriceps femoris motor units to a maximal level (Behm & St Pierre 1997, Merton 1954, Todd et al 2004).
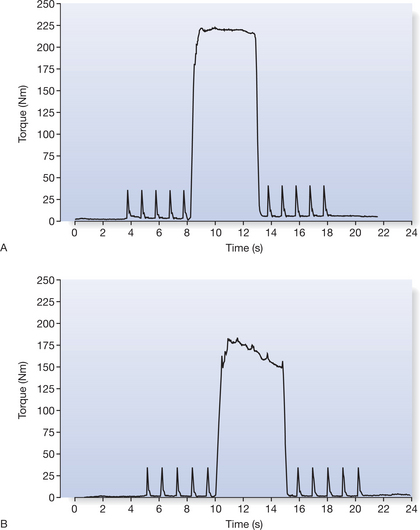
Other researchers have used a ten-pulse electrical train at 100 Hz on a maximal effort contraction and compared volitional to electrically augmented effort (Chmielewski at al 2001, Stackhouse et al 2001, Synder-Mackler et al 1994). The resulting deflection in torque is used to measure the ‘level’ of excitation of muscle. Most normal healthy subjects have the ability to activate their muscles to a high level (voluntary activation scores ≈95%); the level is not consistently 100% (Gandevia 2001).
Maximum activation can be brought about through greater motor unit recruitment or a higher rate of motor unit firing. In healthy subjects, early gains of muscle strength have been attributed to altered neural drive, sometimes known as the learning effect (Jones et al 1989, Komi 1986). In untrained subjects, increases in muscle strength on repeated assessment and in the first few weeks of training may be due to this learning effect.
FATIGUE AND ENDURANCE
The term ‘fatigue’ (the opposite of endurance) has many different meanings, often associated with exhaustion and overuse. Fatigue can be a symptom reported by someone with no apparent physiological or pathological state, where performance is below expected maximum. For the physiologist, muscle fatigue has been defined as the failure to maintain the required force or power output during sustained or repeated voluntary or electrically elicited contractions (Edwards 1981). The rate of fatigue depends on the muscles employed and whether the contractions are continuous or intermittent. Fatigue has both central and peripheral components. Failure at any point in the chain of command from the higher centres in the brain via the spinal cord, motor neurons and neuromuscular junctions to the individual cross-bridges can lead to loss of force and slower rates of relaxation. The central components occur proximal to the anterior horn cell. Supraspinal fatigue, a subset of central fatigue is the failure to generate output from the motor cortex (for a review, see Gandevia 2001). Peripheral fatigue occurs at or beyond the neuromuscular junction and within the muscle fibres themselves.
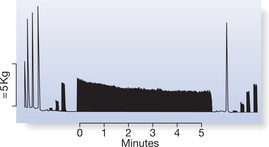
The response of skeletal muscle to sustained electrical stimulation is one way used to study peripheral fatigue in human skeletal muscle (Fig. 14.2). The protocol based on fatigue testing by Burke (1967) monitors the decline in tension of between 20 and 30% MVC during repeated tetanic stimulation at 40 Hz for 250 ms over a period of 3–5 minutes. This form of testing allows peripheral fatigue to be measured independently of volition and of failure of the central neural processes, and has established validity and reliability in both adult and children’s muscles (Hanchard et al 1998, Scott et al 1985).
TIME COURSE OF CONTRACTION AND FORCE–FREQUENCY RESPONSES
The contractile properties are assessed within the same protocol (see Fig. 14.2). Force–frequency responses to short trains of stimuli (1, 10, 20 and 40 Hz) can be determined and the response calculated by relating the force generated at the lower frequencies to that generated at 40 Hz both before and after the fatigue test. The time course of contraction can be monitored throughout and changes in the half-time of relaxation (⅓RT40) defined as the time for the force to drop from peak force to half peak force recorded (Scott et al 1990).
CENTRAL MOTOR PATHWAY CONDUCTIVITY AND INFLUENCES OF DESCENDING NERVE PATHWAYS
Magnetic stimulation is one of the most recent developments in the field of electrodiagnosis. Originally designed for the stimulation of peripheral nerves (Merton et al 1982), magnetic stimulation has been applied widely for painless stimulation of the brain, spinal cord and nerve roots. It is currently used to examine central motor pathway conductivity and to assess excitatory and inhibitory influences of descending neural pathways. Magnetic stimulators use a magnetic field that varies over time and passes unchanged through skin and bone to induce currents in excitable tissue. When such activation is applied to the brain, neurons in the cortex can be activated and a motor response elicited in the form of electromyographic (EMG) recordings in the targeted muscle. Recent work using transcranial magnetic stimulation (TMS) has demonstrated impaired voluntary activation both during maximal effort and in sustained maximal fatiguing contractions in the elbow flexors and provides a potential means to identify the ‘site’ of failure of voluntary drive, i.e. central fatigue (Todd et al 2004).
ELECTRICAL ACTIVITY OF MUSCLES: SURFACE ELECTROMYOGRAPHY RECORDINGS
Surface EMG recordings represent the summation of electrical activities of all of the active motor units in the muscle at that instant (Akataki et al 2004, Kamen & Caldwell 1996). Figure 14.3 illustrates — schematically — a single action potential (AP) being recorded from a muscle fibre by two external electrodes. The muscle cell membrane is electrically excitable so that it caries the all-or-none action potentials just as in the nerve action potential (see Chapter 5). The muscle fibres from which activation is recorded vary considerably in temporal and spatial dimensions. The APs from the numerous muscle fibres innervated by a single motor neuron summate to produce a motor unit action potential (MUAP). Surface electrodes (either silver–silver-chloride discs or more malleable self-adhesive electrodes) are attached to the skin overlying the muscle from which activity is to be recorded. The potential difference between two electrodes is recorded through a differential amplifier; a third more remote electrode is used as reference. The recorded signal represents the sum of the individual potentials of all the muscle fibres that are being activated.
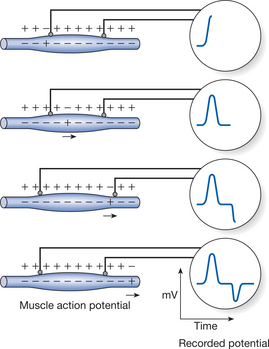
Figure 14.3 Representation of the changes in action potentials being recorded by external electrodes.
Surface EMG signals can be analysed in terms of two variables: amplitude and frequency. The first step in determining amplitude involves full-wave rectification. Rectification means that the EMG signal is converted into a signal containing only positive voltages. The rectified signal is then filtered with a low-pass filter (Winter 1990). This provides a linear envelope or ‘moving average’ because it follows the trend of the EMG. The area of the linear envelope can then be computed providing an assessment of the amplitude of the signal. Sometimes known as the time domain, the amplitude or root mean square (RMS) of this integrated signal has been documented as being positively correlated to muscle force. Loss of force and changes in integrated signal, together with changes in median frequency (see below), can also be used to monitor fatigue during a sustained voluntary contraction. However, care has to be taken in interpreting the relationship between tension generated by the muscle and this signal. A known standard such as the amplitude of the signal in a maximum contraction should be used for purposes of comparison.
Studies have suggested that the MDF is least susceptible to noise (see Kollmitzer et al 1999) and, increasingly, MDF is used to identify motor neuron recruitment strategies during muscle contractions (Bernardi et al 1995, Gerdle et al 2000).
FUNCTIONAL ASPECTS OF CHANGES IN ARCHITECTURAL STRUCTURE
Skeletal muscle architecture can be defined as ‘the arrangement of muscle fibres within a muscle relative to the axis of force generation’ (Lieber & Friden 2000). There are three general classes of muscle fibre architecture:
Most skeletal muscles are multipennate (e.g. gluteus medius). Body mass and muscle cross-sectional area (CSA) strongly influence muscle strength. In terms of muscle CSA, the phenomenon of muscle fibre pennation allows physiological muscle CSA, which is defined as the magnitude of muscle fibre area perpendicular to the longitudinal axis of individual muscle fibres multiplied by the cosine of the angle of pennation exceed the anatomical muscle CSA measured in a plane axial to the longitudinal axis of the muscle (Aagaard et al 2001). Measurements of muscle thickness, fibre length and pennation angle provide additional data for understanding both strength deficits and the effects of training, and can be calculated using ultrasound (Aagaard et al 2001, Fukunaga et al 1997, Leiber & Friden 2000). These measures are non-invasive and not dependent on the ability to perform a maximum muscle contraction (Aagaard et al 2001). Understanding the underlying macroscopic arrangement of muscle fibres and the changes in muscle size and shape that can occur, for example following immobilization and training, or in children with Duchenne muscular dystrophy (DMD), are important in understanding the mechanisms underlying loss of muscle strength.
EFFECTS OF IMMOBILIZATION
Most people are very aware of the effects of disuse, immobilization and prolonged bed rest. An individual confined to bed for a few weeks or who has had a limb immobilized in a cast will experience muscle atrophy and loss of muscle strength. Duchateau and Hainaut (1990), looking at the effects of plaster cast immobilization on the adductor pollicis, showed loss of strength and EMG and an inability to activate fully on voluntary command after 6 weeks of immobilization, with a rapid return to normal activity on remobilization. A similar experiment of immobilization for 4 weeks by Yue et al (1994) resulted in loss of strength and an inability to activate the elbow flexor muscles. Immobilization reduces motor firing rate (Duchateau & Hainaut 1990) and affects the mechanical properties of the muscle (Davies et al 1987).
Williams and Goldspink (1984) showed that reduction in fibre length of muscles immobilized in a shortened position is accompanied by reduced compliance of the muscle and an increase in the proportion of connective tissue. But if the muscle was then stretched for short periods, this prevented the connective tissue changes but did not prevent the reduction in muscle length (Williams et al 1986). Cotter and Phillips (1986) found that the transition from fast to slow muscle fibres was accelerated in rabbit tibialis anterior muscle with immobilization in the neutral position; Williams et al (1986) found greater increases in sarcomeres when a muscle was immobilized in a stretched position. Later, links were established between gene expression and mechanical signals, including muscle fibre phenotype expression (Goldspink et al 1992). Cast immobilization in either the lengthened or the shortened position and with or without electrical stimulation caused regression of fast type and activation of slow myosin genes.
St-Pierre and Gardiner (1987), reviewing the effects of immobilization and exercise in both animal and human skeletal muscle studies, summarized their conclusions as follows:
Changes in strength, size of muscle fibre and MHC gene expression were monitored in 48 previously sedentary young men and women after 3 weeks of unilateral knee splint immobilization followed by 12 weeks of retraining (Hortobàgyi et al 2000). Immobilization significantly but uniformly reduced eccentric, concentric and isometric strength by 47%, whereas no changes in strength occurred in the control group; fibre type I, IIa and IIx muscle fibre areas were reduced by 13, 10 and 10%, respectively, but fibre type did not alter; EMG activity (RMS) altered in parallel with the force data and did not change in the non-immobilized knee. After 2 weeks of spontaneous recovery, all fibres were 5% smaller than at baseline. The subjects were then randomly assigned to a control group and three exercise groups for 12 weeks, three sessions/week. Hypertrophy of type I, IIa and IIx fibres relative to baseline was 10, 16 and 16% after eccentric and 11, 9 and 10% after mixed training, exceeding the 4, 5 and 5% gains after concentric training. Immobilization downregulated the expression of type I MHC mRNA to 0.72 of baseline and exercise training upregulated it to 0.95 of baseline, whereas immobilization and exercise training upregulated type IIa MHC mRNA 2.9-fold and 1.2-fold, respectively. Significantly greater hypertrophy of the muscle fibres was found after eccentric training together with upregulation of type IIx myosin heavy-chain messenger RNA. The suggestion was that the faster rate of strength recovery and greater strength gains were due to the unique aspects of the muscle lengthening of eccentric training.
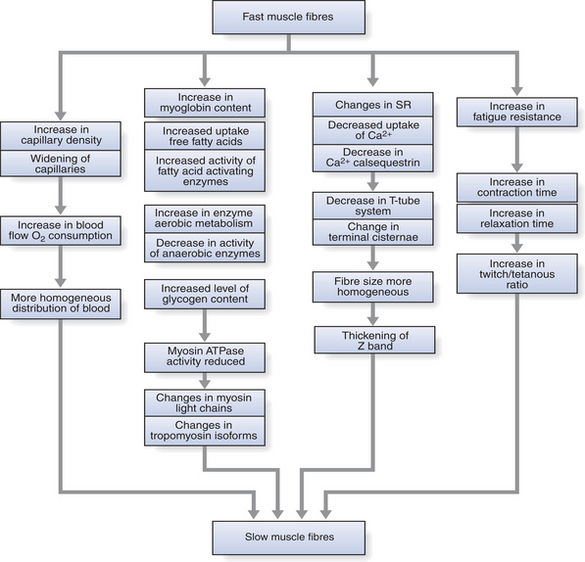
Figure 14.4 Schematic representation of effects of chronic low-frequency stimulation on fast muscle fibres.
Studies (Andersen et al 1999) of bed rest in normal healthy subjects for a similar period using both ATPase histochemistry and immunocytochemistry observed overall fibre atrophy together with an increase in fibres in a ‘transitional’ state from phenotypic type I → IIa and Ia → Ix. Atrophy of the quadriceps femoris was investigated in nine patients after anterior cruciate ligament reconstruction (ACLR) and immobilization in a long leg plaster (Häggmark et al 1981). Allowed to walk on the operated leg as soon as pain permitted, standard isometric training consisted of 3–6 seconds maximal hold relaxed for 6 seconds until training could be sustained for 1 hour. Muscle biopsies were taken before surgery, 1 week after surgery and after 5 weeks but before the cast was removed. Selective atrophy was found with reduction of cross-cut area and oxidative enzymic activity in the slow-twitch type I fibres. The inhibiting role of postoperative pain was raised as a critical factor in inhibiting muscle activity in this acute postoperative period. A recent review (Risberg et al 2004) showed that recovery of muscle strength following traumatic knee injury and restoration of performance capabilities can in some instances take many months despite intensive rehabilitation.
Studies by Snyder-Mackler and colleagues (1993) on the activity of the quadriceps femoris muscle following ACLR using a modified Burke fatigue test showed weakness of the involved muscles but a less marked rate of fatigue over the first 60 seconds of the test than occurred in the stronger, uninvolved muscles. These were surprising results and suggest that there had been selective type II fibre atrophy in the involved muscles.
MUSCLE WEAKNESS AND ENDURANCE IN ELDERLY PEOPLE
Ageing is associated with reduced muscle strength and atrophy of type II muscle fibres (Bazzucchi et al 2004, Frontera et al 2000, Roos et al 1999, Short et al 2005, Suetta et al 2004, Williams et al 2002, Williamson et al 2000). Age-related declines in muscle strength and power, an inactive lifestyle, increasing difficulty with functional tasks requiring rapid power output, such as climbing stairs or rising from a chair, and an increased incidence of falls are well documented in older people (for a review, see Thompson 1994). Loss of strength is most marked in the lower limb muscles. Studies of the quadriceps femoris show age-related reductions in muscle mass, although there is some doubt about the ability of elderly people to fully activate this muscle.
The differences in strength between young women and fit elderly women have been associated with increased fatigue resistance together with slowing of relaxation times but with no differences in their ability to activate their quadriceps femoris muscles fully (O’Connor et al 1993). Roos and colleagues (1999), in a study of the muscles of young and old men, reported a similar 50% loss of strength, slower contractile speeds and higher tetanic fusion at lower frequencies of stimulation with full activation of quadriceps femoris muscles in the older men. They found no age-related difference in motor unit firing rates. This suggests that the loss of strength was not related to central activation or changes in motor neuron firing rates but rather to detraining through lack of exercise.
Progressive resistance training has been shown to be an effective means of improving muscle strength in very elderly people; the ‘neural’ changes specific to the training tasks played an important role in the initial strength gains (Harridge et al 1999). None of the women were able to activate the quadriceps femoris muscles fully either before, or indeed after, progressive exercise training. However, there was an increase in muscle mass after training, together with increased strength and ability to lift weights.


Stay updated, free articles. Join our Telegram channel

Full access? Get Clinical Tree


