Electrodiagnostic Tests: Introduction
In addition to using a patient’s history, physical examination, and imaging results, the clinician can obtain information about the functional status of various parts of the nervous system by monitoring its electrical activity. This is accomplished via a variety of electrodiagnostic tests, which are described in this chapter.
Electroencephalography
Electroencephalography provides a noninvasive method for studying the ongoing or spontaneous electrical activity of the brain. The potentials of the brain are recorded in an electroencephalogram (EEG); they appear as periodic waves, with frequencies ranging from 0.5 to 40 cycles per second (cps or hertz [Hz]) and with an amplitude that ranges from five to several hundred microvolts. Because the amplitude of cerebral electrical activity is much smaller than that obtained from the heart in an electrocardiogram (ECG), sensitive (but stable) amplification is necessary to produce an undistorted record of brain activity; this requires proper grounding and electrical shielding.
Electroencephalography can provide useful information in patients with structural disease of the brain, especially when seizures occur or are suspected. Electroencephalograms can be very useful in classifying seizure disorders, and because optimal drug therapy varies for different types of seizures, the EEG findings may have important implications for treatment. Electroencephalography is also useful in evaluating cerebral abnormalities in a number of systemic disorders and in performing workups on patients with sleep disorders.
Because computed tomography (CT) scanning and magnetic resonance imaging (MRI) have higher spatial resolution and can localize lesions in three dimensions, these imaging techniques are usually used in preference to EEG for the localization of destructive lesions in the brain. When other tests are not available, an EEG can furnish help in determining the area of cerebral damage. Electroencephalography has its limitations, however, and normal-appearing records can be obtained despite clinical evidence of severe organic brain disease. The use of depth electrography—the localization of a focus by recording from electrodes implanted within the brain—may be advisable in certain cases.
The activity recorded in the EEG originates mainly from the superficial layers of the cerebral cortex. Current is believed to flow between cortical cell dendrites and cell bodies. (The dendrites are oriented perpendicular to the cortical surface.) As a result of the synchronous activation of axodendritic synapses on many neurons, summed electrical currents flow through the extracellular space, creating the waves recorded as the EEG. The pattern of activation of cortical neurons, and thus the EEG, is modulated by inputs from the thalamus and reticular formation (called the reticular activating system by early researchers).
To detect changes in activity that may be of diagnostic importance, simultaneous recordings are obtained, when possible, from multiple areas on both the left and right sides of the brain. Electrodes are ordinarily attached to the scalp over the frontal, parietal, occipital, and temporal areas; they are also attached to the ears (Fig 23–1).
Figure 23–1
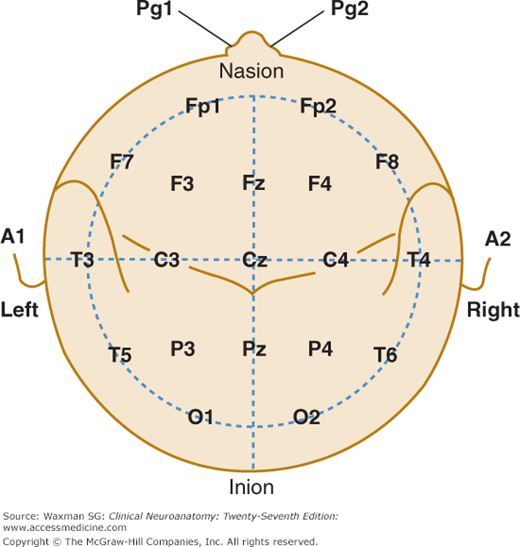
A single-plane projection of the head, showing all standard positions of electrode placement and the locations of the central sulcus (fissure of Rolando) and the lateral cerebral fissure (fissure of Sylvius). The outer circle is drawn at the level of the nasion and inion; the inner circle represents the temporal line of electrodes. This diagram provides a useful guide for electrode placement in routine recording. A, ear; C, central; Cz, central at zero, or midline; F, frontal; Fp, frontal pole; Fz, frontal at zero, or midline; O, occipital; P, parietal; Pg, nasopharyngeal; Pz, parietal at zero, or midline; T, temporal. (Courtesy of Grass Technologies, An Astro Med, Inc. Produce Group, West Warwick, RI.)
With the patient recumbent or seated in a grounded, wire-shielded cage, a recording at least 20 minutes long is obtained; the eyes should be closed. Hyperventilation, during which the patient takes 40 to 50 deep breaths per minute for 3 minutes, is routinely used during this time because it frequently accentuates abnormal findings (epileptiform attacks) and may disclose latent abnormalities. Rhythmic light-flash stimulation (1–30 Hz), also termed photic stimulation, is performed for 2 minutes or longer as part of the recording routine. In some cases, the EEG is continued after the patient is allowed to spontaneously fall asleep or after sedation with drugs; under these circumstances certain epileptic discharges and other focal abnormalities are more likely to be recorded.
The synchronized activity of many of the dendritic units forms the wave pattern associated with alpha rhythm when the patient is awake but at rest with the eyes closed. The alpha rhythm has a periodicity of 8 to 12 Hz. Desynchronization, or replacement of a rhythmic pattern with irregular low-voltage activity, is produced by stimulation of specific projection systems from the spinal cord and brain stem up to the level of the thalamus.
When the eyes are opened, the alpha rhythm is replaced by an alpha block, a fast, irregular, low-voltage activity. Other forms of sensory stimulation or mental concentration can also break up the alpha pattern. Desynchronization is sometimes termed the arousal, or alerting, response, because this breakup of the alpha pattern may be produced by sensory stimulation and is correlated with an aroused or alert state. The beta rhythm is characterized by low amplitude (5–20 μV) waves with a rhythm faster than 12 Hz, most prominent in the frontal regions.
Theta rhythms (4–7 Hz) are normally seen over the temporal lobes bilaterally, particularly in older patients, but can also occur as a result of focal or generalized cerebral dysfunction. Delta activity (1–3 Hz) is never seen in the normal EEG and indicates significant dysfunction of the underlying cortex. Brain tumors, cerebral abscesses, and subdural hematoma are often associated with focal or localized slow-wave activity. CT and MRI, however, can provide more information about the location and structure of the lesion and have largely replaced EEG for the diagnosis of these disorders.
Epilepsy is an expression of various cortical diseases characterized by transient disturbances of brain function manifested by intermittent high-voltage waves. Electroencephalograms from patients with various types of epilepsy are shown in Figure 23–2. Spikes and sharp waves have characteristic shapes and occur either as part of seizure discharges or interictally in patients with epilepsy. These EEG abnormalities can be diffuse or focal, suggesting a localized abnormality.
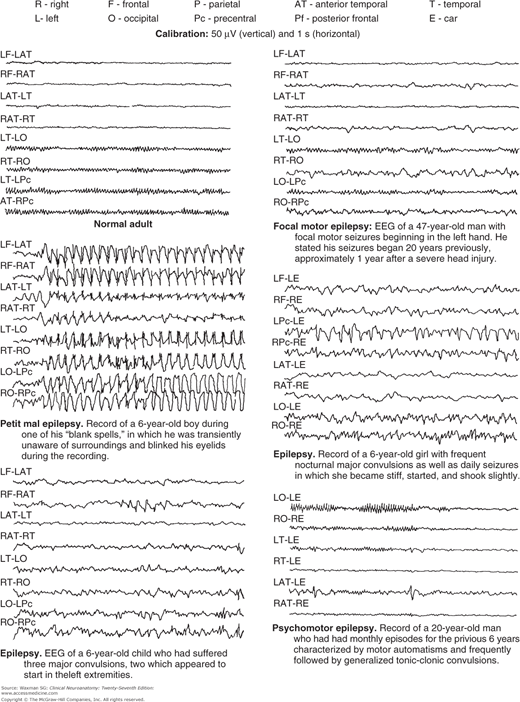
Absence seizures of childhood (petit mal), which are characterized by brief (up to 30 seconds) loss of consciousness without loss of postural tone, are associated with a characteristic three-per-second spike-and-wave abnormality on EEG. Complex partial seizures (which usually have a temporal lobe origin), in contrast, can also be associated with impaired awareness, but the EEG usually shows focal temporal lobe spikes or appears normal because the aberrant and relatively deep temporal lobe discharges cannot be detected with scalp electrodes.
Infectious, toxic, and metabolic disorders affecting the nervous system can be accompanied by characteristic EEG abnormalities. For example, in herpes simplex encephalitis, the EEG displays periodic high-voltage sharp waves over the temporal lobes at regular three-per-second intervals. In Creutzfeldt–Jakob disease (also termed subacute spongiform encephalopathy), the EEG usually shows a pattern of burst suppression characterized by stereotyped, high-voltage slow and sharp wave complexes superimposed on a relatively flat background. In hepatic encephalopathy, bilaterally synchronous triphasic waves are often present.
Evoked Potentials
Whereas the EEG displays ongoing or spontaneous electrical activity, evoked potential recordings permit the measurement of activity in cortical sensory areas and subcortical relay nuclei in response to stimulation of various sensory pathways. Because the electrical signals are small, computerized averaging methods are used to extract the time-locked neural signals evoked by a large number of identical stimuli. The latency, amplitude, and waveform of the evoked potential provide information about impulse conduction along the pathway, or group of neurons, under study, and thus about the functional integrity of the pathway.
Visual evoked potentials (VEPs) are usually elicited by having the patient fixate on a target and flashing a reversing checkerboard pattern on a screen centered around the target. The VEPs recorded in this manner are sometimes called pattern-shift
Related posts:


Stay updated, free articles. Join our Telegram channel

Full access? Get Clinical Tree


