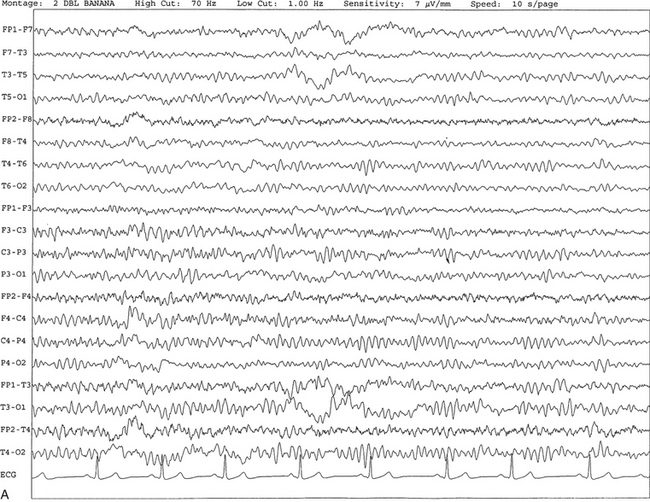
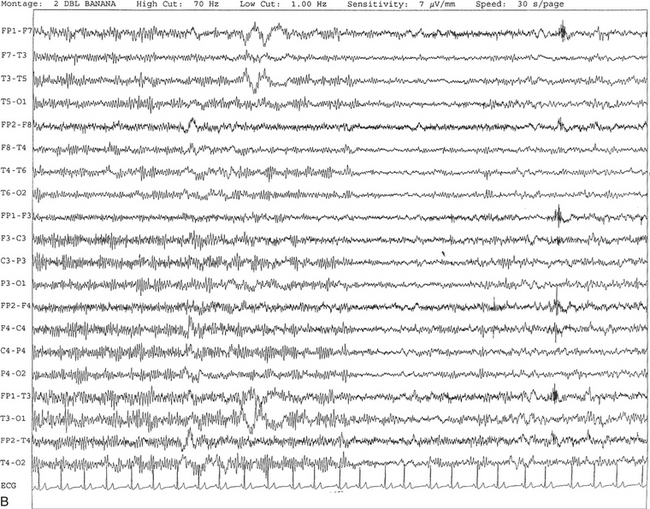
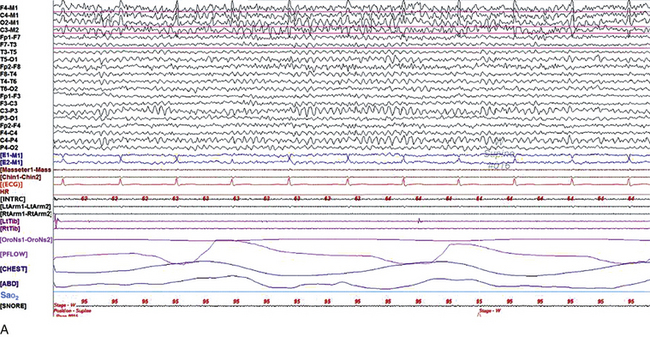
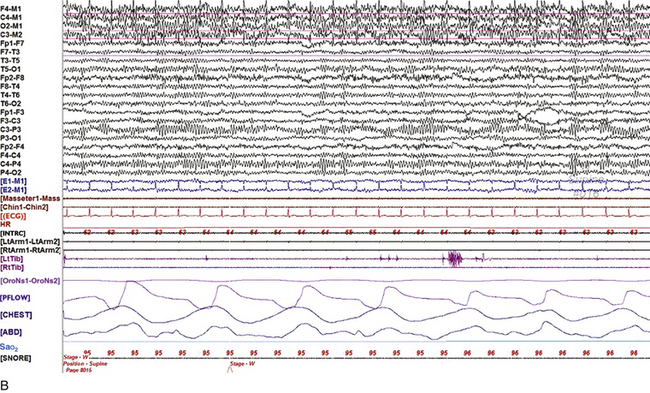
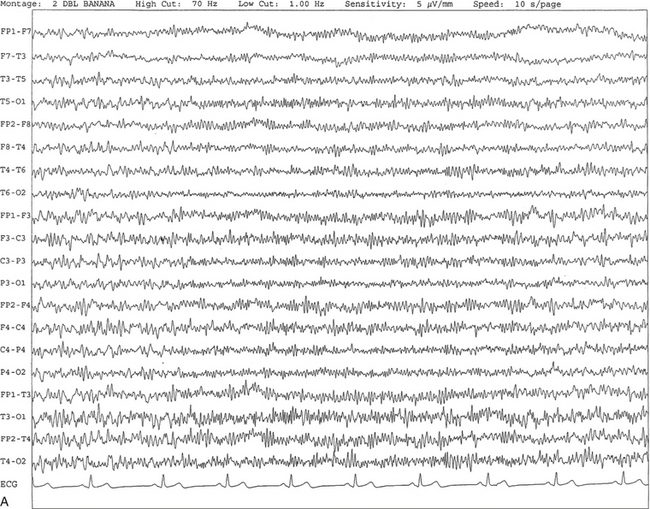
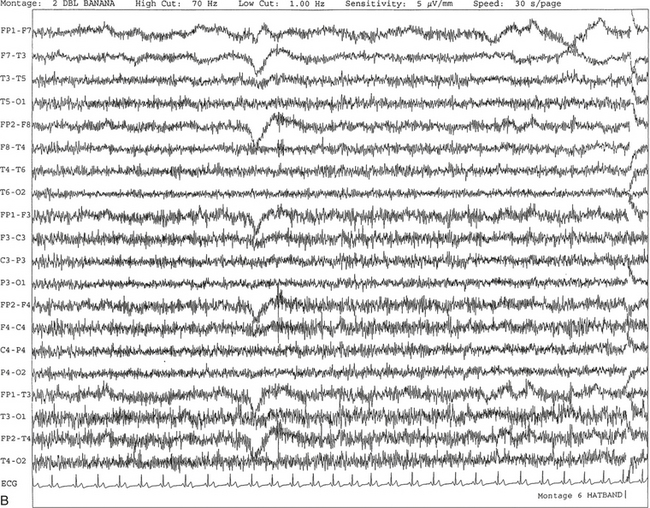
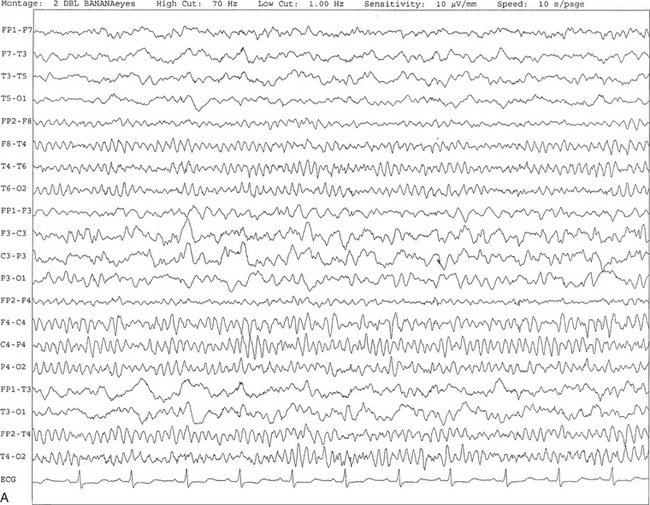
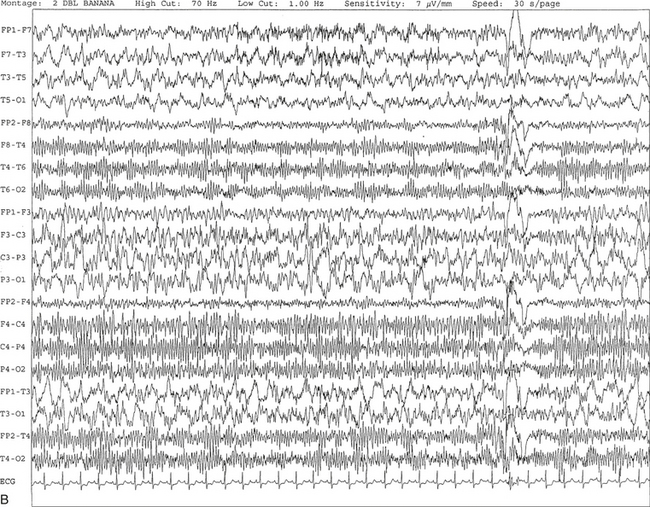
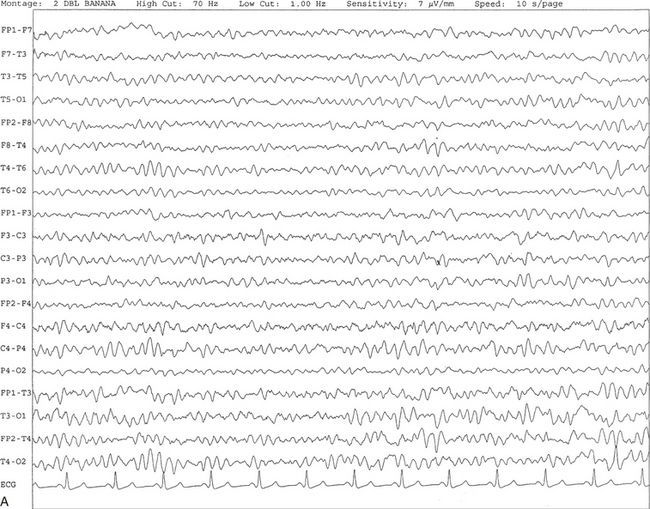
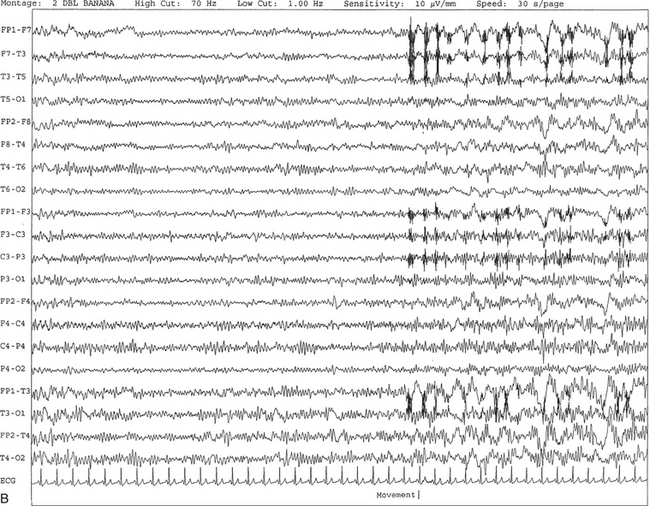
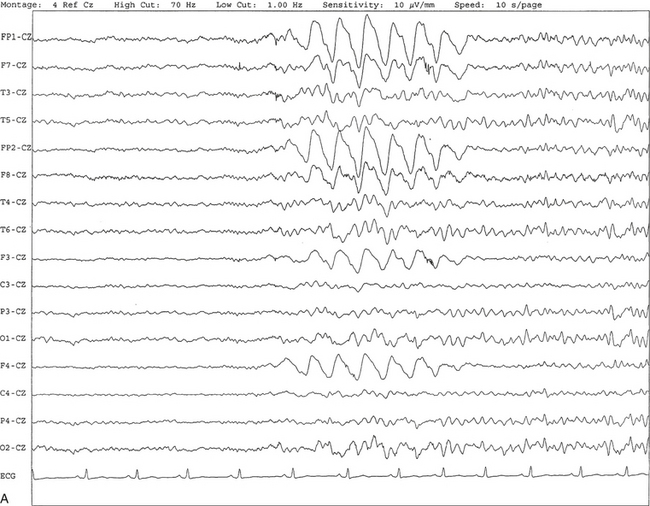
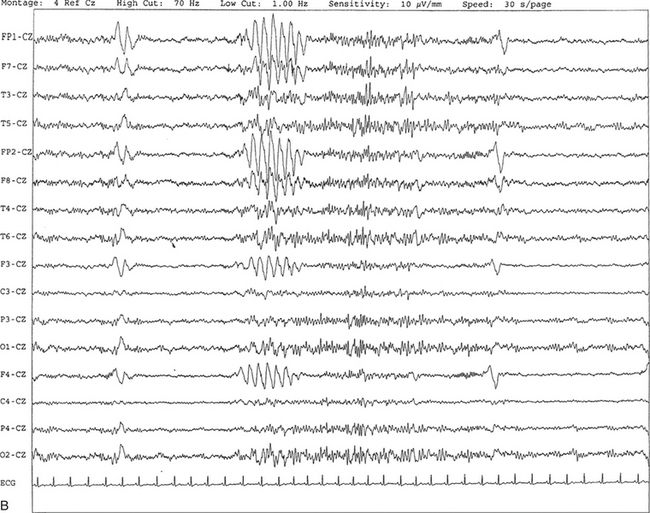
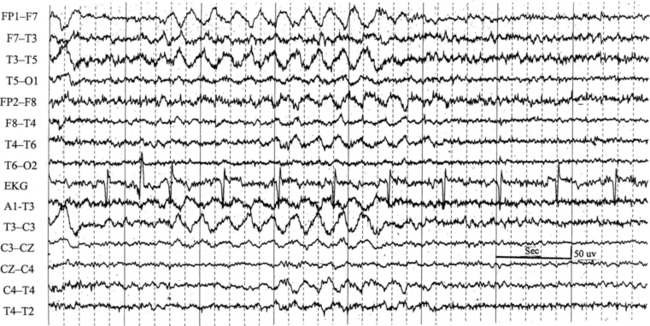
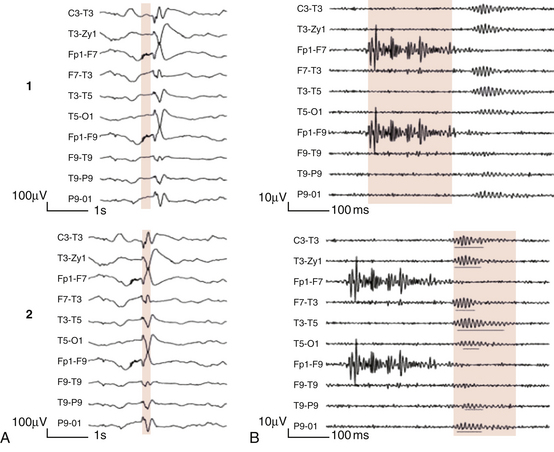
Chapter 2 The placement of the electrodes is determined by the 10-20 electrode placement system that is recommended by the International Federation of Societies for EEG and Clinical Neurophysiology and was published by Jasper in 1958. The 10-20 system is based on definable anatomical landmarks (Fig. 3.1). The system consists of letters denoting the parts of the brain underneath the area of the scalp and numbers denoting specific locations. The odd numbers refer to the left side of the head, and the even numbers refer to the right side. The technician should be familiar with the measurement technique for placement of the electrodes according to the 10-20 international system. Important landmarks for measuring include the inion, the nasion, and the right and left preauricular points. The distance from the nasion to inion along the midline through the vertex should be measured. FPz in the midline is 10% above the nasion of the total distance between the inion and nasion. The electrodes marked FP1 and FP2 are located laterally 10% above the nasion of the total distance between the inion and nasion measured along the temporal regions through the preauricular points. Oz denotes an electrode placed at a distance of 10% above the inion of the total distance between the nasion and inion. T3 and T4 electrodes are placed in a location 10% above the preauricular points of the total distance between the two preauricular points. The rest of the electrodes are located at a distance of 20% measured from inion to nasion anteroposteriorly or laterally through the ears as well as transversely between the ears. The montage refers to an arrangement of two electrodes (derivations). Both bipolar montage (connection of the electrodes between two relatively active sites over the scalp) and referential montage (connection of the electrodes between an active and relatively inactive site, e.g., M1, M2, Cz, Pz; see Fig. 2.1) are recommended. The nomenclature was recently changed to rename T3, T4, T5, and T6 to T7, T8, P7, and P8, respectively, in a modified 10-20 electrode placement system. FIGURE 2.1 A, A 10-second epoch from the polysomnogram of a 32-year-old man referred to the sleep laboratory for possible obstructive sleep apnea. He has a history of epilepsy, hence an extended electroencephalogram (EEG) (“seizure”) montage was requested. Normal awake EEG pattern characterized by symmetrical, sinusoidal posterior dominant alpha rhythm at 9 to 10 Hz is noted. The top four channels are referential channels connected to the left mastoid. The next 16 electrodes are bipolar channels arranged in a double banana montage as per the international 10-20 electrode placement system. B, Same subject data as in A viewed at a 30-second epoch. E1-M1 and E2-M1, Electro-oculogram (EOG) channels; Masseter1-Masseter2,Chin1-Chin2, masseter and submental electromyogram (EMG); ECG; electrocardiogram; HR, heart rate; INTRC, intercostal EMG; LtArm1-LtArm2, RtArm1-RtArm2, left and right biceps EMG; LtTib, RtTib, left and right tibialis anterior EMG; OroNs1-OroNs2 oronasal airflow; PFLOW, nasal pressure transducer; CHEST and ABD, effort belts; Sao2, arterial oxygen saturation by finger oximetry. Also included is a snore channel. ECG artifact is noted in the referential leads and EOG leads. The 2007 American Academy of Sleep Medicine manual recommends three channels; this results in significant limitations (see Chapter 1). Most importantly, such a limited montage would result in the inability to capture focal epileptiform activity arising from the temporal lobes, the most common location for such discharges, as well as missing focal slowing from the hemisphere not being recorded. In our own laboratory we use between four and eight EEG channels, including temporal leads from both hemispheres (see Table 1.2); this increases the yield of capturing focal or diffuse slow waves or epileptiform activities over recording with two to four channels. Many patients are referred to the sleep laboratory with a diagnosis of possible nocturnal seizures. In these cases an extended EEG montage (Fig. 2.1; see Table 1.3), covering the bilateral temporal and parasagittal regions and including both bipolar and referential channels, is recommended. A full complement of electrodes and special electrode placements (e.g., Tl and T2 electrodes) should be used. Simultaneous video recording (video-PSG study) for correlation of EEG activities with the actual behavior of the patient is crucial. In computerized PSG recordings (digital PSG recordings), which are currently performed in most laboratories, it is easy to change the recording speed from the standard 10 mm/sec of the usual sleep recording to 30 mm/sec of the standard EEG recording for proper identification of the epileptiform discharges. The dominant rhythm in adults during wakefulness is the alpha rhythm, consisting of 8 to 13 Hz activity distributed synchronously and symmetrically over the parietooccipital regions (see Fig. 2.1). The frequency of the rhythm between the two hemispheres should not vary by more than 1 Hz, and the amplitude should not vary by more than 50%. This alpha rhythm is best seen during quiet wakefulness with eyes closed and is significantly attenuated by eye opening or mental concentration. A small percentage of normal adults show no alpha rhythm, and their EEG is characterized by a dominant rhythm of low-amplitude EEG in the beta frequencies (greater than 13 Hz) with amplitudes varying between 10 and 25 μV (Fig. 2.2). In most adults the beta rhythms are seen predominately in the frontal and central regions intermixed with the posterior alpha rhythms. FIGURE 2.2 A, Normal awake electroencephalographic (EEG) pattern characterized by diffuse low-voltage beta (greater than 13 Hz) rhythm in a 23-year-old man at a conventional EEG paper speed of 10 seconds per page. B, Same subject data as in A viewed at a 30-second epoch. There are characteristic changes in the background EEG rhythms as an individual progresses through the three stages of non–rapid eye movement (NREM) sleep and the tonic and phasic stages of rapid eye movement (REM) sleep. The various characteristics during different sleep stages are described in detail in Chapter 3. EEG in older adult subjects shows a progressive slowing of the alpha frequency during wakefulness and diminution of alpha blocking and photic driving responses. Focal temporal slow waves, particularly in the left temporal region, often called benign temporal delta transients (Fig. 2.3) of older adults, are seen in many apparently normal older adults, and are sometimes associated with sharp transients. Transient bursts of anteriorly dominant rhythmical delta waves may also be seen in some older adults in the early stage of sleep. Other changes in older adults consist of sleep fragmentation with frequent awakenings, including early morning awakening and multiple sleep-stage shifts. Another important finding in the sleep EEG of older adults is the reduction in amplitude of the slow waves. Because of this, many slow waves do not meet American Academy of Sleep Medicine scoring guidelines; the percentage of slow-wave sleep is therefore often reduced in these subjects. Abnormal EEG patterns consist of focal or diffuse slow waves and epileptiform discharges. The importance of multiple-channel EEG recordings (see Table 1.3) is to document this focal (Fig. 2.4) or diffuse (Figs. 2.5 and 2.6) slowing and epileptiform discharges (see later). FIGURE 2.4 A, A 10-second electroencephalogram epoch shows focal slowing at 3 to 6 Hz over the left temporoparietal region in an 85-year-old man with history of a stroke. Normal alpha rhythm at 10 to 11 Hz is noted on the right side. B, Same subject data as in A viewed at a 30-second epoch. FIGURE 2.5 A, A 10-second electroencephalogram epoch shows mild diffuse slowing of the background rhythm, dominated by 6- to 7-Hz theta activity in an 80-year-old woman with history of hypertension, diabetes mellitus, and bacteremia. B, Same subject data as in A viewed at a 30-second epoch. In addition, brief bursts of rhythmical muscle artifact are noted on the left side toward the end of the epoch. Mild diffuse slowing of the background rhythm may be missed during conventional polysomnography scoring. The clue is that the epoch looks like an awake recording without the characteristic alpha rhythm. This necessitates viewing the segment as a 10-second epoch. FIGURE 2.6 A, A 27-year-old man with a 3-week history of sudden severe headaches diagnosed as pituitary adenoma. A 10-second electroencephalogram epoch shows evidence of a brief burst of frontal intermittent rhythmical delta activity (FIRDA), synchronously recorded over both hemispheres. FIRDA was originally believed to arise from a deep midline pathological condition, which is demonstrated in this case. However, FIRDA is now believed to be anatomically nonlocalizing and indicates diffuse cerebral dysfunction secondary to metabolic or structural involvement. B, Same subject data as in A viewed at a 30-second epoch. Epilepsy is a clinical diagnosis; therefore history must be obtained from patients, relatives, witnesses, or medical personnel if a patient is referred to the sleep laboratory with a suspected diagnosis of nocturnal seizures. The history must include descriptions of ictal, preictal, postictal, and interictal phenomena, family and drug histories, as well as history of any significant medical or surgical illnesses that might be responsible for triggering the seizures. Physical examination must be conducted to find any evidence of neurological or other medical disorders before PSG recording in the laboratory. EEG is the single most important diagnostic laboratory test for patients with suspected seizure disorders. Certain characteristic EEG waveforms correlate with a high percentage of patients with clinical seizures and therefore can be considered of potentially epileptogenic significance. These epileptiform patterns consist of spikes, sharp waves, spike and waves, sharp and slow-wave complexes, as well as evolving pattern of rhythmical focal activities, particularly in neonatal seizures. In addition, a pattern that correlates highly with complex partial seizure is temporal intermittent rhythmical delta activity (TIRDA) (Fig. 2.7). Another pattern that is considered a marker of the seizure-onset zone is interictal scalp high-frequency oscillations (HFOs) consisting of gamma frequency activity (30-80 Hz), ripples (80-250 Hz), and fast ripples (250-1000 Hz), recorded noninvasively using amplifiers with appropriate filter settings (Fig. 2.8). Therefore recording HFOs may help map epileptogenic zones. FIGURE 2.7 Ten-second electroencephalogram epoch shows left temporal intermittent rhythmical delta activity (TIRDA) during wakefulness in a 30-year-old woman with partial complex seizures. FIGURE 2.8 1, Short electromyographic bursts, which could be mistaken for ripples but are actually artifactual oscillations. 2, Ripples co-occurring with sharp wave. A, Raw electroencephalogram (EEG). B, EEG filtered with high-pass filter of 80 Hz. Shaded section in A is expanded in time and amplitude in B. Note that for this figure the calibration is different in the left and right parts of the figure but is the same for the top and bottom parts. Ripple oscillations are underlined. The waveform morphological appearance of nonartifactual fast oscillations is more rhythmical and regular in amplitude and frequency than that of artifactual oscillations. (From Andrade-Valencia LP, Dubeau F, Mari F, et al. Interictal scalp fast oscillations as a marker of the seizure onset zone. Neurology. 2011;77:524. Used with permission.)
Electroencephalography for the Sleep Specialist
Method of Electroencephalographic Recording
Normal Waking and Sleep Electroencephalographic Rhythms in Adults
Abnormal Electroencephalographic Patterns
Recognition of Epileptiform Patterns in the Polysomnographic Tracing
Electroencephalographic Signs of Epilepsy
![]()
Stay updated, free articles. Join our Telegram channel

Full access? Get Clinical Tree


