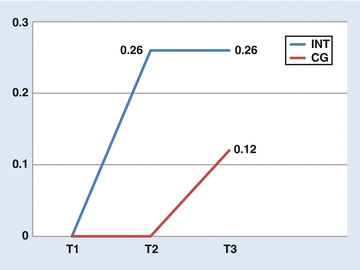
Fig. 5.1
Effect sizes (ES) for the area of neurocognition for the INT group and the control group (CG). Neurocognition: attention, speed of information processing, verbal & visual memory, working memory, reasoning & problem solving. T1 baseline, T2 after therapy/after 17 weeks, T3 after 37 weeks

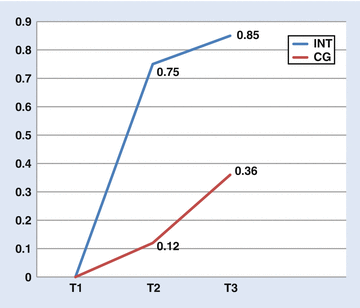
Fig. 5.2
Effect sizes (ES) for the area of social cognition for the INT group and the control group (CG). Social cognition: emotional perception, social schemata, attribution style. T1 baseline, T2 after therapy/after 17 weeks, T3 after 37 weeks

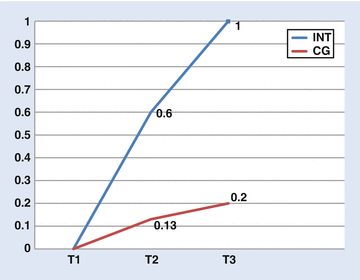
Fig. 5.3
Effect sizes (ES) for the area of negative symptoms for the INT group and the control group (CG). T1 baseline, T2 after therapy/after 17 weeks, T3 after 37 weeks

Fig. 5.4


Effect sizes (ES) for the level of psychosocial functioning for the INT group and the control group (CG). T1 baseline, T2 after therapy/after 17 weeks, T3 after 37 weeks
Stay updated, free articles. Join our Telegram channel

Full access? Get Clinical Tree


