The use of body mass index (BMI) has been proposed by the National Institutes of Health,a the Centers for Disease Control and Prevention,b and the World Health Organizationc as a method for defining overweight and obesity. This classification system is based on epidemiologic data indicating that the risk of morbidity and premature mortality usually begins to increase at a BMI of 25–29.9 kg/m2, and increases further at a BMI of 30 kg/m2. Other factors, such as waist circumference, weight gain since young adulthood, fitness level, and ethnic or racial background, also influence the relationship between BMI and overall disease risk
| Classification | BMI (kg/m2) | Risk |
| Underweight | <18.5 | Increased |
| Normal | 18.5–24.9 | Normal |
| Overweight | 25.0–29.9 | Increased |
| Obese Class I | 30.0–34.9 | High |
| Obese Class II | 35.0–39.9 | Very high |
| Obese Class III | ≥40 | Extremely high |
a National Institutes of Health and National Heart, Lung, and Blood Institute. Clinical guidelines on the identification, evaluation, and treatment of overweight and obesity in adults—the evidence report. Obes Res 1998; 6 (Suppl 2): 1S-209S.
b Centers for Disease Control and Prevention. Overweight and Obesity: Defining Overweight and Obesity. www.cdc.gov/nccdphp/dnpa/obesity/defining.htm (accessed June 28, 2008).
c World Health Organization. Obesity: Preventing and Managing the Global Epidemic. Report of a WHO Consultation on Obesity. Geneva: World Health Organization, Technical Report Series 2000; 894: 1–253.
An increase in central adiposity—the accumulation of body fat in the abdominal area—is associated with greater risk for diabetes and cardiovascular disease (8–9) and also for cancers of the colorectum, pancreas, breast, and endometrium (10). To monitor the distribution of fat in the body for the purpose of assessing this risk, the circumference of the waist is measured. Waist circumference is unrelated to height (11) but correlates well with BMI (12) and total body fat (13). In some studies, the ratio of the circumference of the waist to the circumference of the hips (commonly referred to as the waist-to-hip ratio or WHR) is used for this purpose. Table 1-2 shows the thresholds for waist size and WHR suggested by both NIH (5) and WHO (7) for determining increased health risk associated with central adiposity.
Table 1-2 Waist Circumference and/or Waist-to-Hip Ratio (WHR) Associated with Increased Risk
| Men: Waist circumference >102 cm (>40 inches) or WHR ≥ 1.0 |
| Women: Waist circumference >88 cm (>35 inches) or WHR ≥ 0.8 |
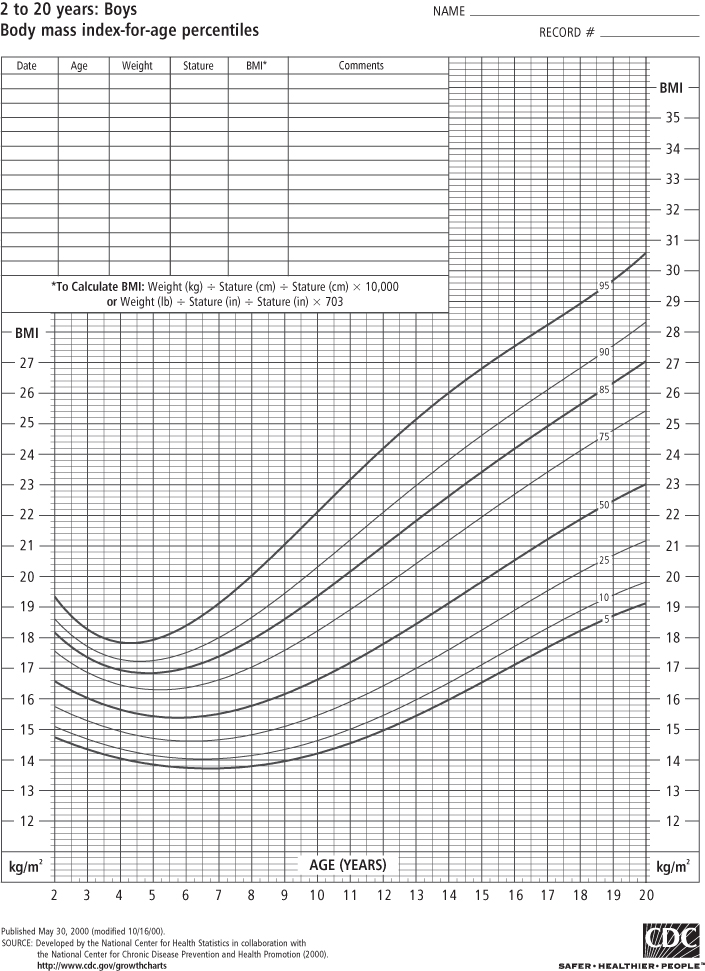
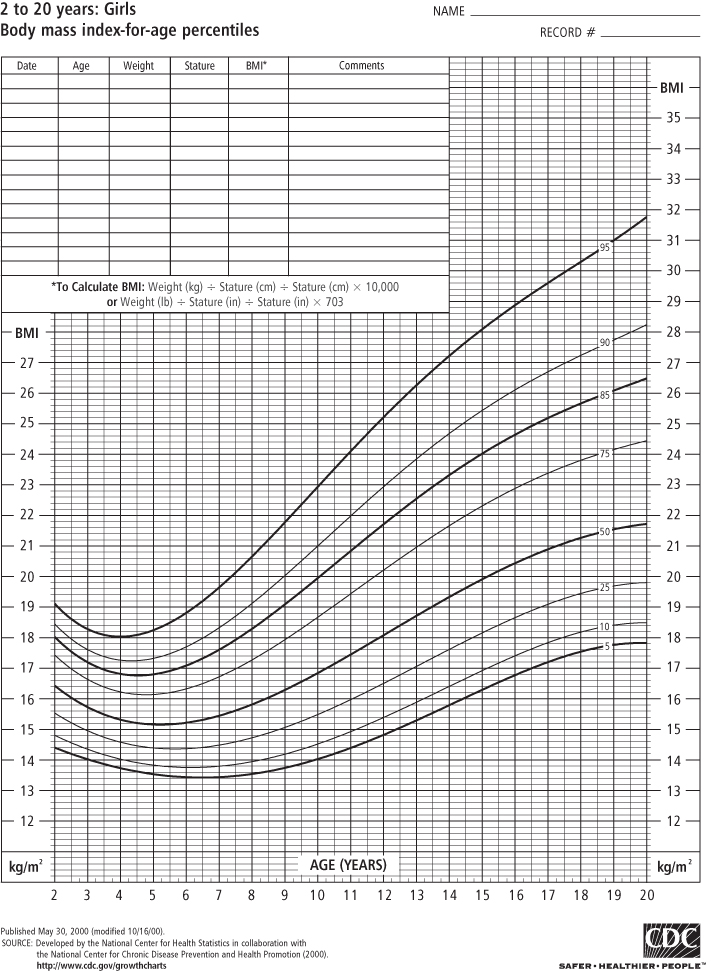
Classifying obesity in children is more difficult for a number of reasons. Because children are growing, normal values of BMI differ as the child ages and matures. Although the pattern differs somewhat by sex, BMI values rise steeply during infancy, decline during the pre-school years, and then rise again in childhood and adolescence until the child reaches adulthood. For this reason, BMI growth charts represent the distribution of normal BMI values for children of a specific age and sex. To use the BMI growth chart, one must know the child’s age (to the closest month) in addition to height and weight at that age.
In the past, the most widely used growth reference was developed by the US National Center for Health Statistics (NCHS) of the Centers for Disease Control and Prevention (CDC), which used tables of weight-for-height in children aged 2 years and more, and weight-for-length in children from birth to 2 years (in infants, recumbent length is measured in lieu of standing height). In 2000, the CDC published new BMI-for-age tables based on data from five nationally representative surveys conducted in the US from 1963 to 1994, with the exception that all weight data from children ages 6 and older in 1988–94 were excluded because of increases in body weight observed over that period (3). These sex-specific BMI growth charts are used for children aged 2–20 years (see Figures 1-1 and 1-2) and replace the 1977 NCHS weight-for-height charts.
Box 1-1 Definitions of childhood overweight, obesity, extreme obesity
BMI-for-age is used to identify children and adolescents at the upper end of the distribution. Those who are “obese” have a sex- and age-specific BMI that is ≥95th percentile. Prior to 2005, these children were referred to as “overweight”; the term “obese” was not used. The sex- and age-specific BMI ≥ 85th and <95th percentile refers now to children who are “overweight” but previously those children were designated as “at risk for overweight” (14–15). The Institute of Medicine (IOM) convened a group of experts who recommended that this terminology be changed to categorize children at or above the 95th percentile as “obese” and children between the 85th and 95th percentiles as “overweight” (16) and in 2007 experts convened by the American Medical Association and other groups recommended that this new terminology be widely accepted and used for the assessment and treatment of children (17). Extreme obesity in children has been identified as ≥99th percentile (18) although it has been pointed out that the highest percentile available on the CDC 2000 growth charts is the 97th percentile (19). An alternative definition that may be better accepted is to consider any child ≥120% of the 95th percentile of BMI as extremely obese (20). One study of more than 710,000 children in southern California found that 6.4% met the latter definition of extreme obesity (21). It has been pointed out that if this prevalence holds for US children nationally, extreme pediatric obesity prevalence exceeds that of extreme adult obesity prevalence (22), which is currently estimated at 5.7% (23).
In 2006, the WHO published a set of growth charts that were based on measurements of healthy, breastfed children from around the world (24). The WHO charts are intended to offer a standard of physiologic growth and not a descriptive reference (3). In many studies of children, “overweight” and/or “obesity” are often defined using standard deviation (SD) scores, or z-scores, which the reader may encounter. In this system, a child with a BMI z-score of +2 is 2 standard deviations above the mean BMI for the reference population in which BMI values are normally distributed (25). BMI z-scores are useful in a school or community setting to evaluate progress when programs are implemented to prevent the development of childhood obesity.
The CDC growth charts and the WHO standards are intended for clinical use in monitoring the growth of children over time. An historical perspective on the growth pattern of a child through repeated (e.g., yearly or six-monthly) measurements and plotting of BMI on a growth chart can be used to identify a growth trajectory that is heading toward overweight or underweight (failure to thrive). The use of either percentiles or z-scores to categorize a child as overweight or obese is a secondary purpose (26) that can be useful from an epidemiological standpoint, when the goal is to estimate prevalence. These scores can also be useful to screen groups of children to identify those who might be obese and refer them for a more in-depth assessment by a qualified health professional. An analysis of 1999–2004 NHANES (see below) data by Flegal and colleagues in more than 8,800 8–19 year olds (51% boys) showed that most children at or above the 95th percentile indeed have a high adiposity as measured using DXA scans (27). This study showed that results varied by race or ethnicity, especially in the overweight category (85th–95th percentile). Since there are no widely accepted levels of body fatness that define high adiposity for children, the development of body fat standards in children is an important research need. Flegal (27) illustrate the need to take race or ethnicity into account in the development of such standards.
Currently, there are no agreed definitions of obesity or body fat standards among infants and children younger than 2 years old. For this age group, weight-for-length percentiles from the 2000 CDC growth charts are used to evaluate growth. To qualify a child for enrollment in the Special Supplemental Nutrition Program for Women, Infants, and Children (WIC), the 95th percentile on the 2000 CDC sex-specific BMI charts is sometimes used to establish program eligibility for children age 2 or older. Excessively rapid growth in children 0–2 years of age cannot be used as an eligibility criterion to qualify a child for enrollment in WIC, despite concerns that this is a “critical period” of development, and rapid weight gain during this time may predispose a child to lifelong obesity (28). A pressing research need is to clearly define infant obesity, elucidate predisposing factors, and develop effective interventions (see Chapter 25 and 27). Preliminary research suggests that the prevalence of obesity in infants may be as high as 16% and is a predictor of obesity at 2 years of age (29) when growth can be assessed using the BMI growth charts.
Surveying Obesity Prevalence
It is usually impractical to gather data from medical records or vital statistics to estimate the prevalence of obesity. Surveys or studies of large populations are useful for this purpose.
United States National Center for Health Statistics
National-level data for the US (i.e., data that are representative of the nation taken as a whole) are gathered by the National Center for Health Statistics (NCHS) of the Centers for Disease Control and Prevention (CDC) from measured data obtained through NHANES (30). NHANES is designed to monitor the health and nutritional status of the civilian, non-institutionalized population, aged 2 years and older. NHANES (31) includes standardized health examinations in a mobile examination center on a representative cross-sectional sample of the US population.
Originally conducted every decade or so since it was founded in the early 1960s, starting in 1999, NHANES has been conducted on a continuous basis, surveying approximately 5,000 people each year (32). NHANES is the primary source for national data on overweight and obesity in adults, adolescents, and children. Because of the expense involved, NCHS also collects self-reported data obtained by telephone through the Behavioral Risk Factor Surveillance System (BRFSS) (33). Although they underestimate prevalence, these data are useful for determining state-by-state prevalence and changes in prevalence in a state over time. Because it is more reliable, wherever possible we will be discussing primarily NHANES data based on measured height and weight.
Prevalence in Adults
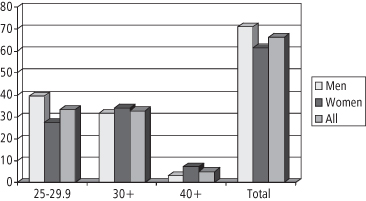
In adults, a BMI of 30 or higher is a widely accepted definition of obesity and has been used in the US for decades. A BMI of 30 corresponds roughly to 13.5 kg of excess weight. Data from NHANES 2007–8 show that the prevalence of obesity is 34% among adults—approximately 80 million people (34). Whereas the increase in obesity has occurred in all subgroups in recent decades, obesity is more common in women (35.5%) than in men (32.2%) (34). As shown in Figure 1-3, the prevalence of extreme obesity (BMI ≥ 40) in 2003–4 was 2.8% in men and 6.9% in women (35). Interestingly, the rate of increase has slowed such that there was no significant increase in the prevalence of obesity between NHANES 1999–2006 and NHANES 2007–8 for adult men or women (34). However, the prevalence of severe obesity (approximately 45.35 kg excess weight) continues to escalate (36).
Figure 1-3 Percent overweight, obese, extremely obese, by BMI (U.S. adults ages 20–74, NHANES 2003–2004)
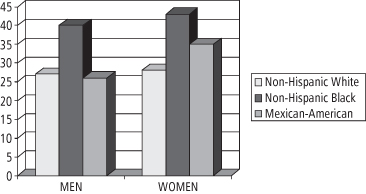
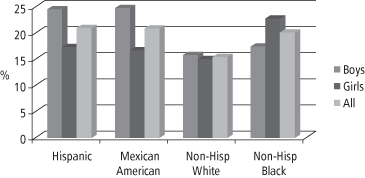
In 2005–6, African Americans, Mexican Americans, persons with low income, adolescents (12–19 years), and adults 60 years or older were over-sampled in NHANES. Large disparities in obesity prevalence in different ethnic groups were documented among adult women, with the highest prevalence among Blacks and Mexican Americans as compared to Whites (34). For women aged 40–59 years, obesity prevalence is 53% among non-Hispanic Blacks, 51% among Mexican Americans, and 39% among Whites (34). For adults of childbearing age (20–39 years), the differences among the various ethnic groups are shown in Figure 1-4. These data are of particular concern given the growing number of studies showing an association between parental, especially maternal, obesity and the development of obesity in the offspring (37). This association will be discussed further in Chapter 10.
Figure 1-4 Percent obese among 20- to 39-year-old adults, by ethnicity (U.S. adults, NHANES 2005–2006)
Prevalence in Children and Adolescents
Through NHANES, the National Center for Health Statistics (38) has systematically collected data on obesity in children and adolescents since 1963 (see Figure 1-5).
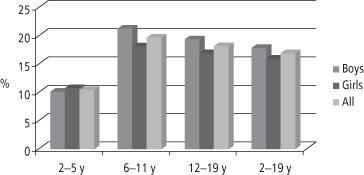
The rate of increase in obesity prevalence among US children has escalated sharply since the 1970s, prompting the Congress in 2002 to mandate that certain federal agencies fund the Institute of Medicine (IOM) to develop an action plan to prevent childhood obesity (39). The resulting report was published in 2005 and highlighted the rapid increase in childhood obesity prevalence, the medical urgency of the problem, and the usefulness of NHANES data in documenting important details of the epidemic, such as the disparities in obesity prevalence among non-Hispanic Whites, non-Hispanic Blacks, and Mexican Americans (39). Based on NHANES data for the period 2003–4, the prevalence of obesity for US children aged 2–19 is 17.1% (3). Figure 1-6 summarizes NHANES data for the period 2007–2008 and demonstrates that prevalence differs by ethnicity: for all White children it remains at 15%, but for all Black children it is 20% and for all Mexican American and Hispanic children it is 21% (23).
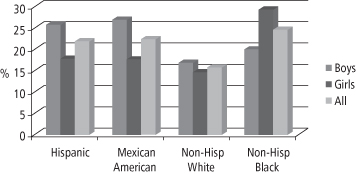
There is evidence that for obese adolescents the chance of progressing to obesity in young adulthood ranges from 70% to 80% (37). Thus, the high prevalence rates among adolescents (shown in Figure 1-7), especially among non-Hispanic Blacks and Mexican Americans, is of particular concern (23).
The CDC has identified the development of innovative childhood obesity practices as an important priority (40) since there are now more than 12 million obese children in the US, with several million of those severely obese (41). Childhood obesity treatment and prevention are discussed further in Chapters 25 and 26–27, respectively.
BRFSS and YRBS
To ensure that NHANES is nationally representative, it is not necessary for the mobile examination centers to enter all states in the US; consequently, NHANES is not useful for collecting state data. To address this gap in the data, as mentioned earlier, the Behavioral Risk Factor Surveillance System (BRFSS; see www.cdc.gov/brfss), an ongoing, state-based, random-digit-dialed telephone survey of the non-institutionalized civilian population aged > 18 years, is used. BRFSS data allow the assessment of the prevalence of obesity among adults categorized by state and demographic characteristics, and are particularly useful in guiding policy and program development at the state and local level. Among youth, an analogous telephone survey system, the Youth Risk Behavior Survey (YRBS; see www.cdc.gov/HealthyYouth/yrbs/index.htm), permits the collection of data on health-related behaviors, as well as on self-reported height and weight.
Global Prevalence
Although few countries have nutrition and health monitoring systems equivalent to NHANES or BRFSS for assessing obesity prevalence, it is clear that the increase in obesity is occurring not only in the US, but throughout the world. The WHO has declared obesity as one of the world’s top 10 risk conditions and one of the top five in developed nations (42). There are areas of the world, such as the South Pacific island countries of Tonga and Nauru, where there has been such an enormous increase in obesity that the majority of the adult population is now obese according to the WHO (43–44; see also Table 1-3). This is true also of some sub-populations in the developed world, such as the Pima Indians in Arizona, where 70% of the population is obese (45). WHO data from Latin America and even Africa show a growth of obesity in these regions as well (44; and see Table 1-3).
Table 1-3 National Overweight and Obesity Prevalence Rates in Adults in 66 Countries
*Female data only.
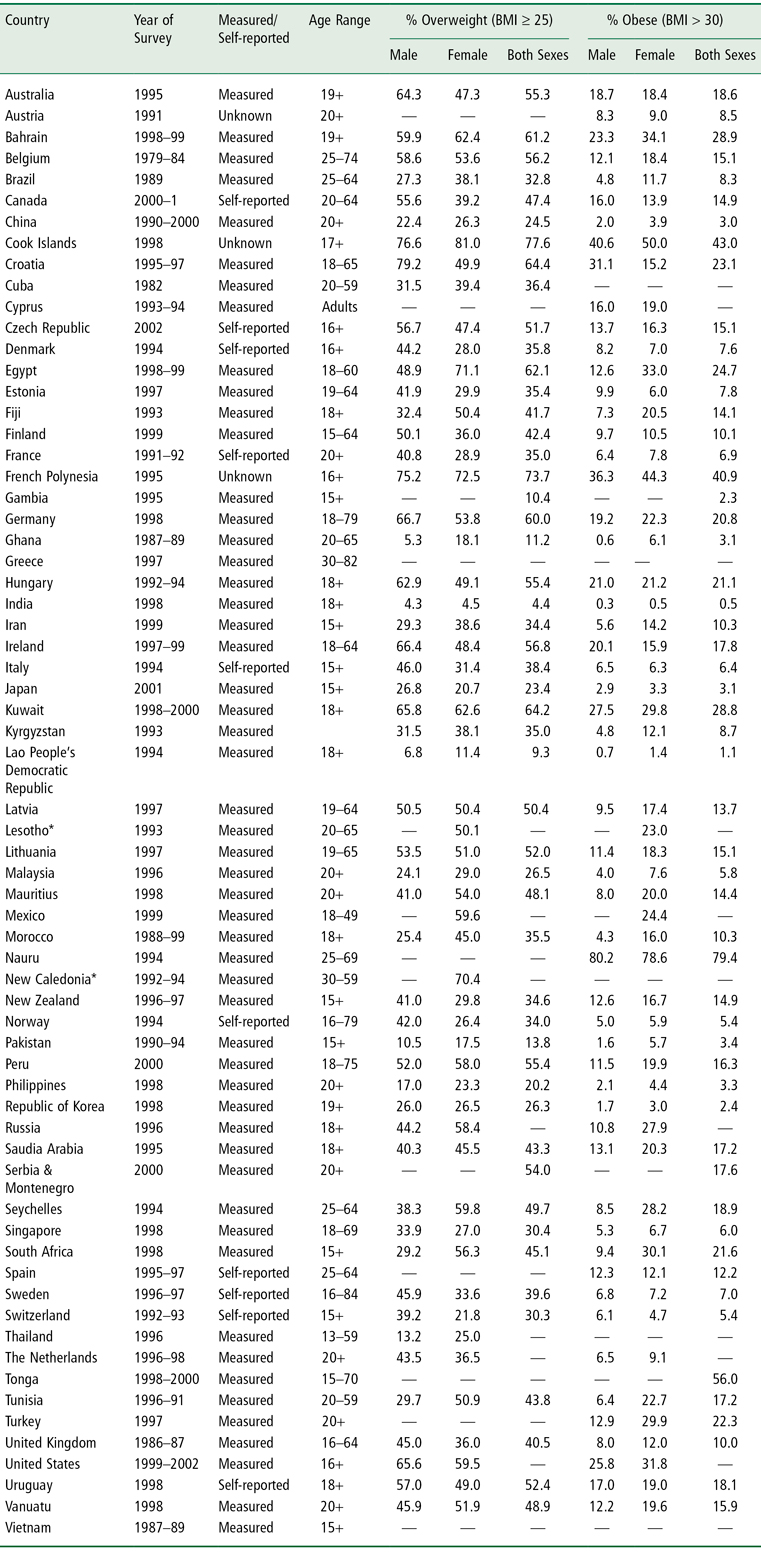
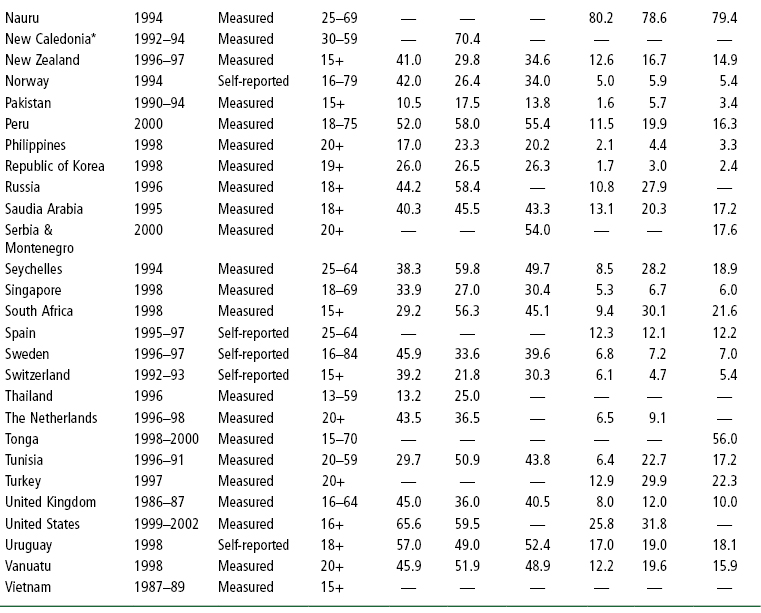
United Nations System Standing Committee on Nutrition. Overweight and Obesity: a new nutrition emergency? SCN News 29, Late 2004–Early 2005, Table 1: 7–8. www.unscn.org/layout/modules/resources/files/scnnews29.pdf (accessed August 18, 2010).
WHO global estimations of prevalence indicate that approximately 1.6 billion adults (aged 15+) were overweight and at least 400 million were obese in 2005 (46). In addition, at least 20 million children under the age of 5 years were obese as of 2005 (46). An estimated 12.5 million children in the US are obese (40), with 2.8 million of those children categorized as severely obese (41). The WHO further projects that by 2015 approximately 2.3 billion adults will be overweight and more than 700 million will be obese (46). Table 1-3 lists overweight and obesity prevalence figures for adults in 66 countries. The WHO obesity prevalence data shown in this table for China (3.0%), the world’s most populous country, are likely to be low since a 2008 estimate of obesity prevalence based on BMI reported that 22.8% of Chinese adults are overweight and 7.1% are obese (47). The epidemic of overweight or obesity is affecting children and even infants (48). Indeed, a 2007–8 national estimate of type 2 diabetes prevalence in China found that nearly 10% of the adult population (92.4 million people) are frankly diabetic and another 16% (148.2 million people) have pre-diabetes (48).
Evidence from the Caribbean (Barbados, Cuba, Jamaica, and Saint Lucia) indicates that obesity is a growing problem in this region (7). The growth in obesity prevalence is accompanied by a higher prevalence of diabetes, cardiovascular disease, and hypertension (7). Experience in Cuba over the past two decades is illustrative of the profound impact of obesity on health. In contrast to many developing countries, Cuba has an extensive healthcare system and a well-developed system for tracking vital events (49). Consequently, it is known with certainty, for example, that life expectancy in Cuba is 77 years and cardiovascular disease is the leading cause of death (49–50).
Since the 1960s, Cuba has been subjected to an economic embargo by the US. In 1989, after losing the Soviet Union as an important trading partner, Cuba entered a prolonged crisis, which is referred to as the “Special Period” (49–50). The crisis deepened from 1989 to 1995 with economic output in 1995 only half the level in 1990. Foreign trade contracted by 80%, with reduced imports, limited fuel availability, and a scarcity of many food items. Food was rationed and 40% reductions in per capita daily energy intake were documented (50) along with significant increases in walking and cycling as public transportation became unavailable (49). Complete economic recovery did not occur until 2000, so the Special Period lasted approximately a decade.
In 1993, as a consequence of an outbreak of neuropathy, nutritional studies documented that 27% of Cubans had lost 10% or more of their body weight over the previous 12 months and 43% experienced severe caloric restriction (49). This unfortunate natural experiment permitted researchers to measure the effects of this population-wide weight loss on mortality from cardiovascular disease and type 2 diabetes. The prevalence of obesity decreased from 11.9% to a low of 5.4% at the peak of Special Period. Physical activity—walking and cycling—increased, from 30% considered physically active before the crisis to a high of 70% considered physically active in 1995. This change was apparently sustained at 67%, as documented by national surveys in 2001 (49).
Substantial declines in mortality from coronary heart disease (a drop of 35%), type 2 diabetes (down 51%), and all-cause mortality (down 18%) were documented between 1995 and 2002, while rates of cancer mortality, which are not sensitive to obesity (see discussion below), remained relatively constant (49). The BMI distribution for the entire population shifted to the left: mean BMI decreased from 24.8 in 1991 to 23.3 in 1995, reflecting a 50% reduction in obesity prevalence (49).
It is likely that the Special Period is the first demonstration of sustained negative energy balance—with documented high levels of physical activity and weight loss that lasted 4–8 years—producing significant reductions in diabetes and cardiovascular disease mortality (49). There was a shift in diet composition in Cuba during the Special Period with carbohydrate intake increasing from 65% to 77% of calories as sugar cane and rice became the primary sources of energy (49). As the availability of animal products declined, fat intake decreased from 20% to 13% of calories and protein intake fell from 15% to 10% of calories—a diet composition considered diabetogenic by some authorities, yet accompanied by marked decreases in diabetes mortality (49).
There were many negative consequences of the Special Period: tuberculosis deaths increased by 48% (49); more elderly persons died, primarily of infections; the decline in infant mortality was interrupted for three years, and the incidence of low birth weight increased from 7.3% to 9.0% (49). An epidemic of optical and peripheral neuropathy attributed to vitamin and protein deficiencies affecting at least 50,000 people, was documented between 1992 and 1993 (49).
When the Special Period ended, the Cuban economy started to grow, productivity increased, energy and food availability increased, and public transportation improved. The nadir in mortality from type 2 diabetes and heart disease was reached in 2001 and mortality from these causes increased for the next four years. Like most countries, Cuba now faces the challenge to craft public health initiatives to stem this increase. The Special Period suggests the potential public health impact that could be achieved with a population intervention designed to maintain nutritional sufficiency while boosting physical activity and moderating calorie intake. With a current life expectancy of 78.6 years, Cuba’s health system, including its Rural Social Medical Service, emphasizes disease prevention (high vaccination rates and high proportion of births attended by skilled health workers) and primary healthcare (65% of physicians practice primary care medicine), achieving “developed-world health outcomes with a developing-world budget” (50). In contrast to the US, Cuba has been forced to rely more on education (community health literacy) than on medical supplies and sophisticated technologies to maintain a healthy population at a per capita cost of $355 (7.1% of total Gross Domestic Product) as compared to $6714 (15.3% of total GDP) in the US (50). As the economy stabilizes and obesity prevalence increases in Cuba, it will be interesting to see what strategies are used to stem the problem.
Consequences of Obesity and Overweight
The consequences of obesity cover a wide spectrum of social, medical, and economic domains (7). Obesity is associated with diminished health and psychosocial well-being, reduced socioeconomic prospects of affected individuals and populations, and lower economic productivity of the workforce. Obesity is a major contributor to the higher healthcare costs of businesses and insurance providers, as well as workers. It contributes to decreased longevity and increased disability, as well as increased reliance on surgical procedures and medical interventions to treat obesity or to manage the various comorbidities of obesity (7).
Health
There are dozens of health conditions that are associated with obesity either directly or indirectly (see Chapter 12). In the following sections, we discuss a selected few disease conditions that are highly prevalent and whose prevalence is increasing as a consequence of the growing epidemic of obesity.
Type 2 Diabetes
Among adults, the relationship between BMI and type 2 diabetes is perhaps stronger than it is for any other obesity comorbidity (3). It has been estimated that 64% of male and 77% of female cases of type 2 diabetes could be prevented if no one had a BMI above 24; or the reductions would be 44% and 33%, respectively, if no one had a BMI above 29 (51–52). The American Diabetes Association (53) estimates that about 19 million people in the US have type 2 diabetes, and another 54 million are “pre-diabetic,” which means that increasing weight gain in this latter population places them at extremely high risk for the development of frank diabetes. The mortality associated with diabetes is 73,000 people a year in the US, which makes it the fifth leading cause of death (53).
The Diabetes Prevention Program (DPP) targeted overweight pre-diabetic individuals and demonstrated that lifestyle change—weight loss, increased physical activity, and the adoption of a low-fat diet—outperformed a leading diabetes drug in preventing conversion from pre-diabetes to frank diabetes (54). The DPP was a remarkable demonstration of the value of lifestyle change in the prevention of diabetes in high-risk overweight individuals. Lifestyle change was protective against conversion to diabetes in 58% of the cases, whereas the drug prevented only one third of the cases (54). Similar findings from a Finnish study of individuals with impaired glucose tolerance were reported in 2001 (55). It is worth noting that data from the Diabetes Prevention Program Research Group demonstrate that of the lifestyle changes accomplished by the participants in the DPP, weight loss had the greatest effect in preventing diabetes (56).
Once diabetes is established, it is notoriously difficult to treat with lifestyle change, and adjunctive medical treatment is usually required. Observational studies have shown that bariatric surgery can be useful in bringing about complete remission of diabetes (57). A recent study examined the use of surgery in diabetic obese individuals with a BMI between 30 and 40 (58). This non-blinded, randomized controlled trial of weight loss induced by bariatric surgery vs. weight loss through lifestyle change was conducted in newly diagnosed diabetic patients. The results demonstrated significant weight loss (20.7% of initial body weight) with bariatric surgery and remission of the disease in 22 out of 30 patients (73%), which compared to remission in only 4 out of 30 patients (13%) in the lifestyle change group (58). The average weight loss in the lifestyle change group was only 1.7% of initial body weight, considerably less than that achieved in the DPP. This disappointing result may have been a consequence of inadequate programmatic support or the refractoriness to weight loss in patients once frank diabetes is established (58). Nonetheless, this study demonstrates the interesting and puzzling relationship between diabetes and obesity, which is the focus of intensive research efforts. The use of bariatric surgery for the treatment of obesity will be discussed in greater detail in Chapter 19.
In the pediatric population, type 2 diabetes is a very low prevalence condition (3), but is an emerging concern because it is rapidly increasing (59), especially in communities with a large population of ethnic minorities such as African American children, Native American children, children of Asian/South Pacific Islanders, or children of Hispanic origin. It is also an issue of increasing concern in sparsely populated rural communities, such as those in the majority of counties in Montana, where the population tends to be White and poor (see Chapter 27).
Among adolescents, preliminary reports identify alarmingly high rates of type 2 diabetes in the ethnic populations identified above, with the vast majority (> 90%) of those individuals classified as overweight (60). Data from NHANES showed a prevalence of diabetes (types 1 and 2 combined) of 9.3% in the adult population, with an additional 26% having impaired fasting glucose (5.6– < 7.0 mmol/L) (61). As will be discussed below, the cost associated with the treatment of type 2 diabetes is the major determinant of the direct economic costs of obesity.
Cardiovascular Disease, Hypertension, and Stroke
Cardiovascular disease (CVD) includes coronary heart disease (CHD) and peripheral vascular disease. The evidence is strong that obesity is a major independent risk factor for CVD for men (62) and women (63), and that weight reduction leads to an improvement in various cardiovascular parameters. In addition to obesity and CVD linkages through hypertension, dyslipidemia (especially low levels of high-density lipoproteins and high levels of circulating triglycerides), insulin resistance, and impaired glucose tolerance (64), the role of inflammation as an important risk factor is an emerging focus of active research (65). The greater the degree of obesity, the higher the risk of CVD (66). There are ethnic groups, such as Asian Indians, with high rates of CHD associated with a constellation of risk factors that differs somewhat from that occurring in White groups (67). Nevertheless, the relative increase in risk associated with increasing degrees of obesity is fairly similar throughout the world (7).
Elevated intra-abdominal (central) fat accumulation appears to play a key role in raising risk for heart disease, especially in men. The WHO has summarized characteristics of intra-abdominal fat that have been postulated to play a role in raising CHD risk (7), possibly by promoting insulin resistance. They are:
- Increased fat cell number.
- Higher rate of blood flow per unit tissue mass.
- Elevated glucocorticoid (cortisol) receptor number.
- Elevated androgen receptor number.
- Increased catecholamine– (epinephrine and norepinephrine) induced lipolysis (the breakdown of stored fat to release free fatty acids and glycerol).
The increased receptor number in abdominal fat may make it more susceptible, for example, to stress-induced hormonal stimulation. Since abdominal fat cells are located “upstream” from the liver, delivering fatty acids to the liver by way of the portal circulation, a high-stress lifestyle may expose the liver to high levels of nonesterified fatty acids in an individual with abdominal obesity—a scenario in which insulin resistance, dyslipidemia, and the full-blown metabolic syndrome (see below) may be more likely to develop (7). The specific linkage between abdominal obesity and disease consequences, especially the metabolic syndrome, is another area of intensive research.
Both systolic and diastolic blood pressure increase with increasing BMI (68–70) and higher rates of hypertension—defined in these studies as a systolic blood pressure of ≥140 mmHg, a diastolic blood pressure of ≥90 mmHg, or both—among obese persons as compared to lean are the consequence (68). An increased risk for hypertension has been shown for BMI ≥ 23 and blood pressure tends to improve with weight loss (70).
The connection between obesity and stroke has received less research attention, but a longer duration of obesity raises the risk of both hypertension and stroke (7, 71). The mechanism of these effects is unclear, but it is thought that the higher circulating levels of insulin associated with insulin resistance in obese persons may cause increased renal retention of sodium, with a resulting increase in blood pressure (7, 72), raising the risk of stroke.
Gall Bladder Disease
An increased risk of gallstone formation and gall bladder disease has been shown at a BMI ≥ 25 (73) and gallstones are more common among obese persons as compared with their lean counterparts (74–75). It is important to note that the risk of gallstone formation increases with weight loss, especially precipitous weight loss (73). Since the weight loss following bariatric surgery can be rapid, it is not unusual for persons undergoing a bariatric procedure to undergo simultaneous cholecystectomy (removal of the gall bladder).
Congenitally obese mice and lean mice fed a high-fat diet have increased gallbladder wall lipids and poor gallbladder emptying (76). Al-Azzawi and colleagues tested the hypothesis that compared to patients with a normal gallbladder, patients with inflammation of the gallbladder (with or without the presence of gallstones) would have increased gallbladder wall fat. Sixteen patients who underwent gallbladder removal for cholecystitis (without gallstones), 16 non-diseased controls who underwent incidental cholecystectomy during surgery for liver or pancreatic disease, and 16 diseased controls whose gallbladder was removed for chronic gallstone formation were studied. Pathology specimens were reviewed in a blinded fashion for gallbladder wall fat, wall thickness, and inflammation. The results were consistent with the hypothesis that increased infiltration of the wall of the gallbladder by fat may lead to poor gallbladder emptying and the development of biliary symptoms (76).
It has been suggested that the propensity for gallbladder disease may be inherited. But Katsika and colleagues (77) examined a large Swedish twin registry and found a doubling of risk for gallstone formation in overweight persons and a more than tripling of risk among obese persons, but no differences between dizygotic or discordant monozygotic twins (77). Taken together, these findings suggest an important role for environmental factors in the development of gallbladder disease associated with obesity.
Osteoarthritis
Osteoarthritis of the knee, hip, and back is strongly associated with obesity (78–80). An increased risk of osteoarthritis has been shown at BMI ≥ 25 (80), in studies in which confirmation of the condition was made with radiographic evaluation. Osteoarthritis becomes a comorbidity of obesity when lifestyle is affected, especially when physical activity is curtailed or treatments are required. Weight loss decreases symptoms of osteoarthritis and improves the management of the condition in weight-bearing joints (80–81).
Sleep Apnea/Obesity Hypoventilation Syndrome
Obesity is the single most important cause of sleep apnea/obesity hypoventilation syndrome, which is characterized by brief periods during sleep when breathing ceases and, in some cases, hypoxemia occurs. A strong predictor of this condition is upper body obesity, especially in males (78, 82). Confirmation of the condition is made by a formal sleep study. Sleep apnea contributes to impaired alertness during the day, which may contribute to reduced productivity on the job. It is a serious condition that interferes with the quantity and quality of sleep, and is a risk factor for premature death (78, 82–83). Weight reduction can be very effective in controlling sleep apnea (84–85).
Cancer
A 2007 report, promulgated jointly by the World Cancer Research Fund and the American Institute for Cancer Research (10), presents evidence that elevated body fat is linked to increased risk of cancer in the esophagus, pancreas, gallbladder, liver, colorectum, breast (in postmenopausal women), endometrium, and kidney (10). Table 1-4 summarizes the conclusions of this report regarding the quality of the evidence linking elevated body fatness to the increased risk of these cancers. Note that the evidence of highest quality is identified in the table as “convincing” and the evidence achieves this standard for six of the eight cancers identified above. Note also that for certain cancer sites the notation “Abd” denotes abdominal obesity, which refers to increased fatness in the upper body, usually indicated by a waist circumference of 101.5 cm or more in males and 89 cm or more in females (10). However, with respect to cancer mortality, one study estimates that only 2–3% of cancer mortality is explained by obesity (86).
Table 1-4 Increased Body Fatness and Increased Cancer Risk
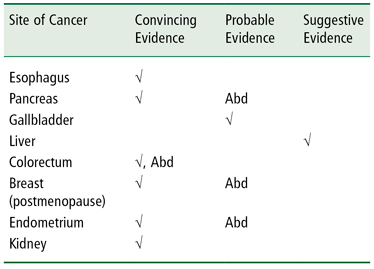
√ = increased body fatness is linked to an increased risk of cancer at the site indicated on the left. Column headings indicate the strength of the evidence linking body fatness to cancer risk.
Abd = increased abdominal fat, specifically, is linked to the increased risk of cancer at the site indicated on the left.
WCRF/AICR Report, Food, Nutrition, Physical Activity, and the Prevention of Cancer: a Global Perspective. Washington, DC: American Institute for Cancer Research, 2007 (10).
Nonalcoholic Fatty Liver Disease
Obesity is the most common risk factor associated with nonalcoholic fatty liver disease (NAFLD), a condition in which normal liver architecture is disrupted by the presence of fat. The condition can progress to nonalcoholic steatohepatitis (NASH), in which there is inflammation and injury to the liver cells, which can progress to fibrosis and cirrhosis. A very high proportion of severely obese patients who have undergone bariatric surgery (surgical treatment of obesity) have evidence of either NAFLD or NASH (87). In adults, the prevalence of NAFLD or NASH is unclear (3), but indirect evidence, based on liver transaminase levels and alanine aminotransferase levels from NHANES, suggests it may be as high as 7.9% (88), with prevalence increasing in both children (89) and adults (90). Estimates of the prevalence of NAFLD in obese children range from 22.5% to 52.8% (91–92).
The Metabolic Syndrome
The metabolic syndrome is described as a “constellation of risk factors” including central adiposity, low high-density lipoprotein levels, high circulating triglycerides, increased blood pressure, and impaired fasting glucose (93). The usefulness of the metabolic syndrome as a distinct diagnostic entity is controversial (94–95), but there is little doubt that an increasing number of metabolic and cardiovascular risk factors confers an increased risk of morbidity and mortality. One analysis of NHANES data showed that 27% of US adults met the criteria for the metabolic syndrome (96), an ominous development from a health and economic standpoint. Using criteria adapted for adolescents (97), another analysis of NHANES data (1988–94) for 12–19 year olds showed that 30% of obese youth met the criteria for the metabolic syndrome, whereas fewer than 1% of children in the normal weight category (< 85th percentile) did (98). With an estimated 17 million teens living in the US in 2010 (99), these data suggest that the number of adolescents with the metabolic syndrome is approaching 1 million.
Health-Related Quality of Life
Obesity affects not only health, but other aspects of the quality of life. Obese individuals face discrimination in securing jobs, in career advancement, and even in university entrance, as discussed in detail in Chapter 2. They tend to develop a poorer self-image than their lean counterparts and often have difficulty managing social interactions. This can create stress, which may in turn lead to increased body weight and central adiposity (7).
Health-related quality of life (QOL) is defined by the WHO as including physical, mental, and social well-being (100). Instruments for measuring QOL in adults (101), adolescents (102), and children (103) are now available and suitable for use in epidemiological studies (104). Williams and colleagues conducted a prospective, longitudinal study of >1,400 primary school children (age 9–12 years) living in Victoria, Australia, and found that health-related QOL declined as weight category increased from normal weight to overweight to obesity. In clinical populations, such declines in QOL related to increased weight are also seen and tend to be even steeper (105).
Many workers have identified a relationship between obesity and depression, anxiety, and other psychological dysphorias, but most data are cross-sectional, raising the question of what comes first, the depression or the obesity. One longitudinal study (106) of 776 subjects examined the development of depression and anxiety disorder in both male and female adolescents 9–18 years of age. Using the > 95th percentile for age and sex as the definition of obesity, these workers found that adolescent obesity in females was strongly predictive of subsequent depression and anxiety, assessed by means of structured diagnostic interviews, but it was not predictive in males (106). The reasons for this striking sex difference deserve further study.
An interesting perspective on depression is provided by Ladwig and colleagues (107), who examined the contribution of depressed mood in obese subjects to the risk of a future coronary heart disease event. This was a prospective, population-based cohort study involving three independent cross-sectional surveys of more than 6,200 subjects, of whom 737 males (23%) and 773 females (26%) were obese. The subjects were 45–74 years of age and apparently free of CHD, stroke, and cancer at the start of the study. During the mean seven years of follow-up, 179 CHD events occurred in men and 50 in women. The results showed a more than doubling of risk for CHD among men who were both obese and judged to be depressed using a standardized questionnaire. The data for women were in the same direction, but failed to reach statistical significance, perhaps because the study was underpowered (107).
Relying on self-reported data, a study of 15- and 17-year-old Swedish students, the majority of whom were from one county, found a significant statistical association between obesity and depression (108). These workers found an association between obesity and “experiences of shame,” which they defined as experiences of being “downgraded or ridiculed” by others (108). These workers concluded that shaming experiences, along with other family problems such as parental separation and parental socioeconomic factors, largely accounted for the increased rates of depression in this nonclinical population.
In ethnic minority populations, data are scant. One small but high-quality study using measured BMI and a validated instrument for measuring QOL in 175 overweight Mexican American adolescents concluded that QOL was significantly lower in the heaviest teens (109). More research is needed to examine QOL among ethnic minorities, and in all overweight children, regardless of ethnicity, interventions to improve QOL are pressing. The relationship between obesity and psychosocial functioning is discussed further in Chapters 2 and 11.
Mortality
The pharmaceutical industry is aggressively developing new medical treatments for the comorbidities of obesity, and new surgical treatments (bariatric surgery, hip and knee replacements, etc.) are making a positive contribution to health status and prolonging the life of obese individuals. Nonetheless, obesity is associated with an increased risk of mortality, primarily mortality from cardiovascular disease (110–111) and diabetes (53). The relationship between BMI and mortality can be described as a U-shaped curve, with most studies showing the nadir of the curve associated with a BMI range of approximately 18.5–24.9 (112–116). This corresponds to the currently accepted definition of the healthy BMI range.
Many studies of obesity and mortality have added to the confusion regarding the exact nature of their relationship because of a failure to control for smoking or pre-existing illness, both of which increase mortality for lean persons (7). Another source of the confusion is the inappropriate control for hypertension and elevated glucose levels, which are very often effects of obesity, leading to analyses that underestimate the association of obesity and mortality (see side bar). These factors may explain why some workers have found that, in older adults, the association of BMI with mortality is either weak or nonexistent (117–118), whereas the WHO has concluded that obesity raises the risk for premature mortality “well into the ninth decade of life” (7).
Although there is continued disagreement about the risk of premature death associated with increased BMI and about how that risk differs with age, there is no disagreement that severe obesity is strongly predictive of an increased risk of premature death. The WHO reported that severe obesity (BMI ≥ 40) is associated with a 12-fold increase in mortality among young adults aged 25–35 (7). One study of almost 5,000 Native American children followed for several decades shows that obese children are more likely to die prematurely (before age 55) from illness and self-inflicted injury than their normal-weight peers. The death rate among the obese children was more than double that of the leanest children (141). The prevalence of obesity may be leveling off, but severe obesity is increasing in both adults and children, afflicting approximately 17 million people (41) in 2006. There is no doubt these people will face an increased risk of both morbidity and premature mortality making this an urgent public health concern Box 1-2.
Box 1-2 Obesity and mortality—historical perspective and current controversy
The life and medical insurance industries were the first to investigate the relationship of body weight to risk of disease and, particularly, death. In the two largest of these studies, the Build and Blood Pressure Study of 1959 (119) and the Build and Blood Pressure Study of 1979 (120–121), a J-shaped curve of mortality was described, with persons at low and high weights showing the greatest mortality risks. In the 1959 Build Study, mortality was 42% higher in obese persons, with obesity defined as a weight 30% or more above the median weight for individuals of the same height and sex. The results of this study were used to develop a set of tables of ideal weight for height for adults. Twenty years later, because of secular increases in weight in the US population, the 1979 Build Study revealed that the lowest mortality in men under 50 years of age was associated with weights 5–15% lower than the average weights of men at that time. In men, as age increased the optimal weights for the lowest mortality increased somewhat, but were still below the earlier range defined by the 1959 Metropolitan Life Tables. For women, the weights associated with lowest mortality increased with increasing age, suggesting that older individuals could safely be somewhat heavier. But it was also noted that the rise in mortality for obese individuals became steeper as excess weight increased.
Since the Metropolitan Life Tables guided clinical practice for decades by defining ideal or healthy weight-for-height, it is worth noting some limitations of the life insurance data on which the tables were based. They were primarily gathered from Caucasian, upper- and middle-income persons and as such were not representative of the US population as a whole. In an effort to address these limitations, the American Cancer Society (ACS) initiated a long-term longitudinal study in the general population (122–123). The results of this study, conducted between 1969 and 1972 on 700,000 people, were similar to the two Build studies. This suggested that the data obtained from the insurance pool population could be extrapolated to the general population. All three studies found the lowest mortality at weights below the population average (119–120, 122–123), suggesting that the distribution of weight in the US was shifting to higher levels and was associated with a shorter lifespan. Because the ACS was especially interested in cancer, it separated smokers from non-smokers, which the insurance studies had not done. Smoking is an independent risk factor for premature mortality and smokers tend to be leaner than nonsmokers. Since the two Build studies included smokers, they overstated the risks of being underweight and understated the mortality risk of being obese (119–120, 124).
In 1984, Waaler and colleagues (125) reported on an extensive longitudinal study carried out in Norway. The lowest mortality was found in the BMI range of 23–25. In the younger male age groups, mortality began to rise more steeply at a BMI of 29. In women, the lowest mortality was in the BMI 23–27 range, and increased gradually above that.
The Framingham study was another longitudinal investigation, using a sample of the population of a typical middle-class American town. This study also showed the lowest mortality occurred at weights that were 5–15% below the average weight of the population (126). Two other longitudinal studies, in which subjects were followed for 34 and 26 years, respectively, showed a significant independent effect of obesity on mortality (127–128).
The Nurses’ Health Study (63), now in its 18th year, is following more than 100,000 US women to define the association between a number of factors and mortality. The nurses ranged from 30 to 55 years of age at the start of the study. These workers reported a significant association between BMI and mortality in a subpopulation that carefully excluded smokers. The lowest mortality was found at a weight at least 15% below the average weight for US women of similar age. The relative risk of dying prematurely from heart disease in non-smoking women began to rise at a BMI of 22, but reached statistical significance at a BMI of 27, and was 7.7 times higher than the normal weight control group at a BMI > 32. The relative risk for all-cause mortality in non-smoking women also began to rise at a BMI of 22 and was 2.2 times greater at a BMI > 32. Thus, this study confirms that overweight and obesity increase the risk of premature mortality in women, as had been previously reported for men in the Framingham study (126).
Although many studies indicate a strong relationship between obesity and mortality, a number of studies have not found a relationship between the two (129–139). There are at least two possible explanations for this. First, mortality studies must be of long enough duration so that the absolute number of deaths suitable for analysis is high enough to provide sufficient statistical power to detect differences. In studies where different age groups are studied, this can be difficult to achieve. Second, in many of the studies the very diseases that are associated with or exacerbated by obesity have been eliminated or controlled for. For instance, diabetic patients have been excluded from most studies; hypertensive persons have either been excluded or blood pressure controlled in analyses. Because obesity exerts much of its effect through such conditions, the elimination of these comorbid conditions greatly attenuates the measured adverse effect of obesity. This has been discussed by Manson and colleagues (140), who have shown that in 25 major prospective studies on the relationship between obesity and longevity, there was at least one of three biases that led to systematic underestimation of the impact of obesity on mortality. These biases are: 1) failure to control for cigarette smoking; 2) inappropriate control for the biological effects of obesity, such as hypertension and hyperglycemia; and 3) failure to control for the presence of subclinical disease. The latter is usually controlled for by discarding mortality data for the first 3–5 years of the study in the event that those deaths were attributable to pre-existing disease that was undetected at the start of the study. These are some of the factors identified by the WHO, which reviewed the evidence on this issue and concluded that obesity raises the risk for premature mortality “well into the ninth decade of life” (7).
Economic Consequences of Obesity
Assessments of the economic costs of obesity have been few, and this is an area in which more research is needed. There is no doubt that overweight and obesity and their associated health problems have a significant economic impact on the US healthcare system. Costs associated with overweight and obesity are usually broken down into two categories: direct and indirect costs (142–143). Direct medical costs include preventive, diagnostic, and treatment services, pharmaceuticals, physician and surgeon costs, hospital costs, etc. Indirect costs relate to both morbidity and mortality costs; the former include the value of income lost from decreased productivity, restricted activity, absenteeism, and bed days. Mortality costs are the value of future income lost because of premature death.
In one study of national costs attributed to both overweight and obesity, the authors used the 1998 Medical Expenditure Panel Survey (MEPS) and the 1996 and 1997 National Health Interview Surveys (NHIS) to estimate direct medical costs. The data also included information about each person’s health insurance status and socio-demographic characteristics. This estimate of the costs of overweight and obesity combined amounted to as much as $78.5 billion, with $47.5 billion attributable to obesity alone, with Medicare and Medicaid financing roughly half of these costs (144).
When the costs of overweight and obesity are adjusted for inflation and the data expressed in 2008 dollars, the direct costs of obesity reach as high as $147 billion (145). It is estimated that this represented almost 10% of all medical spending in the US in 2008 (145). Finkelstein and colleagues have estimated the costs of obesity at the state level, where costs range from $87 million (44% covered by Medicare and Medicaid) in Wyoming to $7.6 billion (45% covered by Medicare and Medicaid) in California (146). It is worth noting that in 2009 the CDC budget specifically for the Division of Nutrition, Physical Activity and Obesity (DNPAO) for addressing obesity at the state level is insufficiently funded so that only 23 states are funded by the DNPAO for fiscal year 2009.
The cost of private insurance is usually shared by employers and individual workers, and is increasingly identified as a sharply increasing business cost that is forcing some employers to withdraw health insurance for their employees. The majority of people who are privately insured obtain their insurance through their employer and the majority of employed persons regard health insurance as their most important job benefit (147). But the cost of health insurance is rising rapidly, especially for employers who employ fewer than 200 employees (see Figure 1-8).
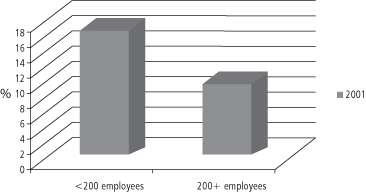
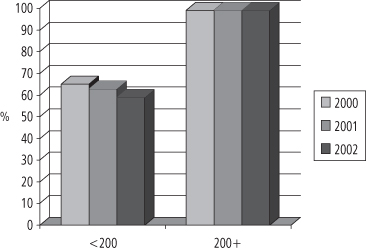
The consequence is that smaller employers are forced to drop health insurance coverage for their employees, or they shift the costs—via higher premiums or co-pays—to their employees. Figure 1-9 illustrates the data for the years 2000–2.
In the US, corporate CEOs and state and federal political leaders are decrying healthcare costs which soared from $73 billion in 1970, to $253 billion in 1980, to $714 billion in 1990, to $2.1 trillion in 2006 (147–148). These costs amount to more than $7,000 per resident and account for 16% of US gross domestic product (147–148). The high prevalence of chronic illnesses has been identified as one of the major factors driving healthcare costs. Other factors are long-term care services, such as nursing homes, prescription drugs, and assistive or therapeutic technology, the aging of the population, and escalating administrative costs. Except for administrative costs, as shown in Box 1-3, obesity plays an important role in each factor identified, although there is a great need for future research to provide more specific quantitative information.
Box 1-3 Obesity and Increased Healthcare Costs
| Factor Driving up Healthcare Costs | Role of Obesity in that Factor |
| Increased chronic illness | Obesity itself is a chronic condition and leads to the development of many other chronic conditions (diabetes, heart disease, hypertension, certain cancers, etc.) |
| Aging of the population | The prevalence of obesity steadily increases from age 20 to age 55 in males; and from age 20 to age 75 in females (see Health, United States, 2006; Table 73) |
| Prescription drugs and technology | Drugs are used to treat obesity and its comorbidities; the use of new technology such as lap-bands, etc., in bariatric surgery and prosthetic devices in joint replacement surgery |
| Long-term care services, such as nursing homes | Greater joint problems lead to decreased mobility and reduced health in older obese individuals, resulting in increased need for nursing home stays |
One Fortune 500 company recently documented a 19 cent reduction in earnings per share directly attributable to rising healthcare costs (149). According to one source, since 2001 employees are paying 64% more in healthcare costs and employers are paying 78% more (150). Indeed, the coffee giant Starbucks has 80,000 employees and in 2005 was reportedly spending more on health insurance than on coffee beans (151).
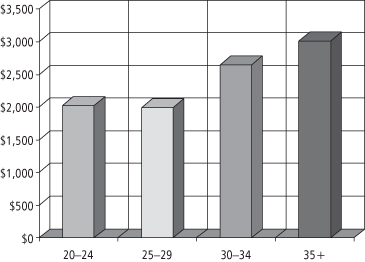
A number of workers have examined the linkage between obesity and rising healthcare costs. Quesenberry and colleagues (152) studied obesity and the cost of health services utilization among more than 10,000 respondents to a 1993 health survey of members of a large health maintenance organization in northern California (152). The results (shown in Figure 1-10) indicated that the mean annual cost per person was 25–33% higher in obese persons—these additional costs amounting to as much as $500–1,000 per year (in 1993 dollars).
Figure 1-10 Kaiser Permanente (n >10,000) health services utilization: mean annual cost per person by BMI
Related posts:
 Effect of obesity on development and health in childhood
Genetic contributions to the development of obesity
The challenge of weight loss maintenance: successful losers
Worksite health promotion for obesity prevention
Behavioral approaches to the treatment of obesity
Appetite and body weight regulation
Effect of obesity on development and health in childhood
Genetic contributions to the development of obesity
The challenge of weight loss maintenance: successful losers
Worksite health promotion for obesity prevention
Behavioral approaches to the treatment of obesity
Appetite and body weight regulation
Stay updated, free articles. Join our Telegram channel

Full access? Get Clinical Tree


