Fig. 9.1
(a) Schema of a multifeature MMN paradigm. The standard stimulus randomly alternates with one of the five deviants, each of which differs from the standard by one feature only being identical to the standard in respect to all other features (e.g., a complexity deviant has the same perceived pitch, loudness, duration, and location as the standards). (b) A vegetative-state/unresponsive wakefulnes patient who exhibited significant MMN responses to all five kinds of deviation. Negativity is plotted downwards. Note the large negative deflections around 200 ms post stimulus at Cz and simultaneous positive deflections at mastoids (M2). CRS-R Coma Remission Scale-Revised, full score
Like N1 and P2, the MMN is largely independent on attention (e.g., Näätänen and Alho 1995) and the functional condition of patients (Kotchoubey et al. 2003a). In particular, it is better expressed when subjects’ attention is directed away from the auditory stimuli, and the subjects perform a different (e.g., visual) task. The MMN to attended stimuli is not suppressed, but it is overlaid with other ERP components such as N2b, which is strongly attention dependent (Näätänen et al. 2007).
The oddball paradigm is also used to elicit the component P3, or P300. This is a large positive deflection with a centro-parietal maximum and a latency between 300 and 400 ms (which may be delayed in brain-damaged patients). In contrast to the MMN, P3 is best pronounced in response to attended deviants; it is maximal when the eliciting stimuli are targets in a task (e.g., they should be counted) and smaller in a no-task condition (“just listen to stimuli”) and can even disappear when the attention is deployed to other stimuli. The putative neural basis of P3 is a complex network including temporal and parietal cortical areas and subcortical centers such as the hippocampus. Therefore, while the MMN reflects a low-level, relatively passive sensory discrimination, P3 manifests higher-level, complex discrimination processes in which a stimulus is selected as a target.
The large amplitude of P3 permits to limit an oddball sequence to 200–300 stimuli. Bostanov and Kotchoubey (2006) obtained reliable P300 after only 9 deviants in a passive (just-listen) condition. Usually, however, 20–30 deviants should be averaged. On the other hand, the development of P3 requires more time than that of the MMN, and thus interstimulus intervals of at least 0.9–1 s are necessary (Duncan et al. 2009).
The difference between the MMN, N2b, and P3 is well illustrated in a dichotic listening paradigm, in which two stimulus trains are presented in parallel in two ears. The task is to count rare deviants in one ear, ignoring all stimuli in the other ear. The MMN is well pronounced in response to deviants in the ignored ear. N2b can be recorded to all stimuli in the attended ear, although its amplitude may be larger to deviants than to standards. A typical P3 is elicited only by target stimuli, i.e., by deviants in the attended ear.
The N400 is a specific ERP component elicited by violations of a meaningful context. A typical N400 paradigm includes sentences with a meaningless (semantically incongruent) final word, such as “The waiter served coffee with milk and shoes.” Compared with a corresponding congruent ending (…“sugar”), the word “shoes” results in a large negative centro-parietal deflection with a peak latency of about 400 ms. The same effect can also be elicited by incongruent word pairs (cat-moon, compared with cat-mouse), semantic violations in a row of words (tiger, wolf, bear, polecat, stomach), or even by nonverbal stimuli such as a picture that violates the context of other pictures.
From the point of view of DoC, it is important to note that an N400 to semantic violations indicates a high-level processing of meaningful stimuli but does not prove conscious verbal comprehension. Congruent verbal expressions frequently contain strongly associated words. In the example above, the association between coffee and sugar is stronger than that between coffee and shoes. This different association strength can result in the node sugar being automatically (nonconsciously) activated by the node coffee. According to one of the suggested models, N400 amplitude is inversely related to the preceding activation of the corresponding node (Kiefer 2002; Silva-Pereyra et al. 1999). Therefore, when the end word sugar is presented, it elicits a smaller N400 than previously inactive shoes. If this model is correct, the differential N400 effect can emerge by means of a purely automatic activation process without participation of consciousness.
In addition to these stimulus-related ERP components, two response-related components should be mentioned: readiness potential (RP, also known as “Bereitschaftspotential”) and contingent negative variation (CNV). The RP (Kornhuber and Deecke 1965) is a slowly rising negative deflection preceding voluntary movements: with a fronto-central maximum, it starts about 0.6–2 s before movement onset. Its main, symmetrical portion manifests the activity of the premotor cortex, particularly the supplementary motor area, which implies a nonspecific preparation to motor activity in general but not to a particular movement. Only the last portion of the RP (about 200 ms) includes strong participation of the primary motor cortex. When the voluntary movements are performed with hands (which is the case in most experiments), this involvement of the motor cortex is reflected in the RP having a larger amplitude on the contralateral side. This lateralized portion of the RP can also be recorded before signaled movements and not only before voluntary movements. An “inverted lateralization” (i.e., a larger negativity on the ipsilateral side) indicates covert preparations of the wrong response channel (Coles 1989).
The CNV is a predominantly frontal negative wave that appears between two strongly contingent events, most typically between two stimuli separated by a constant interval. In the standard paradigm (Walter et al. 1964), the second stimulus was a signal to a motor response, and the first stimulus had a warning function. Although this arrangement results in a large CNV, the same effect can be obtained when the first stimulus initiates a response, and the second one bears the information whether this response was correct or wrong. The CNV can also be recorded between the onset and offset of a stimulus having a sufficient and constant duration, even if no motor response is required (Bostanov et al. 2013). When the interval separating the two events is sufficiently long (3–4 s), one can see that the negative wave has two components. The early CNV manifests late stages of the processing of the first event, whereas the larger late CNV is related to the preparation to the second event.
9.3 The Problem of Individual Assessment
The ERP paradigms used in DoC patients were developed in experiments with healthy participants on the basis of a group analysis. In such experiments, the presence of an ERP component is determined after grand averaging of the waveforms of the whole group. The optimal time window for each component is defined by visual inspection of such a grand average waveform (e.g., 300–500 ms for the N400). The amplitude and latency of the component are then measured in this window, and the results are compared between groups or conditions.
This approach is not appropriate for the assessment of individual patients for the following reasons. Due to a severe brain damage, the relevant time window can be delayed and vary among patients. A component can be reliably present in a minority of patients but absent in most of them. As a consequence, the grand average across a DoC sample may not be representative for single patients. If, however, the time window is selected on the basis of patients’ individual averages (rather than the grand average), a strong bias toward false-positive findings can follow. It is intuitively clear that, having unrestricted freedom of individual adjustment, we could find “significant” differences between almost any two waveforms. Finding the middle way between the Scylla of underadjustment (leading to information loss and false-negatives) and the Charybdis of overadjustment (leading to false-positives) remains a matter of art rather than science. The situation is even worse if ERP components are quantified by means of subjective assessment (Valdes-Sosa et al. 1987). Unfortunately, this method is still used by many research groups applying ERP in neurological patients. If the experts are aware of the clinical and demographic characteristics of the patient (which is often the case), their assessment can be biased by this knowledge.
Several methods have been suggested to solve this problem. From a statistical point of view, they vary in respect of power and statistical strength, and from the computational point of view, the difference is important between the permutation-based techniques and those not using permutation. A simple and useful non-permutational technique was proposed by Guthrie and Buchwald (1991). A running t-test is calculated at each consecutive time point across an interval that can be defined broadly enough to rule out subjectivity factors. Further, the covariation between adjusted points is estimated. This covariation determines the minimum length of the row of significant t-values necessary for identification of a significant ERP effect. Also correction by means of false discovery rate (FDR: Benjamini and Hochberg 1995) is only slightly more effortful than G&B. The method is broadly used in other domains of neurophysiology (e.g., fMRI studies) but has, to my knowledge, not been applied for ERP assessment of neurological patients. FDR, however, is prone to underestimation of the covariations between different time points and electrodes (Groppe et al. 2011a), and its results depend on the real presence or absence of an effect, i.e., on the number of false null hypotheses (Groppe et al. 2011b). Furthermore, some simulation experiments using FDR yielded a great variation in the number of false-positive findings (Korn et al. 2004), although more realistic simulations did not replicate these results (Groppe et al. 2011b).
Using permutation to correct for false-positives in ERP research and evaluation was suggested by Blair and Karninski (1993) and later on employed in the analysis of both ERP (e.g., Lage-Castellanos et al. 2008) and rhythmic EEG components (e.g., Laaksonen et al. 2008). The simple underlying idea is that if there is no difference between the conditions (e.g., “rare” versus “frequent”), then it does not matter which particular trial belongs to which condition. The result would be the same if we deliberately swap trials between conditions, except purely random variations. If we repeat this procedure, say, 10,000 times, we can see how often the resulted statistics (e.g., a t-test) will attain or even exceed the corresponding statistics obtained when the trials are correctly assigned to the conditions. The great advantage of permutation tests is that they are exact; this means that they do not result in statistical estimates of (or approximations to) some critical value but, rather, in this critical value itself. They are distribution-free and do not require any assumptions except that observations across subjects are mutually independent. The disadvantage is rather high computational demands. This is particularly true if permutation is carried out for each single data point as originally suggested. Then, having a rather moderate data set with 300 time points, 30 electrode channels, and 2,000 permutations (a minimum!), 18 million t-tests (or other similar statistics) have to be computed for one analysis.
To reduce this effort, one can group together the statistics obtained at adjacent time points and electrodes, resulting in a clustered data (Maris and Oostenveld 2007). Usually, statistics that do not reach a threshold level (e.g., at least two adjacent t-tests reaching an uncorrected p-value of 0.05) are filtered out before clustering. The resulting relatively small number of variables then undergoes a permutational analysis (Oostenveld et al. 2011; Groppe et al. 2011a). This method is implemented in MATLAB and used in several ERP studies. However, a problem of this procedure is the presence of several clustering parameters (the primary significance threshold, the definition of neighborhood, etc.) that are open for arbitrary decision and whose choice can strongly affect the results. When the most general question is asked, i.e., whether two responses of a patient differ or not, clustered permutation techniques appear to be superior to FDR and non-clustered permutation tests (Groppe et al. 2011b). However, the stronger the need to localize the difference and to ascribe it to a particular ERP effect, the more problematic is the use of the clustering method, because local events can be smeared by informal clusterization.
The technique of t-CWT (studentized continuous wavelet transformation: Bostanov 2003; Bostanov and Kotchoubey 2006) was introduced with the explicit aim of extraction of the maximum information contained in the difference between two waveforms corresponding to the two conditions in a typical ERP experiment. In contrast to the univariate methods depicted above, t-CWT is a technique of a multivariate analysis that takes into account all covariations between spatial and temporal points. Studentization (i.e., the representation of the difference between two ERP waveforms or between one waveform and zero, in t-scores) allows the investigators to attain the optimal power possible with a given signal/noise ratio. The target ERP components can be identified and localized by means of a continuous wavelet transformation, which allows to represent the response as a three-dimensional figure with the axes time, scale (=1/frequency), and size (amplitude). Therefore, the windows for the components are defined in a fully objective manner (Fig. 9.2). It should be said that the main achievements of this method have their costs: the backside of the independence of covariations is the use of a parametric Hotelling test, whose assumptions (e.g., normal distribution) are not always fulfilled, and the optimization of information extraction has the disadvantage that the alpha inflation is not controlled but, in contrast, maximized. However, both problems are removed when the final set of data, again, undergoes a permutation test with at least a few thousand permutations. This test results in an unbiased, powerful, and distribution-free estimate of an ERP effect.
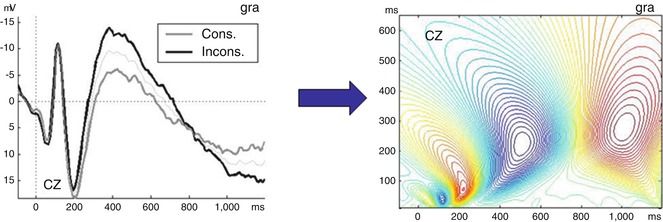
Fig. 9.2
t-CWT transformation allows us to transform a two-dimensional ERP (amplitude/time) into a three-dimensional pattern (amplitude/scale/time). Left panel: a typical ERP at Cz in a verbal paradigm with semantically consistent (gray line) and inconsistent (black line) words; the latter elicit an N400. Negativity is plotted upwards. Right panel: the same ERP after t-CWT transformation. The ordinate shows scale values (scale =1/frequency), while the amplitudes are shown in a color scale from red (positive) to blue (negative)
Although the t-CWT method is theoretically optimal, this does not mean that its additive value in the diagnostic use is practically significant as compared with simpler, less effortful procedures. Even if the method is much more powerful than the classical area analysis and several multivariate techniques such as the discrete wavelet transform (Bostanov and Kotchoubey 2006), it has not been directly compared with FDR and clustered permutation tests. Recent studies with both simulated (Real et al. 2014) and real DoC patients’ data showed that t-CWT is significantly more sensitive than G&B procedure (as theoretically expected) but that the difference is not very large and partially compensated by speed and easiness of the running t-test. More data are necessary to give precise recommendations about using different quantitative methods of individual assessment of DoC subjects.
9.4 ERP Manifest Remaining Cognitive Processes in DoC Patients
About 20 years ago, several publications (Reuter et al. 1989; Marosi et al. 1993; Moriya et al. 1995) reported P3 findings in some patients diagnosed as vegetative/unresponsive wakefulness (VS/UWS). These early reports, however, were sporadic and clinically unreliable. Thus Marosi et al. (1993) claimed to find “P3 in the vegetative state,” although only two of the reported 23 patients apparently corresponded to the modern diagnostic criteria of VS, and no P3 was recorded in these patients. The first larger study was carried out by Schoenle and Witzke (2004) (preliminary data reported 8 years earlier: Witzke and Schönle 1996). They examined 43 VS/UWS patients and 23 patients “near vegetative state,” who might roughly have fulfilled the criteria of the minimally conscious state (MCS). The N400 paradigm with semantically congruent and incongruent sentence endings was used. An N400 to semantic incongruence was found in 5 VS/UWS and 17 “near VS” patients. Among 54 severely brain-damaged but conscious patients, the N400 was obtained in 49 cases. This was probably the first indication that even “definitive VS” patients possess so-called higher cortical abilities, in this case the ability to semantic word categorization. Unfortunately, the method of N400 quantification was very subjective, and the raters might have known the diagnoses of patients.
Kotchoubey et al. (2005) applied a quantitative assessment of ERP components, in which the only subjective factor remained the definition of individual component time window. The integral amplitude was automatically measured in this window in each single trial and then statistically compared between conditions (e.g., standards versus deviants in the oddball paradigm; semantically congruent versus incongruent words in semantic paradigms). These authors reported even higher than (Schoenle and Witzke 2004) rates of N400 in both VS/UWS and MCS patients. This finding has recently been confirmed by Balconi et al. (2013) and Steppacher et al. (2013) using objective ERP evaluation techniques; the latter study included a sample of as many as 175 DoC patients.
As regard P3, it could be obtained in 20–25 % of DoC patients (Witzke and Schönle 1996; Kotchoubey et al. 2001, 2005; Cavinato et al. 2009 [only traumatic VS/UWS patients], Schnakers et al. 2008 [P3 found only in MCS but not in VS/UWS], Fischer et al. 2010; Müller-Putz et al. 2012; Guger et al. 2013; Steppacher et al. 2013). This may indicate activation of complex cortico-subcortical networks in response to target stimuli in many patients. Unfortunately, large brain damage of some patients makes it sometimes difficult to distinguish between the “real” P3 (also called P3b) from the so-called novelty P3 (or P3a), reflecting more superficial orienting response to novel stimuli (Kotchoubey 2005; Fischer et al. 2010).
More conservative approaches may result, however, in substantially lower rates of P3. Faugeras et al. (2012) used a design in which P3, if recorded, could necessarily be the P3b; they obtained this component only in 7 of 13 conscious patients, 4 of 28 MCS, and 2 of 24 VS/UWS, while these two also changed to MCS in a few days after examination. Chennu et al. (2013) used a system of 91 electrodes to separate P3a from P3b and found a P3a in 1 of 9 VS/UWS and 3 of 12 MCS patients. These poor results are particularly surprising because this study was one of a very few in which both ERP and fMRI measures of cognition in DoC patients, and the fMRI experiment (Owen et al. 2006) revealed the ability to follow instruction in 4 VS/UWS and 5 MCS patients. Therefore, the high-level ability to understand and consistently follow verbal commands was found with a rate more than twice as high as the low-level involuntary orienting reaction manifested in the P3a.
The MMN is already used in acute coma as a standard EEG measure (e.g., Fischer et al. 1999, 2010) (see also Chap. 7). The component was also found in some one-third of VS/UWS and MCS patients (Kotchoubey et al. 2005; Wijnen et al. 2007; Fischer et al. 2010; Luauté et al. 2010; Faugeras et al. 2011, 2012; Risetti et al. 2013), indicating these patients’ ability to sensory discrimination. Recent experiments using the multifeature MMN paradigm (Guger et al. 2013) indicate that this ability can be retained in an even larger number of patients than that identified with a unifeature paradigm (see Fig. 9.1 above). Significant differences between VS/UWS and MCS were reported only by Boly et al. (2011) in a study with 13 MCS and 8 VS/UWS patients, in which the ERP data underwent a source analysis with a following dynamic causal modeling (DCM) analysis. The data were interpreted as suggesting that top-down connections from the frontal cortex to primary auditory areas, presented in both healthy individuals and MCS patients, were lacking in VS/UWS, while bottom-up connections from the auditory to the frontal cortex remained preserved in all patients. However, the lack of any sign of an MMN in the primary data of VS/UWS patients and the dramatic differences between these data and those of all other MMN studies strongly question the use of complex mathematical techniques such as DCM (King et al. 2011). Most probably, both feedforward and feedback connections were broken in this small sample of VS/UWS patients (King et al. 2011). Only one study (Faugeras et al. 2011) investigated the CNV preceding the last stimulus in the sequence and probably reflecting anticipation of this stimulus; this wave was obtained in 12 of 28 MCS patients, 9 of 24 VS/UWS patients, and 8 of 13 conscious patients.
What about a presumable hierarchy of these components? As stated above, the lack of early subcortical EP components precludes the emergence of later, cortical ERP components. On the other hand, almost all patients having at least partially preserved brain stem auditory EP also exhibit cortical exogenous components P1, N1, and P2 or at least some of these three. Within the cortical components, however, no strict rule like “if X is absent, Y must be absent too” can be established. Recent studies (Guger et al. 2013) demonstrated that there is no earlier ERP effect whose loss completely rules out a later effect; thus there can be an MMN without N1, P3 without N1 and MMN, etc. (see also Kotchoubey et al. 2005). This means that an ERP test battery applied for DoC patients should always check all important cognitive components and that the examiners should not stop when initial findings are negative.
As regards emotional stimuli, Bostanov and Kotchoubey (2004) recorded a component N300 in response to affective exclamations. The wave is, most probably, an early variety of the N400 related to violations of emotional – instead of semantic – context. Later on, the N300 was also found in VS/UWS and MCS patients with mostly left hemispheric lesions (Kotchoubey et al. 2009). In the same study, a magnetoencephalographic analysis of the N300 showed, however, that it cannot be attributed to emotional processing directly but, rather, to a later cognitive process of detection of affective mismatch.
Another kind of affective, highly meaningful stimuli is a subject’s own name (SON) that in healthy individuals elicits P3 of larger amplitude as compared with other similar stimuli (Berlad and Pratt 1995). Kotchoubey et al. (2004) applied this stimulus in a group of VS/UWS patients and did not find a significant amplitude differences between SON and another stimulus of the same frequency in any of them. A single MCS patient developed a paradoxical response in form of a slow frontal negativity instead of a parietal P3. No SON response in VS/UWS was also found in a later study (Schnakers et al. 2008); however, these authors found a clear P3 increase to SON in MCS. Qin et al. (2008) investigated a mixed group of acute and chronic DoC patients: 7 of 12 patients exhibited a significant increase of the MMN (rather than P3) to SON. Two studies led to more positive results. One of them yielded both MMN and P3 effects to SON (in the passive condition) in almost every patient: 7/8 VS/UWS and 3/3 MCS (Risetti et al. 2013). In the other study, a P3 increase to SON was found in 3/5 VS/UWS and 6/6 MCS patients, although the response was considerably delayed in VS/UWS as compared with MCS; in addition, the authors examined four patients with locked-in syndrome (LIS) and also obtained the effect in each of them (Perrin et al. 2006). The design of the last study was different from a typical oddball, as a patient’s own name was presented among other, unrelated names.
SON data illustrate one more important point in using ERP in DoC: stimuli that are most efficient in eliciting a response must possess sufficient complexity. The own name is a much more complex stimulus than simple tones, and it elicits more reliable responses. Likewise, Jones et al. (2000) obtained significant MMN in VS/UWS patients to such complex auditory pattern deviation as a transition from oboe to clarinet. Both P3 and MMN in DoC are significantly more frequent and have significantly larger amplitudes when elicited by changes in harmonic tones than by acoustically equivalent changes in sine tones (Kotchoubey et al. 2001, 2003a).
ERPs have also been used to study learning in DoC. The simplest learning process of cortical habituation appears to be preserved in VS/UWS: the component N1 decreased after ten repetitions of the same tone and recovered to a tone of different pitch in a group of 33 patients (Kotchoubey et al. 2006). In contrast, Faugeras et al (2012) studied a higher-level process of ERP changes in the course of pattern stimulation. Learning effects similar to those in healthy controls were observed in one VS/UWS patient of 24 and 2 MCS patients out of 28.
9.5 ERP and Consciousness
The preceding section summarizes ERP evidence that the brain of many DoC patients is able to various kinds of stimulus processing, involving distributed cortico-subcortical networks and even the processing of word meaning. The number of VS/UWS and MCS patients who exhibit such abilities is too large to be explained by occasional diagnostic errors. However, the main diagnostic criteria of DoC include the severe disorder (MCS) or the lack (VS/UWS) of consciousness, not of information processing. This is not the same: even very complex processing operations in the brain can be done without participation of conscious awareness (van Gaal and Lamme 2012). This is equally true for the passive brain responses to the own name, which persists in coma (Fischer et al. 2008) and stage II sleep (Perrin et al. 1999). A warning should be expressed against the confusion between consciousness and attention: the fact that P3 is highly sensitive to attentional manipulations does not prove that the presence of a P3 indicates conscious perception of stimuli (Daltrozzo et al. 2012). A demonstration of preserved information processing abilities is not a proof of conscious awareness (Celesia 2013).
Related posts:
 Brain-Computer Interface for Assessing Consciousness in Severely Brain-Injured Patients
The Chronic Clinical Setting
Brain-Computer Interface for Assessing Consciousness in Severely Brain-Injured Patients
The Chronic Clinical Setting
 Prognostic Use of Somatosensory Evoked Potentials in Acute Consciousness Impairment
 Prognostic Use of Cognitive Event-Related Potentials in Acute Consciousness Impairment
 EEG in Refractory Status Epilepticus
 Prognostic Utility of Electroencephalogram in Acute Consciousness Impairment
Stay updated, free articles. Join our Telegram channel

Full access? Get Clinical Tree


