(1)
Department of Behavioral Neurobiology, Institute of Experimental Medicine, Budapest, Hungary
Abstract
In this chapter we cross-check current concepts by making use of all the available information starting from accidental brain lesions to brain imaging studies, from animals to humans, and from normal manifestations to abnormal forms of aggression. The analysis focuses on four brain regions, namely the prefrontal cortex, amygdala, hypothalamus, and periaqueductal gray. While the number of brain regions involved in aggression is considerably larger, current views suggest that these four have critical roles and can be considered focal points of aggression control. The ultimate aim is to map the possibility of building a comprehensive neural theory of aggression control and of identifying brain alterations that result in dysfunctional aggression.
4.1 The Hypothalamus
This brain area is a major site of vegetative control; it contains brain structures that can be considered the headquarters of the endocrine system and hosts nuclei involved in circulation, respiration, hunger, etc. The first evidence on its role in behavioral control came from aggression research. It became clear over the decades that followed this discovery that the hypothalamus controls a wide array of behavioral phenomena from sexual behaviors to feeding. It was proposed that such wide roles derive from its “strategic” position; being at the crossroads of endocrine and behavioral regulation, the hypothalamus is uniquely able to integrate these two major control mechanisms (Kruk et al. 1998). It may also play a role in the vegetative and metabolic adaptations required by the execution of behaviors, especially when these are demanding. Unfortunately, the integration of these widely different but necessarily interacting systems is poorly understood at present, for which our analysis will lack this dimension. One should keep in mind, however, that the hypothalamus likely integrates behavior with vegetative functions in a way very similar to the integration of emotions and behavior by the amygdala, and cognitions and behavior by the prefrontal cortex.
4.1.1 Hypothalamically Controlled Behaviors
Research performed in the 1920s and 1930s of the last century showed that cats and rats electrically stimulated in their hypothalamus show within seconds a variety of behaviors, e.g., aggression against conspecifics, circling, digging, drinking, escape jumps, feeding, self-grooming, hoarding food, locomotion, predation, social grooming, and teeth chattering. Subsequent research employing more sophisticated techniques delimited the hypothalamic areas subserving particular behaviors (see Table 4.1 for data in rats).
Table 4.1
Behaviors elicited by hypothalamic stimulation in the rat and their locus of control
Behavior | The extension of the areaa | Nuclei involved | References |
|---|---|---|---|
Food hoarding | LH | Herberg and Blundell (1967) | |
Feeding (its inhibition) | LH (AHA, VMH) | ||
Drinking | LH | Mendelson (1970) | |
Predatory-like attack | LH | Woodworth (1971) | |
Grooming | AP: −1–−3.25b; DV: 4.5–2; L: 0–1 | AHA, DMH, POM, PVN, VMH, | Lammers et al. (1987) |
Digging | AP: −1–−3.25b; DV: 4–2.5; L: 0.75–2.2 | LH, POL, ZI | |
Circling | AP: −1–−3.25b; DV: 4.5–2; L: 1.5–2.2 | CAI, GP, LH, SM, | |
Locomotionb | AP: −1–−3.25b; DV: 4.5–2; L: 0–2.2 | AHA, DMH, LH, POM, POL, PVN, VMH, ZI | Lammers et al. (1988) |
Escape jumps | AP: −1–−3.25b; DV: 4.5–2; L: 0–1.75 | AHA, BST, DMH, FMT, LH, POM, VMH, ZI | |
Rivalry attack | AP: −1.45–−2.95; DV: 3–2; L: 0–2 | AHA, LH, VMH | Lammers et al. (1988) |
Social grooming | AP: −1–−3.25b; DV: 4–2; L: 1–2 | LH, POL, VMH | |
Teeth chattering | AP: −1–−2.95; DV: 3.5–1; L: 0–1.5 | AHA, POM, VMH |
These studies led to the conclusion that positive sites for any of these behavioral responses are clustered into restricted and only partially overlapping hypothalamic areas. However, neuronal clusters with specific behavioral roles have several interesting properties that all raise questions regarding the nature of the neural mechanisms activated:
1.
The anatomical boundaries of hypothalamic nuclei—as identified by neuron clustering in brain atlases are not “respected” by functional boundaries as identified by electrical stimulation. For example, particular behaviors can be elicited from relatively large areas that comprise several “anatomical nuclei” and from neuron-sparse locations. The latter are sometimes rather distant from the surrounding (neuron-dense) nuclei from which the same behavior cannot always be elicited, suggesting that cell-scarce areas play important roles in behavioral control. Thus, both electrophysiological and anatomical techniques provide hypothalamic “maps,” but neuronal and functional clustering is different.
2.
The hypothalamic “electrophysiological nuclei” overlap spatially, as the stimulation of the very same nucleus may activate different behaviors. Yet these spatially overlapping areas often appear functionally different. For example, teeth chattering, escape jumps, and attacks can be elicited from overlapping hypothalamic subdivisions but at different current intensities, suggesting either that different neuronal clusters are activated at different current intensities or that the same neuronal cluster elicits different responses depending on the intensity of stimulation.
3.
Hypothalamic stimulation elicits behaviors only when the targets of those behaviors are present. For example, hoarding behavior occurs only when there is food to carry; feeding centers do not induce faked feeding if food is not available; aggression is evoked only when a rat is nearby, etc. Stimulation usually leads to no behavioral response if the target is missing.
4.
Last but not least, the stimulation of hypothalamic sites evokes very complex behavioral patterns. For example, when hoarding-related hypothalamic areas are stimulated, rats scan the environment, locate food, approach it, seize with teeth, and hoard it to a particular location within the cage; this behavior is repeated till all the food pellets are gathered at one and the same location. At the same time, certain elements of naturally occurring behaviors are missing when the same behavior is elicited by hypothalamic stimulation. For example, teeth chattering (a threat-like behavior) and attacks are elicited from partly overlapping but distinct hypothalamic sites, while other components of the aggressive repertoire (e.g., lateral threat) cannot be induced by hypothalamic stimulation.
The interpretation of the behavioral consequences of hypothalamic stimulation raised many controversies. Initially it was suggested that the effects of stimulation are largely mediated by passing fibers, e.g., those of the mediobasal bundle (Ranck 1975; Velley et al. 1988; Gratton and Wise 1988). It was shown, however, that hypothalamically evoked locomotor stepping persists when passing fibers are lesioned (Sinnamon 1990), but are inhibited by agents that locally inhibit synaptic transmission (López and Carrer 1985); moreover, behaviors elicited by electrical stimulation can also be induced in the very same regions by neurochemical agents that either stimulate (e.g., glutamate agonists) or disinhibit (e.g., GABA antagonists) neuronal activity (aggression: Adams et al. 1993; Haller et al. 1998a, b, c; Roeling et al. 1993; grooming: Roeling et al. 1990; locomotor stepping: Marciello and Sinnamon; 1990; feeding: Dube et al. 1999). In addition, it was recently shown that aggression can be induced from the hypothalamus by optogenetic stimulation (Lin et al. 2011). Thus, hypothalamically evoked behaviors result from local neuronal activation that propagates to a large number of brain areas involved in behavioral control by the extensive efferent connections of hypothalamic neurons as recognized very early (Anschel et al. 1982).
It was also suggested that hypothalamic stimulation affects motivational processes that result in context-dependent behavioral responses (Berridge and Valenstein 1991; Valenstein et al. 1968). This hypothesis is, however, invalidated by several arguments. For example, locomotor stepping could be elicited in anesthetized rats by glutamate injections into the lateral hypothalamus, which excludes both the “passing fiber” and the “motivational” hypothesis (Marciello and Sinnamon 1990). As it regards aggression, hypothalamic stimulation can separately elicit certain elements of aggressive behavior (e.g., teeth chattering and biting attacks), while offensive postures (e.g., lateral threat, upright boxing) and dominance are never seen in response to hypothalamic stimulation. One can argue that if stimulation increased the motivation for aggression, then the response should have included behaviors related to that particular motivational state.
Taken together, these findings demonstrate that the hypothalamus comprises neural mechanisms (“electrophysiological nuclei”) from where complex and context-dependent behaviors can specifically be evoked by electric stimulation. The hypothalamus is unique in that this is the only brain area in the rat from where biting attacks can be elicited by various means including electrical stimulation, glutamate receptor agonists, GABAA receptor antagonists, and optogenetic stimulation.
4.1.2 Hypothalamic Control of Aggression in Animals and Humans
4.1.2.1 Anatomical Aspects
This line of research was initiated by the seminal work of Hess performed in rats and cats (1928). Subsequent studies showed that the phenomenon is general: biting attacks can be elicited by hypothalamic stimulation in virtually all the species studied so far, suggesting that this mechanism of aggression control is evolutionarily conserved (e.g., cats: Romaniuk 1965; chicken: Putkonen 1966; cichlid fish: Demski 1973; guinea pig: Martin 1976; humans: Bejjani et al. 2002; lizards: Sugerman and Demski 1978; monkeys: Lipp 1978; mice: Lin et al. 2011; opossum: Roberts et al. 1967; rats: Vergnes and Karli 1969; Kruk et al. 1979). In lizards at one extreme, aggression can be induced from several brain areas while at the other extreme the hypothalamus is the only area from where attacks can reliably be elicited in rats (Kruk 1991). Hypothalamic structures subserving attack were best described in cats and rats, and substantial evidence is available in mice, hamsters, and humans; therefore, we will focus on these species.
The stimulation of the hypothalamus evokes two types of aggression in cats, namely defensive rage and predatory attacks. The former consists of threatening vocalizations and postures and strikes upon provocation. Predatory attack also called quiet biting involves the killing of pray (e.g., a rat) by biting the back of its neck without vocalizations or threat postures (Siegel et al. 1999). Hypothalamic structures controlling defensive rage and predatory aggression are topographically and functionally separated: the relevant hypothalamic structures (ventral/medial and lateral to the fornix, respectively) are not only behaviorally specific, but the two areas also inhibit each other (Cheu and Siegel 1998) (Fig. 4.1). Topographic organization is also revealed by the distinct neural connections and pharmacology of the two regions (Brutus and Siegel 1989; Shaikh et al. 1984; Siegel et al. 1999, 2007). The interpretation of hypothalamically evoked behaviors needs some additional interpretation especially in conjunction with behaviors elicited from analogous hypothalamic structures of rodents. “Rage” induced from ventral/medial areas of the hypothalamus is usually considered a defensive response, the main component of which is hissing that is executed by, and in parallel with, the opening of the jaws. This interpretation involves that the cat hypothalamus contains no mechanisms for attacks on conspecifics, in sharp contrast to all other mammals where such attacks can readily be evoked. We believe, however, that this strange conclusion derives from the specific conditions under which this type of studies is performed. In rats, stimulation is always performed in the presence of a potential opponent; in cats, this element is missing probably because of ethical reasons; carnivores can inflict heavy damage on opponents. Nevertheless, one can reasonably assume that attacks were performed if an opponent was present, and the jaws opened for hissing were sooner or later closed for biting. This is supported by the behavioral similarity of the initial phases of intraspecific contests and “defensive rage.” Consequently we assume that areas involved in “defensive rage” are in fact components of the system that controls “affective aggression.” In the following we will prefer the latter over the former phrase.
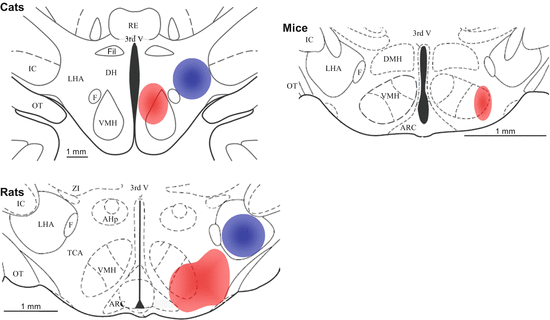
Fig. 4.1
The anatomical localization of hypothalamic attack sites in three species. Red, affective/rivalry aggression; blue: predatory attacks (not known in mice); 3rd V 3rd ventricle; AHp anterior hypothalamic nucleus, posterior part; ARC arcuate nucleus; DH dorsal hypothalamic area; DMH dorsomedial hypothalamic nucleus; F fornix; Fil nucleus filiformis; IC internal capsule; LHA lateral hypothalamic area; OT optic tract; PVN paraventricular hypothalamic nucleus; RE nucleus reuniens; VMH ventromedial hypothalamic nucleus; TCA tuber cinereum; ZI zona incerta. Based on Siegel et al. (1999), Lammers et al. (1988) and Lin et al. (2011)
The study of hypothalamic structures involved in attack followed a different trajectory in the rat. The precise location and pharmacological responsiveness of the mediobasal hypothalamus (called “hypothalamic attack area”) was described in detail, while brain areas involved in predatory aggression received less attention. Similar to cats, attacks on conspecifics can be induced in rats by the stimulation of the mediobasal hypothalamus, which is located ventral and medial to the fornix and includes the posterior part of the anterior hypothalamus, the relatively cell-sparse region extending from the fornix to the third ventricle, and the ventrolateral aspects of the ventromedial hypothalamus (Kruk et al. 1979; Kruk 1991; Lammers et al. 1988). Later studies demonstrated that spontaneous aggression induces c-Fos activation in the very same region (Halasz et al. 2002a); moreover, the unilateral electric stimulation of the mediobasal hypothalamus induces attacks only when the contralateral side is also activated in a manner, and to the extent, similar to that seen in spontaneous aggression (Halasz et al. 2002b). The presence of predatory attack sites was also demonstrated in rats. For example, the electrical and neurochemical stimulation of the lateral hypothalamic area induces frog and/or mouse killing (Vergnes and Karli 1969; Smith et al. 1970; Bandler 1970; Woodworth 1971), and recent findings from our laboratory show that the lateral hypothalamus is strongly activated by mouse killing (Tulogdi et al. 2014). However, the topographic organization of the two types of aggression may not be as distinct as in cats. Some of the early studies revealed that the stimulation of the lateral hypothalamus does induce attacks on conspecifics albeit this response required considerably larger current intensities than muricide (Woodworth 1971). Although no attacks on conspecifics were induced from the lateral hypothalamus in other labs (Kruk 1991; Siegel et al. 1999), it was shown that the stimulation of the lateral hypothalamus promotes spontaneous attacks under certain circumstances (Koolhaas 1978). The assumption that the lateral hypothalamus is involved in intraspecific aggression is also supported by c-Fos and brain imaging studies showing that the lateral hypothalamic area is activated during resident-intruder conflicts (Clinton et al. 2011; Ferris et al. 2008; Tulogdi et al. 2010). Taken together, these findings show that intraspecific aggression and predatory aggression are controlled by hypothalamic areas medial and lateral to the fornix, respectively, but the two mechanisms’ area not as distinct as in the cat.
It was recently demonstrated that the optogenetic stimulation of the lateral aspects of the ventromedial nucleus rapidly induces coordinated and directed biting in mice (Lin et al. 2011). Although bites were elicited from a very restricted hypothalamic area in the mouse, a wider array of hypothalamic mechanisms are activated by territorial aggression in this species, suggesting that many hypothalamic structures analogous to the rat hypothalamic attack area are also involved in mouse aggression (e.g., the posterior part of the anterior hypothalamus, the ventrolateral nucleus of the hypothalamus, and the tuber cinereum; Duncan et al. 2009; Haller et al. 2006). It was also shown that individual variation in estrogen receptor α immunoreactivity in the anterior hypothalamus (part of “hypothalamic attack area” in rats) is positively correlated with aggressive behavior in mice (Trainor et al. 2006). Moreover, some findings suggest that the lateral hypothalamus also plays a role in mouse aggression (Duncan et al. 2009; Hasen and Gammie 2006). Taken together, these findings suggest that mouse aggression is controlled by hypothalamic structures analogous to those controlling aggression in rats.
In hamsters, the location and extent of hypothalamic structures involved in aggressiveness were not precisely delimited, but it is believed that the key regions are the anterior and lateral hypothalamic areas which control intraspecific attacks (Ferris and Delville 1994; Knyshevski et al. 2005).
Evidence on the involvement of the human hypothalamus in aggression came from the study by Sano et al. (1970) who lesioned posteromedial regions of the hypothalamus, which reduced or abolished aggressiveness in violent patients (Fig. 4.2). The lesioned region included medial parts of the hypothalamus and the medial subdivision of the lateral hypothalamus. These findings were replicated by many other studies (Dieckmann et al. 1988; Laitinen 2001; Pedrosa-Sanchez and Sola 2003; Ramamurthi 1988). A case study suggested that the electrical stimulation of the very same area induces aggressiveness (Bejjani et al. 2002). The behavioral response was similar to that seen in animals as it occurred within seconds, and had no post-stimulation effects on aggression. Importantly, the patient although clearly remembered it was not able to explain his/her behavior, suggesting that the hypothalamically evoked aggressiveness had no obvious cognitive aspect. The role of the human hypothalamus in aggression control was supported by recent studies showing that the continuous stimulation of the “triangle of Sano” for month and years suppresses aggression in patients with intractable aggression (Franzini et al. 2005, 2010; Hernando et al. 2008). At the first sight, reduced violence obtained by the Sano and the Franzini approaches is intriguing, as lesions and stimulations were targeted to very similar hypothalamic sites. It is believed, however, that deep brain stimulation is in fact a functional lesion (Bennazzous and Hallett 2000); high-frequency stimulation can rapidly render neurons inactive by a phenomenon called stimulation-induced inhibition of depolarization. High-frequency stimulations may even lesion the area if performed over prolonged periods. Thus, the Sano and Franzini procedures are very similar in their ultimate neural outcome. An interesting example of hypothalamic aggression control is the hypothalamic hamartoma. A subgroup of patients developing this malformation show increased aggression, while the removal of the affected hypothalamic parts abolishes aggressiveness (de Almeida et al. 2008; Weissenberger et al. 2001). The impact of hamartomas on hypothalamic function is poorly known, but the findings with this malformation show that hypothalamic functions are tightly linked to aggression in humans. This assumption is further supported by a brain imaging study performed in females exposed to threatening stimuli; a significant activation of the hypothalamus was noticed (Hermans et al. 2008).
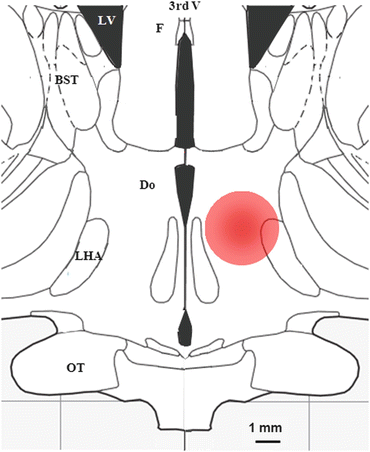
Fig. 4.2
The anatomical localization of hypothalamic lesions that reduce aggression in severely violent patients. 3rd V 3rd ventricle; BST bed nucleus of stria terminalis; Do dorsal hypothalamic nucleus; LHA lateral hypothalamic area; LV lateral ventricle; F fornix; OT optic tract. Note the marked similarity in location and size with the areas from where aggression can be induced by electrical stimulation (Fig. 4.1)
Taken together, these findings suggest that there is a region in the human hypothalamus that controls aggressiveness, and disparate findings suggest that this area responds to stimulation in a manner similar to that seen in laboratory animals.
4.1.2.2 Neurochemical Aspects
In the cat, the affective aggression-bound medial hypothalamus is stimulated from upstream by substance P-ergic medial amygdala neurons; its “execution-bound” downstream outputs to the periaqueductal gray are glutamatergic (Siegel et al. 1999, 2007). Inhibitory outputs to the lateral hypothalamus are GABAergic. The mediobasal hypothalamus also receives facilitatory noradrenergic, dopaminergic, and cholinergic inputs and inhibitory serotonergic inputs. The role of serotonin appears complex as effects exerted via different receptors (e.g., 5-HT1A and 5HT2C) affect aggression in an opposite fashion (Hassanain et al. 2003; Siegel et al. 1999). The neurochemical nature of lateral hypothalamic neurons is known in less detail.
The rat mediobasal hypothalamus (involved in attacks on conspecifics) contains both glutamatergic and GABAergic neurons that have a distinct localization within the area (Hrabovszky et al. 2005). The same study showed that a subgroup of glutamatergic neurons also expresses thyrotropin-releasing hormone, the role of which remains unclear at present. From upstream, the system is activated by substance P neurons located in the medial amygdala, a mechanism that seems very similar to that seen in cats (Halasz et al. 2008, 2009). Local glutamatergic neurons are responsible for the induction of attacks, whereas GABAergic mechanisms locally inhibit them (Adams et al. 1993; Haller et al. 1998a, b, c; Roeling et al. 1993). Hypothalamic attack is under the control of several other factors, namely serotonin (local inhibition; Kruk 1991) and vasopressin (stimulation; Caffrey et al. 2010; Ferris et al. 2008). The latter mechanism is sensitive to testosterone (Trainor et al. 2006).
In hamsters, the anterior hypothalamus (i.e., the “hypothalamic attack area” in this species) is under the control of vasopressinergic inputs (Albers et al. 2006; Ferris and Delville 1994; Ferris and Potegal 1988) that seem to integrate other neurochemical and hormonal influences, namely those of serotonin and testosterone (Delville et al. 1996; Ferris et al. 1997). Attack-related hypothalamic mechanisms are also sensitive to the local application of glucocorticoids (Hayden-Hixson and Ferris 1991a, b).
4.1.2.3 Overview
The hypothalamus hosts cell groups that are critically involved in the induction of attack behavior. Two regions of interest were identified, each being involved in a specific form of attack. The medial parts of the hypothalamus induce attacks on conspecifics, while lateral parts induce attacks on prey. While the two mechanisms are distinct in cats, the lateral hypothalamus seems to have a somewhat mixed role in rodents. Hypothalamic mechanisms are also involved in the control of human aggression.
Hypothalamic mechanisms appear to be controlled by substance P from upstream (particularly from the medial amygdala) and send glutamatergic projections downstream. The functioning of attack-bound hypothalamic mechanisms is controlled by inputs that utilize acetylcholine, dopamine, GABA, noradrenaline, serotonin, and vasopressin as neurotransmitters. Notably, these are the neurochemical mechanisms that are believed to control aggression overall; the studies reviewed above suggest that they have local impacts at the level of aggression-bound hypothalamic structures. Testosterone and glucocorticoids also have a role at this level. Neurochemical and neuroendocrine data in humans are sparse, but the available findings are in line with those obtained in animals.
4.1.3 Hypothalamic Mechanisms of Abnormal Aggression in Animals1
4.1.3.1 Overall Activation of the Hypothalamus
One approach to the study of brain control is the elucidation of overall activities seen in particular brain areas. “Overall” means here that neuron types, neurochemical agents, receptors, etc., are not distinguished; the technique provides indistinct information on the level of activation. This is one of the main approaches in human brain imaging techniques; their rodent analogs are c-Fos studies or other studies of this kind.2
One may have expected that hypothalamic structures involved in attack were overactivated in abnormal aggression if the “hyperactivation theory” was right, i.e., if abnormal aggression resulted from the exacerbated activation of aggression-controlling brain mechanisms. However, hypothalamic mechanisms controlling attack undergo interesting, sometimes surprising, changes in rodent models of abnormal aggression.
In some models, the expected changes were seen. The mediobasal hypothalamus was overactivated by aggression in four models, namely in the postweaning social isolation, anabolic steroid, and cocaine models, as well as in rats selected for low anxiety (Toth et al. 2012; Ricci et al. 2007; Knyshevski et al. 2005; Beiderbeck et al. 2012). As it regards the lateral hypothalamus (implicated mainly in predatory attacks), increased activation was seen in three models (the glucocorticoid dysfunction and cocaine model, as well as in low-anxiety rats) (Beiderbeck et al. 2012; Knyshevski et al. 2005; Tulogdi et al. 2010).
In other models, however, no changes in mediobasal hypothalamic activation were seen, but the lateral hypothalamus was activated where this area was investigated. Such findings were observed in the glucocorticoid dysfunction model, in mice selected for high aggressiveness, and in rats selected for high anxiety (Beiderbeck et al. 2012; Haller et al. 2006; Halasz et al. 2002a; Tulogdi et al. 2010). Lateral hypothalamic activation was not increased in rats selected for high anxiety and those submitted to postweaning social isolation (Beiderbeck et al. 2012; Toth et al. 2012). In rats selected for high anxiety, neither the mediobasal nor the lateral hypothalamus was overactivated despite clearly abnormal attack patterns (Beiderbeck et al. 2012).
Interestingly, this pattern of activity and nonactivity overlaps with the emotional responses associated with these models of abnormal aggression. The mediobasal hypothalamus was overactivated mainly in models where aggression is associated with hyperarousal, e.g., the postweaning social isolation and cocaine models both being characterized by increased glucocorticoid and autonomic stress responses (Ansah et al. 1996; Moldow and Fischman 1987; Toth et al. 2011). In contrast, the mediobasal hypothalamus was not activated in models characterized either by low glucocorticoid and autonomic stress responses or by low basal glucocorticoid levels and heart rates i.e., by hypoarousal (rat: Haller et al. 2001, 2004; mice: Caramaschi et al. 2008a, b; Veenema et al. 2004). Although aggression-induced autonomic activation was not directly investigated in rats selected for anxiety, studies on glucocorticoids support the assumption that hypo- and hyperarousal during aggressive confrontations have an impact on the activation of hypothalamic centers involved in attack. In highly anxious rats that attacked vulnerable targets, the glucocorticoid response to resident-intruder conflicts was decreased and no aggression-induced hypothalamic activation was noticed (Neumann et al. 2010). In the low-anxiety strain that showed vulnerable attacks and also attacked females and anesthetized opponents, the glucocorticoid response to resident-intruder conflicts increased, and the hypothalamus was strongly activated by fights.
The findings briefly reviewed above suggest that hypoarousal-associated aggression does not, while hyperarousal-associated aggression does correlate with increased mediobasal hypothalamic activation. This relationship is illustrated in Fig. 4.3 by the comparison of the glucocorticoid deficiency postweaning social isolation models. The direct comparability of these models is ensured by the consistency of behavioral and neuroanatomical analysis, as the findings were obtained by the same group. In the hypoarousal model, normal attack counts but abnormal attack features are associated with a “predatory-like” hypothalamic activation pattern (normal mediobasal but increased lateral hypothalamic activation; Tulogdi et al. 2010). In contrast, exacerbated “rivalry-like” hypothalamic activation pattern was seen in the postweaning social isolation (hyperarousal) model (increased mediobasal but normal lateral hypothalamic activation; Toth et al. 2012). Unfortunately, evidence on predation-related hypothalamic control mechanisms is lacking in mice, while the arousal component of aggression is poorly known in other models. Nevertheless, the findings briefly reviewed above and the example summarized in Fig. 4.3 suggests that the emotional component of abnormal attacks has a large impact on the hypothalamic control of aggression.
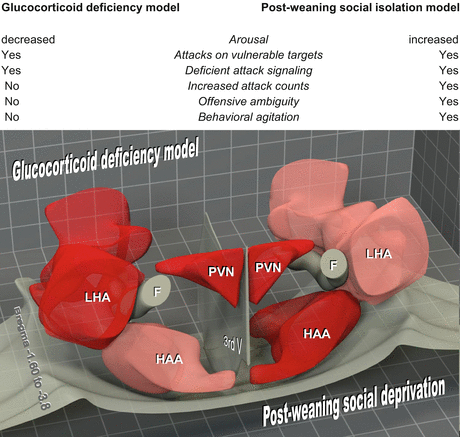
Fig. 4.3
Associations between emotionality and aggression-induced hypothalamic activation patterns as illustrated by the comparison of the glucocorticoid deficiency and post-weaning social isolation models (Tulogdi et al. 2010; Toth et al. 2012). The models are directly comparable as subjects were rats in both cases, and behavioral and neuroanatomical analysis was highly consistent (the findings were obtained by the same group). Upper panel: emotional and behavioral characteristics in the two models. Lower panel: 3D reconstruction of the relevant hypothalamic region. Pink activation similar to controls; red over-activation compared to controls; 3rdV 3rd ventricle; F fornix; HAA hypothalamic attack area (mediobasal hypothalamus); LHA lateral hypothalamic area; PVN paraventricular hypothalamic nucleus
4.1.3.2 Serotonin
The “serotonin hypothesis” is considered a cornerstone of aggression control (Nelson and Chiavegatto 2001). Theoretically, abnormal aggression may be driven by decreased serotonergic control, which would indirectly upregulate the function of brain mechanisms that promote aggression. However, the role of hypothalamic serotonin is unexpectedly complex in models of abnormal aggression.
In the mouse variant of the postweaning social isolation model, rats submitted to maternal separation as well as anabolic steroid-treated hamsters, findings support the notion that serotonin suppresses aggression. In these models, serotonin fiber density and/or the density of various serotonin receptors decreased in the mediobasal hypothalamus that is involved in the control of rivalry attacks (Bibancos et al. 2007; Grimes and Melloni 2002, 2005; Ricci et al. 2006; Veenema et al. 2006). Some contradictions do exist; e.g., 5HT1A receptor density decreased in hamsters treated with anabolic steroids, but remained unchanged in mice submitted to postweaning social isolation (Bibancos et al. 2007; Ricci et al. 2006). Overall, however, a decrease in hypothalamic serotonin functions is evident in these models.
In sharp contrast with the aforementioned models, hypothalamic 5-HT1B and 5-HT2A receptor mRNA levels doubled in mice submitted to the alcohol model (Chiavegatto et al. 2010). Hypothalamic 5-HT6 receptor expression also doubled in the anabolic steroid model (Ambar and Chiavegatto 2009), while the density of serotonin fibers and the number of serotonergic varicosities increased in the anterior hypothalamus of hamsters submitted to the subjugation model (Delville et al. 1998; Ferris and Potegal 1988). Similar findings were obtained with N-type Ca channel alpha1B subunit-KO mice where attack counts increased over five times, yet the serotonin content of the hypothalamus doubled without parallel increases in hypothalamic noradrenaline and dopamine (Kim et al. 2009).
One has to conclude that while hypothalamic serotonin undergoes the expected changes in some models, certain forms of abnormal aggression are associated with increased serotonergic neurotransmission in the hypothalamus. Findings with the postweaning social isolation and alcohol models are especially intriguing; as the subjects were mice in both cases, the findings were obtained by an overlapping set of authors, and the immunocytochemical methodologies were highly similar (Fig. 4.4). One can argue that the intriguing changes seen at hypothalamic level were “overwritten” by reduced serotonergic neurotransmission in other brain areas, e.g., the prefrontal cortex (Chiavegatto et al. 2010). However, this argument does not hold true for two reasons. First, increased serotonergic neurotransmission in abnormally aggressive animals was seen in extra-hypothalamic sites as well. For example, Delville et al. (1998) observed increased number of septal 5-HT varicosities in the hamster “subjugation” model. Chiavegatto et al. (2010) showed that in addition to the hypothalamus, the expression of 5-HT1B receptors was increased in the amygdala of mice that showed excessive increases in aggression after alcohol, while Bibancos et al. (2007) reported increased 5-HT6 receptor expression in the hippocampus of mice submitted to the postweaning isolation model. Second, paradoxical associations were also noticed when neurotransmitter/behavior correlations were investigated. There was no significant correlation between raphe serotonergic activation and aggressiveness in the hypoarousal model which was in sharp contrast with data obtained in controls (Haller et al. 2005a, b). In addition, the 5-HT1A partial agonist buspirone ameliorated normal (rivalry) aggression but dramatically increased attack counts in the glucocorticoid deficiency model (Haller et al. 2007). In a similar fashion, there was no obvious link between serotonergic neurotransmission and aggressiveness in mice selected for aggressiveness (Natarajan et al. 2009a, b, c; Wallinga et al. 2009). Moreover, 5-HT1A and 5-HT1B agonists decreased aggressiveness in highly aggressive feral rats by decreasing serotonin release via their presynaptic autoreceptor function (de Boer and Koolhaas 2005).
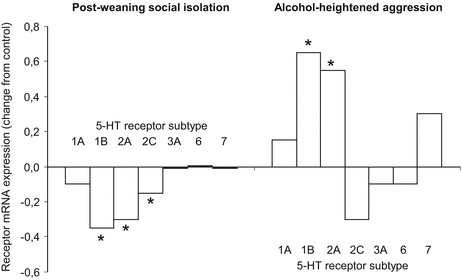
Fig. 4.4
Serotonin neurotransmission often shows opposite changes in different models of abnormal aggression as illustrated by a comparison between the post-weaning social isolation and the alcohol model of abnormal aggression. The two models are directly comparable as the subjects were mice in both cases, the immunocytochemical methodologies were highly similar, and the findings were obtained by an overlapping set of authors. The figure was compiled from data published by Bibancos et al. (2007) and Chiavegatto et al. (2010). The Y-axis shows the difference between transcript amounts obtained in the experimental groups and their controls. *Significantly different from controls in the respective publications
Taken together, these findings demonstrate that the anti-aggressive effects of serotonergic neurotransmission are compromised in certain models of abnormal aggression; moreover, serotonin may paradoxically promote aggressiveness in some models. Most importantly, these paradoxical interactions were seen in models where abnormal aggression was associated with hypoarousal (blunted cortisol response to aggression in subjugated hamsters: Ferris et al. 2005; low basal corticosterone after adolescent anabolic steroid treatment: Rejeski et al. 1990; low corticosterone stress responses and low basal heart rate in mice selected for high aggressiveness: Caramaschi et al. 2008a, b; Veenema et al. 2004; low basal CORT and low autonomic responses to aggression in the rat glucocorticoid dysfunction model: Haller et al. 2001, 2004).
4.1.3.3 Vasopressin
Vasopressin plays important roles in aggression control (see above); as such, one can hypothesize that increased vasopressin neurotransmission promotes abnormal forms of aggression. This, however, is not always the case.
Vasopressin neurotransmission appears to promote abnormal manifestations of aggression in several models. The interaction has many facets. In the anabolic steroid model, the expression of the V1A vasopressin receptor increased in the ventrolateral but not in the anterior hypothalamus (DeLeon et al. 2002). Despite this, V1A antagonists administered into the anterior hypothalamus decreased the anabolic steroid-induced aggression (Harrison et al. 2000). In the amphetamine model, V1A expression increased in the anterior hypothalamus, and V1A antagonists abolished amphetamine-induced aggression (Gobrogge et al. 2009). V1A antagonists also abolished exacerbated aggression in the cocaine model, where an increased stimulation-induced vasopressin release was noticed without changes in vasopressin content or vasopressin fiber density (Jackson et al. 2005). In the maternal separation model (the only rat study addressing hypothalamic vasopressin), no change in vasopressin expression was noticed in the anterior hypothalamus, but vasopressin expression (both basal and aggression induced) increased in the lateral hypothalamus (Veenema et al. 2006). Despite this variability of findings, increased vasopressin functions are evident in these models.
Changes seen in other models were opposite to expectations. Decreased anterior hypothalamic vasopressin content and decreased vasopressin fiber density was noticed in the subjugation model (Delville et al. 2000). Gene polymorphism studies suggest similar changes in rats selected for anxiety. Low-anxiety rats express a vasopressin gene that has a reduced transcription rate, and consequently vasopressin production is lower in this than in the high-anxiety strain (Bunck et al. 2009; Kessler et al. 2007). The low-anxiety strain showed more disturbed attack patterns than the high-anxiety strain; consequently, higher abnormality of aggression was associated with a lower hypothalamic vasopressin levels.
Similar to overall activation levels and serotonin neurotransmission, the role of hypothalamic vasopressin in abnormal aggression seems model dependent. While it clearly promotes abnormal aggression in the anabolic steroid, amphetamine, cocaine, and maternal separation models, the opposite is true for the subjugation model and rats selected for low-anxiety behavior.
4.1.3.4 Other Neurotransmitters
There are neurotransmitter systems that were studied in one or a few models only. This does not diminish the importance of the findings, or the relevance of the respective systems for abnormal aggression, but the various models of abnormal aggression cannot be compared in their case. For example, the impact of substance P neurotransmission (the effects of which are mediated by neurokinin 1 (NK1) receptors) was investigated in the glucocorticoid dysfunction model only (Halasz et al. 2008, 2009). In this model, mediobasal hypothalamic neurons expressing NK1 receptors were specifically overactivated by aggressive encounters; moreover, the systemic application of NK1 blockers or the selective destruction of NK1 receptor expressing mediobasal hypothalamic neurons by saporin-conjugated substance P dramatically reduced violent biting, without affecting milder forms of aggression. Thus, NK1-expressing mediobasal hypothalamic neurons appear specifically involved in abnormal features of aggression in this model.
In the anabolic steroid model, dopamine production by the circular and medial supraoptic nuclei of the hypothalamus was increased, and the expression of D2 dopamine receptors was increased in the anterior hypothalamus (the attack area in the species studied; Ricci et al. 2009; Schwartzer et al. 2009). Thus, dopamine neurotransmission may be another mechanism that promotes abnormal aggression at hypothalamic level.
Finally, the role of glutamatergic and GABAergic neurotransmission was also investigated in a few models. In the hamster anabolic steroid model, glutamate synthesis increased in both the anterior and lateral hypothalamus, but equivocal changes were noticed at the level of their projections (Carrillo et al. 2009; Fischer et al. 2007). The role of GABA was investigated in the anabolic steroid model (Grimes et al. 2003; Schwartzer et al. 2009), in the cocaine model (Ricci et al. 2005), and in mice selected for high aggressiveness (Weerts et al. 1992). In the latter model, findings were in line with expectations: GABA binding was increased in low aggression genotype and was decreased in the highly aggressive genotype. In the former two models, however, increased GABA synthesis was noticed in the anterior hypothalamus despite the fact that GABA agonists inhibit rivalry aggression when infused into mediobasal hypothalamic sites (Adams et al. 1993; Roeling et al. 1993).
The above findings reveal that GABAergic mechanisms may also differentiate certain models of abnormal aggression. Comparative data are not available for substance P, dopamine, and glutamate, but the available findings show that they are also relevant from the point of view of hypothalamic mechanisms involved in abnormal aggression.
4.1.4 The Human Case
Unfortunately, human data on the role of the hypothalamus in abnormal forms of aggression are extremely scarce. It was shown in psychopaths that hypothalamic activation correlates positively with aggressiveness shown in the Taylor Aggression Paradigm and the response correlated with increased anger (Veit et al. 2010). An earlier study performed by the same set of authors and employing similar techniques showed no such a correlation in healthy controls (Lotze et al. 2007). As anger per se does not induce hypothalamic activation (Damasio et al. 2000), these findings suggest that the delivery of severe punishment correlates with increased hypothalamic activation in psychopaths but not in healthy subjects. A very recent publication showed that gray matter was increased in the hypothalamus of borderline personality patients, and this increase correlated positively with the history of traumatization (Kuhlmann et al. 2013). As symptomatology included high levels of aggression among the subjects of this study, this finding tentatively suggests that traumatic experience results in increased hypothalamic gray matter, which contributes to the expression of aggressiveness. In another study, borderline personality patients showed decreased serotonergic functions in the hypothalamus (Koch et al. 2007).
The above findings are consistent with the assumption that the hypothalamus contributes to the expression of abnormal aggression in humans, while serotonergic neurotransmission is a negative modulator of such interactions. In alcoholic people charged with domestic violence, however, glucose metabolism decreased in the hypothalamus (George et al. 2004). While interactions with alcoholism cannot be ruled out, no similar change was obtained in nonviolent alcoholics.
The scarcity of data precludes firm conclusions on the role of the hypothalamus in aggression-related psychopathologies in humans. In addition, the spatial resolution of current brain imaging techniques does not distinguish the various subregions of the hypothalamus, which have rather different roles in brain function and behavior. Tentatively, however, data suggest that aggression-related psychopathologies are associated with increased hypothalamic gray matter volume, increased hypothalamic activation during retaliation, and decreased serotonergic control at the level of the hypothalamus. As the aggressiveness of psychopaths correlated with anger that was induced by the experimental punishment received, while borderline patients show signs of hyperarousal in terms of both glucocorticoid production and autonomic activation (Carvalho et al. 2012; Lyons-Ruth et al. 2011; Weinberg et al. 2009), the above inference seems to be valid to emotional/reactive (hyperarousal-driven) aggression.
One study found a different kind of interaction suggesting that the role of the hypothalamus in abnormal human aggression replicates the diversity seen in animals.
4.1.5 Overview: Etiological Factor-Dependent Alterations in the Hypothalamus
At the first sight, models of abnormal aggression provided conflicting data regarding the role of the hypothalamus. However, discrepancies disappeared when the emotional background of subjects was taken into account (Table 4.2 3). This grouping and limited data on the lateral hypothalamus suggest that abnormal aggression is associated with two basic patterns of aggression-induced hypothalamic activation:
Table 4.2
Functional changes in mediobasal hypothalamic regions in models of abnormal aggression and aggression-related psychopathologies
Model | c-Fos | 5-HT | AVP | NK1 | GLU | GABA | DA | Arousal |
|---|---|---|---|---|---|---|---|---|
Postweaning social isolation | ⇑ | ⇓* | High | |||||
Selection for low anxiety | ⇑ | High | ||||||
Early maternal separation | ⇓ | ⇔ | High | |||||
Cocaine in adolescence | ⇑ | ⇑ | ⇑ | High | ||||
Amphetamine in adolescence | ⇑ | High | ||||||
Psychopaths (moderate level) | ⇑†* | High†† | ||||||
Borderline personality disorder | ⇑‡ | ⇓* | High‡‡ | |||||
Selection for high anxiety | ⇔ | Low | ||||||
Selection for high aggression | ⇔ | ⇓ | Low | |||||
Glucocorticoid deficiency | ⇔ | ⇑ | Low | |||||
Social subjugation in adolescence | ⇑* | ⇓ | Low | |||||
Anabolic steroid during adolescence | ⇑ | ⇓ | ⇑ | ⇑ | ⇑ | ⇑ | Unknown | |
Acute alcohol | ⇑* | Unknown |
1.
When abnormal aggression is performed on the background of increased arousal, the overall activation of the mediobasal hypothalamus increases, the serotonergic control of the hypothalamus diminishes, and hypothalamic vasopressinergic neurotransmission increases.
2.
In aggression models associated with low arousal, the lateral but not the mediobasal hypothalamus is overactivated, the anti-aggressive effects of serotonergic neurotransmission appear lost, and vasopressinergic neurotransmission decreases.
Thus, the hypothalamic backgrounds of various forms of abnormal aggression show qualitative differences, suggesting that there are alternative “neurobiological roads” to abnormal aggression.
4.2 The Prefrontal Cortex
4.2.1 Prefrontal Anatomy of Violence: A Prelude
The prefrontal cortex is the headquarters of higher judgment that hosts the neuronal fingerprints of personality and temperament (DeYoung et al. 2010; Whittle et al. 2006). Its role in shaping aggressive personalities was recognized rather early mainly based on personality changes that follow its partial destruction; such studies were pioneered by the famous nineteenth-century case of Phineas Gage (Blumer and Benson 1975). Brain imaging studies enhanced understanding by establishing associations between structural and/or functional deficits located within the prefrontal cortex on one side and aggression histories and aggression-related psychopathologies on the other. The two types of studies nicely complement each other; while prefrontal lesions increase aggression, brain imaging studies reveal prefrontal deficits in aggressive people. The coherence and significance of these findings propelled the area in the forefront of aggression research, and the inhibitory control of aggression by the prefrontal cortex became a cornerstone of understanding aggression control. In sharp contrast with these human findings, aggressive behavior activates the prefrontal cortex in animals; moreover, the activation is stronger in models of abnormal aggression. These findings cannot be ascribed to species differences because very similar findings were obtained in humans. While a history of aggression does correlate with prefrontal deficits, aggressive behaviors performed during brain imaging activate the prefrontal cortex; moreover, activations correlate positively with the level of aggressiveness. In addition to this marked discrepancy, a closer look shows that brain lesion and brain imaging studies are not as consistent as generally thought. The location of aggression-inducing prefrontal damages—accounted for by clinical investigations—and aggression-related prefrontal deficits, as revealed by brain imaging studies, does not overlap as a rule. The same is valid for brain imaging studies themselves: very different patterns of prefrontal dysfunctions were seen in highly similar subjects studied by highly similar techniques and sometimes by overlapping sets of investigators. While deficits were almost always seen within the large brain area called prefrontal cortex, every study revealed a unique patchwork of deficient regions. Overall, one cannot question the role of the prefrontal cortex in aggression control, and this brain area may indeed bear the fingerprints of aggressive personalities. However, the fingerprint is rather blurred at present.
Due to such discrepancies, this section will have a specific structure. First, we will overview the general view, after which we will cross-check them with the available findings. This will be followed by an attempt to create an alternative view
4.2.2 An Overall Summary of the General View
Arguments supporting the view that the prefrontal cortex inhibits aggression are apparently overwhelming. The main lines of reasoning are as follows:
1.
Lesions placed within this brain area increase aggression in animals (rats: de Bruin et al. 1983; Kolb 1974; Rudebeck et al. 2007; monkeys: Izquierdo 2005; Machado and Bachevalier 2006), and similarly, accidental prefrontal lesions result in increased aggression in humans (Anderson et al. 1999; Barrash et al. 2000, 2011; Bear and Fulop 1987; Blair and Cipolotti 2000; Blumer and Benson 1975; Luria 1980; Max et al. 2006; Pardini et al. 2011; Sarazin et al. 2003; Shamay-Tsoory et al. 2010; Tranel et al. 2002). In addition, prefrontal damage leads in humans to increased anger and irritability, impulsivity, deficits in recognizing the intentions of social partners, as well as indifference to rules and lack of moral reasoning, all being features that increase the likelihood of engagement in aggressive acts (Anderson et al. 1999; Bear and Fulop 1987; Berlin et al. 2004, 2005; Blumer and Benson 1975; Sarazin et al. 2003; Shamay-Tsoory et al. 2010).
2.
Brain imaging studies show prefrontal deficits in aggressive people. Such deficits were seen in (1) aggression-related psychopathologies (e.g., antisocial and borderline personality disorders, disruptive behavior, psychopathy) (Birbaumer et al. 2005; Boccardi et al. 2011; Carrasco et al. 2012; Ermer et al. 2013; Fahim et al. 2011; Goethals et al. 2005; Goyer et al. 1994; Gregory et al. 2012; Hazlett et al. 2005; Hirono et al. 2000; New et al. 2002; Raine et al. 1992, 1994, 1997, 2000, 2011; Soloff et al. 2003; Tiihonen et al. 2008), (2) violent patients showing other disorders (drug abuse: Payer et al. 2011; epilepsy: Juhász et al. 2001; mental retardation: Critchley et al. (2000); various psychiatric disorders; patients studied together: Antonucci et al. 2006; Gansler et al. 2011; Volkow et al. 1995), and (3) violent offenders (Amen et al. 1996; Boes et al. 2008; Ducharme et al. 2011; Mehta and Beer 2010; Meyer-Lindenberg et al. 2006; Pardini and Phillips 2010; Passamonti et al. 2006). Findings in animals are in conflict with human data in this respect, but basic strategies in the two research areas are substantially different. This issue will be discussed below.
3.
4.
Prefrontal deficits were associated with psychological features, which likely increase the propensity to behave aggressively: poor ability to recognize emotions or the valence of social interactions, poor cognitive control over behavior, inability to take appropriate moral decisions, and feelings like anger, social anxiety, and impulsiveness (Bergvall et al. 2001; Best et al. 2002; Birbaumer et al. 2005; Deckel et al. 1996; Dowson et al. 2004; Dinn and Harris 2000; Fulwiler et al. 2012; Gansler et al. 2011; Goyer et al. 1994; Heekeren et al. 2003; Matsuo et al. 2009; Pardini and Phillips 2010; Passamonti et al. 2012; Potts et al. 2006; Sala et al. 2011; Sheng et al. 2010; Spitzer et al. 2007; Soloff et al. 2003). Impulsivity, social anxiety, cognitive set shifting, inhibitory control, and decision making were all associated with prefrontal functions in animals; thus, human and animal studies provide quite consistent findings in this respect (Cambon et al. 2010; Chudasama et al. 2012; Dalley et al. 2002; Kamigaki et al. 2012; Paine et al. 2013; Prinssen et al. 2012; Sagvolden 2006).
The findings briefly reviewed above strongly point to the conclusion that the prefrontal cortex exerts an inhibitory control over aggression. Overall, the conclusions of animal and human studies are quite similar and together resulted in the “prefrontal deficit theory” of aggression.
4.2.3 Problems with the General View
4.2.3.1 Size
The findings summarized above seem harmonious at the first sight, but a closer scrutiny reveals that they are fundamentally incongruent. Problems start already with the size of this brain area. While the human prefrontal cortex is delimited in various ways by various authors (for contrasting delimitations, see Critchley et al. 2000; Barrash et al. 2000; Raine et al. 1997, 2011; Davidson et al. 2000), it can be considered very large according to any of the delimitations. For the purposes of this review, we summed up the various views of the authors reviewed here and corroborated these with the brain atlas of Mai et al. (1998) (Fig. 4.5a). As seen on the figure, the brain area generally considered the “prefrontal cortex” makes up more than one-third of the neocortex. It is rather difficult to imagine how such a large brain area can as a whole project to particular subcortical structures and influence their functions as a whole.
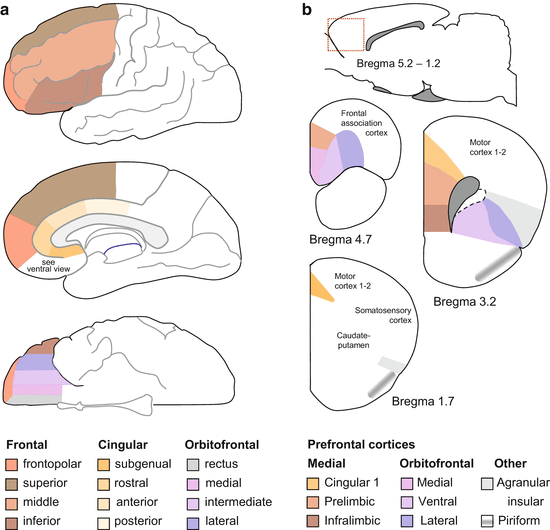
Fig. 4.5
The prefrontal cortex and its main parts in humans (a) and rats (b). The red dotted square on the upper schematic of panel b shows the approximate location in the rat brain. Only parts of this region are considered “prefrontal” (see sections through the rat brain)
The prefrontal cortex of rats is relatively smaller. The widespread consensus is that it is composed of the medial and orbitofrontal prefrontal cortices (Fig. 4.5b). Some authors also include the agranular insular and piriform cortices. Even if smaller relatively, it still comprises approximately one-fifth of the rat neocortex. Thus, it is still too large to assume that it is functionally homogeneous and affects subcortical structure as a whole.
These considerations show that the prefrontal cortex is not a unit that can be considered as such when mechanisms underlying aggressiveness are evaluated. As a phrase, it is just as general as “subcortical structures” or “limbic system.” Aggression cannot be controlled by the whole prefrontal cortex; projections that can be physically accommodated by lower structures must come from restricted regions of this vast area. The question arises whether the available data allow the delimitation of aggression-specific regions in the prefrontal cortex. A cross-checking of findings obtained with various technologies shows that they cannot.
4.2.3.2 Brain Lesion and Brain Imaging Studies Do Not Support Each Other
One of the strong arguments supporting the “prefrontal deficit theory” of aggression is that lesions of the prefrontal cortex induce a state called “acquired psychopathy,” while psychopaths show structural and functional deficits exactly in the prefrontal cortex. However, lesions leading to “acquired psychopathy” are located elsewhere than the structural and functional alterations seen in aggression-related psychopathologies.
Findings in Humans
Prefrontal lesions elicit the development of psychopathic-like traits only if they include the orbitofrontal area (Anderson et al. 1999; Barrash et al. 2000, 2011; Bear and Fulop 1987; Berlin et al. 2004, 2005; Blair and Cipolotti 2000; Blumer and Benson 1975; Pardini et al. 2011; Sarazin et al. 2003; Shamay-Tsoory et al. 2010; Tranel et al. 2002). Lesions located elsewhere in the prefrontal cortex either did not induce personality changes or induced weak changes (Barrash et al. 2000; Berlin et al. 2005; Pardini et al. 2011; Sarazin et al. 2003; Shamay-Tsoory et al. 2010). Moreover, there are a few studies suggesting that damages located in the dorsolateral or dorsomedial regions are associated with quite different behavioral changes, e.g., motor dysfunctions and apathy (Cummings 1995; Luria 1980; Niedermeyer 1998; Sarazin et al. 2003; Tekin and Cummings 2002). We found only one study where dorsolateral prefrontal lesions were paralleled by psychopathic-like personality changes (Max et al. 2006). However, patients had multiple brain lesions in this study,4 which makes the specificity of dorsolateral prefrontal regions questionable.
Taken together, the findings reviewed above show that psychopathic-like traits are associated with orbitofrontal lesions. In sharp contrast, there are quite many studies where orbitofrontal deficits were not seen in people suffering from aggression-related psychopathologies including psychopathy (Antonucci et al. 2006; Boes et al. 2008; Ducharme et al. 2011; Fahim et al. 2011; Goethals et al. 2005; Gregory et al. 2012; Hirono et al. 2000; Juengling et al. 2003; Juhász et al. 2001; Laakso et al. 2002; Rosell et al. 2010). In these studies, deficits were seen in other prefrontal regions, e.g., in the dorsolateral prefrontal cortex.
Findings in Animals
In animals, aggression increased when the orbitofrontal cortex but not when other prefrontal areas e.g., the medial prefrontal cortex or the anterior cingulate were damaged (de Bruin et al. 1983; Izquierdo 2005; Kolb 1974; Machado and Bachevalier 2006; Rudebeck et al. 2007). While aggression was increased specifically by damages located in the orbitofrontal cortex, changes associated with abnormal forms of aggression seem to be located elsewhere. The issue is certainly poorly studied, but it was shown that postweaning social isolation reduced the volume of the medial prefrontal cortex (Schubert et al. 2009; Day-Wilson et al. 2006). Although data are sparse, they tentatively suggest that the dissociation between the location of aggression-enhancing brain lesions and aggression-related prefrontal changes is different in rodents as well.
4.2.3.3 Brain Imaging Studies Do Not Support Each Other
These studies do not support each other in the meaning that the deficits observed by different authors are located in anatomically distinct regions of the prefrontal cortex.
Human Studies
The available studies do show aggression-related deficits in the vast area called “prefrontal cortex,” but the precise location and size of deficient areas varies from study to study. As examples, we summarized the findings of Boccardi et al. (2011) and Tiihonen et al. (2008) in Fig. 4.6a. The subjects of both studies were violent offenders, were diagnosed with antisocial personality disorder, and showed psychopathic traits. In addition, the populations studied included murderers in rather similar proportions and controls were “healthy” (nonaggressive) individuals. Both papers identified gray matter deficits in prefrontal regions. A closer look, however, shows that gray matter deficits were seen in rather different areas; overlaps are meager. The lack of similarities in affected brain areas is even more blatant in two studies on gray matter deficits associated with psychopathic traits (Ermer et al. 2012; Gregory et al. 2012). Subjects were violent offenders (including murderers), were diagnosed with antisocial personality disorder, and showed psychopathic traits in both cases. The approaches were somewhat different: Ermer et al. (2013) studied the correlation between psychopathic traits and gray matter volumes, while Gregory et al. (2012) compared the gray matter of antisocial personality-disordered violent offenders who did or did not show psychopathic traits. However, the ultimate aim of the two studies was similar: both sets of authors aimed at identifying gray matter deficits associated with psychopathic traits. Both studies found prefrontal deficits, but in completely different areas of the prefrontal cortex (Fig. 4.6b). In addition to the total lack of overlaps, Ermer et al. (2013) found a gray matter “gain” in the frontopolar area that was not seen by Gregory et al. (2012). Data on prefrontal deficits associated with borderline personality disorder are also divergent. Figure 4.6c compares the data obtained by Goethals et al. (2005), Soloff et al. (2003), and Juengling et al. (2003). All three evaluated local brain metabolic differences at resting state; all three found deficits compared to healthy controls, but again, the location of the deficits was rather different.
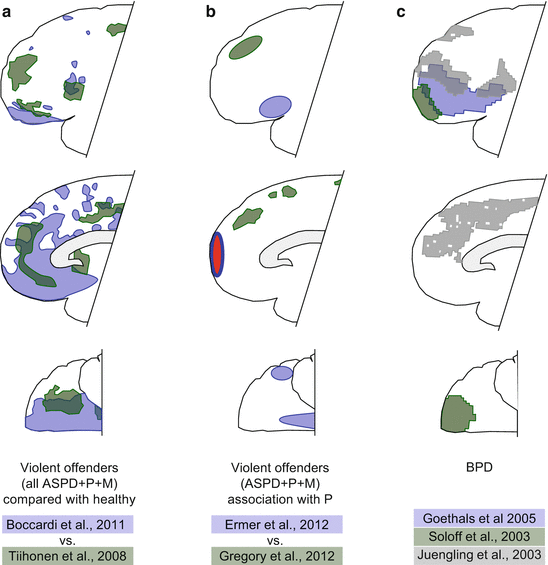
Fig. 4.6
The location of brain deficits in very similar studies. (a) violent offenders; (b) psychopathic traits; (c) borderline personality disorder. The characteristics of patients and the authors of studies are shown below panels. Abbreviations: ASPD, antisocial personality disorder; P, psychopathic traits; M, murderers included in the study; BPD, borderline personality disorder; red area, gray matter increase observed by Ermer et al. (2012); other colored areas, deficient regions; color codes identify the authors of the studies compared within panels
Intriguing discrepancies can be observed even in studies where the regions of interest (the areas studied as a whole) were very large and where overlaps were theoretically unavoidable. Here we compared three articles published by overlapping sets of authors (Raine et al. 2000, 2011; Yang et al. 2005). The first paper showed that the volume of the prefrontal cortex—defined as all gray matter anterior to the genu callosum—is reduced in violent offenders (including murderers) who were diagnosed with antisocial personality disorder and showed psychopathic traits (Fig. 4.7a). Differences were smaller in the last study of the series (Raine et al. 2011). Even more intriguingly, Yang et al. (2005) found no prefrontal gray or white mater alterations in antisocial personality-disordered subjects showing psychopathic traits (Fig. 4.7b). By contrast, differences were obtained when pathological liars were compared with non-liars. As all the subjects of this triad of studies were antisocial personality disordered and psychopathic, the findings of Raine et al. (2000) and Yang et al. (2005) combined suggest that violent offending (including murder) alone and lying alone are associated with similar prefrontal deficits, while antisocial personality combined with psychopathic traits is not.
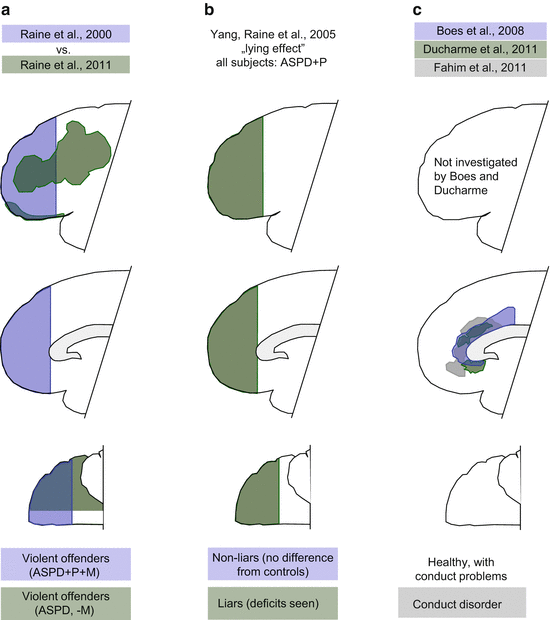
Fig. 4.7
Prefrontal deficits in antisocial personality disordered (ASPD) adults and children showing conduct problems. (a), (b) ASPD patients with different characteristics. +P, psychopathic traits; +M, murderers included in the study; −M, murderers not included; lack of blue color on panel b, lack of prefrontal dysfunctions in ASPD+P subjects. (c) Prefrontal deficits in healthy children with conduct problems (Boes et al. 2008; Ducharme et al. 2011) and in conduct disordered children (Fahim et al. 2011)
Besides these blatant examples, we compared the location and size of various prefrontal deficits in all the studies where these were clearly identifiable and where the conditions of the studies were comparable. Findings were similar in three studies only, all three involving aggressive children. The subjects of two of these studies were healthy children with conduct problems (Boes et al. 2008; Ducharme et al. 2011) (Fig. 4.7c). The third study was on conduct-disordered children (Fahim et al. 2011). Deficits were seen in highly overlapping regions of the cingulate cortex; neither study found orbitofrontal deficits (Fig. 4.7c). At this stage, this seems the only replicable finding of brain imaging studies.
One can argue that the sophisticated nature of brain imaging techniques and the subtleties of statistics that need to be employed preclude the precise overlapping of the regions where deficits are seen. However, the cross-checking of findings at a lower resolution strengthens the view that while prefrontal deficits are commonly seen, the location of these is highly variable (see Table 4.3. for findings grouped according to Brodmann areas).
Table 4.3
Prefrontal changes observed by various authors, grouped according to Brodmann areas
Area | Decreased | Increased | No change | Disorder | Technique | References |
|---|---|---|---|---|---|---|
BA 4 | X | ASPD | sMRI | Raine et al. (2011) | ||
X | ASPD + PP | sMRI | Tiihonen et al. (2008) | |||
X | PP | sMRI | Ermer et al. (2013) | |||
X | ASPD − PP | sMRI | Gregory et al. (2012) | |||
X | ASPD + PP | sMRI | Gregory et al. (2012) | |||
BA 8 | X | ASPD + PP | sMRI | Tiihonen et al. (2008) | ||
X | DBD | sMRI | Fahim et al. (2011) | |||
X | BPD | PET | Soloff et al. (2008) | |||
X | ASPD | sMRI | Raine et al. (2011) | |||
X | ASPD − PP | sMRI | Gregory et al. (2012) | |||
X | BPD | sMRI | Hazlett et al. (2005) | |||
X | BPD | PET | Soloff et al. (2005) | |||
X | BPD | sMRI | Tebartz van Elst et al. (2003) | |||
X | BPD-IED | PET | New et al. (2009) | |||
X | PP | sMRI | Ermer et al. (2013) | |||
BA 9 | X | ASPD | sMRI | Raine et al. (2000) | ||
X | ASPD | sMRI | Raine et al. (2011) | |||
X | ASPD − PP | sMRI | Gregory et al. (2012) | |||
X | BPD | PET | Soloff et al. (2003) | |||
X | ASPD | sMRI | Yang et al. (2005) | |||
X | ASPD − PP | sMRI | Gregory et al. (2012) | |||
X | ASPD + PP | sMRI | Tiihonen et al. (2008) | |||
X | BPD | sMRI | Hazlett et al. (2005) | |||
X | BPD | PET | Soloff et al. (2005) | |||
X | BPD | sMRI | Tebartz van Elst et al. (2003) | |||
X | BPD-IED | PET | New et al. (2009) | |||
X | PP | sMRI | Ermer et al. (2013) | |||
BA 10 | X | ASPD | sMRI | Raine et al. (2011) | ||
X | ASPD | sMRI | Raine et al. (2000) | |||
X | ASPD/BPD | SPECT | Goethals et al. (2005) | |||
X | ASPD + PP | sMRI | Gregory et al. (2012) | |||
X | ASPD + PP | sMRI | Tiihonen et al. (2008) | |||
X | BPD | PET | Soloff et al. (2003) | |||
X | BPD | PET | Soloff et al. (2003) | |||
X | PP | sMRI | Boccardi et al. (2011) | |||
X | PD | PET | New et al. (2002) | |||
X | PP | sMRI | Ermer et al. (2013) | |||
X | ASPD | sMRI | Yang et al. (2005) | |||
X | ASPD − PP | sMRI | Gregory et al. (2012) | |||
X | ASPD + PP | sMRI | Gregory et al. (2012) | |||
X | BPD | sMRI | Hazlett et al. (2005) | |||
X | BPD | sMRI | Tebartz van Elst et al. (2003) | |||
X | BPD-IED | PET | New et al. (2009) | |||
X | PD | PET | New et al. (2002) | |||
BA 11 | X | ASPD | sMRI | Raine et al. (2000) | ||
X | ASPD | sMRI | Raine et al. (2011) | |||
X | ASPD + PP | sMRI | Tiihonen et al. (2008) | |||
X | BPD | PET | Soloff et al. (2003) | |||
X | BPD | PET | Soloff et al. (2005) | |||
X | BPD | sMRI | Tebartz van Elst et al. (2003) | |||
X | DBD | sMRI | Fahim et al. (2011) | |||
X | PP | sMRI | Boccardi et al. (2011) | |||
X | PP | sMRI | Ermer et al. (2013) | |||
X | Healthy | sMRI | Boes et al. (2008) | |||
X | Healthy | sMRI | Ducharme et al. (2011) | |||
X | ASPD | sMRI | Yang et al. (2005) | |||
X | ASPD − PP | sMRI | Gregory et al. (2012) | |||
X | ASPD + PP | sMRI | Gregory et al. (2012) | |||
X | BPD | sMRI | Morandotti et al. (2013) | |||
X | BPD | sMRI | Hazlett et al. (2005) | |||
X | BPD-IED | PET | New et al. (2009) | |||
X | PD | PET | New et al. (2002) | |||
BA 12 | X | ASPD | sMRI | Raine et al. (2011) | ||
X | ASPD | sMRI | Raine et al. (2000) | |||
X | ASPD + PP | sMRI | Tiihonen et al. (2008) | |||
X | BPD | sMRI | Tebartz van Elst et al. (2003) | |||
X | DBD | sMRI | Fahim et al. (2011) | |||
X | Healthy | sMRI | Boes et al. (2008) | |||
X | Healthy | sMRI | Ducharme et al. (2011) | |||
X | ASPD | sMRI | Yang et al. (2005) | |||
X | ASPD − PP | sMRI | Gregory et al. (2012) | |||
X | ASPD + PP | sMRI | Gregory et al. (2012) | |||
X | BPD | sMRI | Hazlett et al. (2005) | |||
X | BPD-IED | PET | New et al. (2009) | |||
BA 24 | X | Healthy | sMRI | Boes et al. (2008) | ||
X | Healthy | sMRI | Ducharme et al. (2011) | |||
X | ASPD | sMRI | Raine et al. (2000) | |||
X | BPD | sMRI | Hazlett et al. (2005) | |||
X | BPD | sMRI | Tebartz van Elst et al. (2003) | |||
X | DBD | sMRI | Fahim et al. (2011) | |||
X | PP | sMRI | Boccardi et al. (2011) | |||
X | PD | PET | New et al. (2002) | |||
X | ASPD | sMRI | Yang et al. (2005) | |||
X | ASPD − PP | sMRI | Gregory et al. (2012) | |||
X | ASPD + PP | sMRI | Gregory et al. (2012) | |||
X | ASPD + PP | sMRI | Tiihonen et al. (2008) | |||
X | BPD-IED | PET | New et al. (2009) | |||
X | PD | PET | New et al. (2002) | |||
X | PP | sMRI | Ermer et al. (2013) | |||
BA 25 | X | Healthy | sMRI | Boes et al. (2008) | ||
X | Healthy | sMRI | Ducharme et al. (2011) | |||
X | PP | sMRI | Boccardi et al. (2011) | |||
X | ASPD − PP | sMRI | Gregory et al. (2012) | |||
X | ASPD + PP | sMRI | Gregory et al. (2012) | |||
X | ASPD + PP | sMRI | Tiihonen et al. (2008) | |||
X | BPD-IED | PET | New et al. (2009) | |||
X | PD | PET | New et al. (2002) | |||
X | PP | sMRI | Ermer et al. (2013) | |||
BA 32 | X | ASPD | sMRI | Raine et al. (2000) | ||
X | ASPD + PP | sMRI | Tiihonen et al. (2008) | |||
X | BPD | PET | Soloff et al. (2008) | |||
X | PP | sMRI | Boccardi et al. (2011) | |||
X | Healthy | sMRI | Boes et al. (2008) | |||
X | Healthy | sMRI | Ducharme et al. (2011) | |||
X | ASPD | sMRI | Yang et al. (2005) | |||
X | ASPD − PP | sMRI | Gregory et al. (2012) | |||
X | ASPD + PP | sMRI | Gregory et al. (2012) | |||
X | BPD | sMRI | Hazlett et al. (2005) | |||
X | BPD | sMRI | Tebartz van Elst et al. (2003) | |||
X | BPD-IED | PET | New et al. (2009) | |||
X | PD | PET | New et al. (2002) | |||
X | PP | sMRI | Ermer et al. (2013) | |||
BA 44 | X | ASPD + PP | sMRI | Tiihonen et al. (2008) | ||
X | PP | sMRI | Boccardi et al. (2011) | |||
X | ASPD | sMRI | Raine et al. (2011) | |||
X | ASPD − PP | sMRI | Gregory et al. (2012) | |||
X | ASPD + PP | sMRI | Gregory et al. (2012) | |||
X | BPD | sMRI | Morandotti et al. (2013) | |||
X | BPD-IED | PET | New et al. (2009) | |||
X | PP | sMRI | Ermer et al. (2013) | |||
BA 45 | X | ASPD + PP | sMRI | Tiihonen et al. (2008) | ||
X | ASPD − PP | sMRI | Gregory et al. (2012) | |||
X | ASPD + PP | sMRI | Gregory et al. (2012) | |||
X | BPD | sMRI | Morandotti et al. (2013) | |||
X | BPD | sMRI | Tebartz van Elst et al. (2003) | |||
X | BPD-IED | PET | New et al. (2009) | |||
X | PD | PET | New et al. (2002) | |||
X | PP | sMRI | Ermer et al. (2013) | |||
BA 46 | X | ASPD | sMRI | Raine et al. (2011) | ||
X | ASPD | sMRI | Raine et al. (2000) | |||
X | PP | sMRI | Boccardi et al. (2011) | |||
X | PD | PET | New et al. (2002) | |||
X | ASPD | sMRI | Yang et al. (2005) | |||
X | ASPD | sMRI | Raine et al. (2011) | |||
X | ASPD + PP | sMRI | Tiihonen et al. (2008) | |||
X | ASPD + PP | sMRI | Gregory et al. (2012) | |||
X | ASPD − PP | sMRI | Gregory et al. (2012) | |||
X | BPD | sMRI | Tebartz van Elst et al. (2003) | |||
X | BPD | sMRI | Hazlett et al. (2005) | |||
X | BPD-IED | PET | New et al. (2009) | |||
X | PD | PET | New et al. (2002) | |||
X | PP | sMRI | Ermer et al. (2013) | |||
BA 47 | X | BPD | sMRI | Tebartz van Elst et al. (2003) | ||
X | BPD | sMRI | Morandotti et al. (2013) | |||
X | DBD | sMRI | Fahim et al. (2011) | |||
X | PP | sMRI | Boccardi et al. (2011) | |||
X | PP | sMRI | Ermer et al. (2013) | |||
X | Healthy | sMRI | Ducharme et al. (2011) | |||
X | ASPD − PP | sMRI | Gregory et al. (2012) | |||
X | ASPD + PP | sMRI | Tiihonen et al. (2008) | |||
X | ASPD + PP | sMRI | Gregory et al. (2012) | |||
X | BPD | sMRI | Hazlett et al. (2005) | |||
X | BPD-IED | PET | New et al. (2009) | |||
X | PD | PET | New et al. (2002) |
Animal Studies
Structural and functional brain imaging studies are scarce in the animal literature, and the available ones cannot be used to compare the location and extent of prefrontal deficits that are associated with aggression.
4.2.3.4 “Aggression History” and “Manifest aggression” Studies Do Not Support Each Other
All the studies reviewed above belong to the “aggression history” type where brain imaging is performed while subjects lie still in the apparatus; aggressiveness is attributed to them based on their past actions. In the majority of such subjects, prefrontal deficits are seen, even if the location of these is highly variable. In manifest aggression studies, where subjects perform aggression-related tasks during brain imaging, prefrontal activations are seen; moreover, the magnitude of activation correlates positively with the history of violence. The two types of studies do not support each other in the meaning that while deficits are seen in the first type, activations are seen in the second.
Findings in Humans
Specific subareas of the prefrontal cortex were activated by the following: (1) stimuli that potentially elicit aggression, e.g., the detection of fear, anger, and threatening situations (Blair et al. 1999; Dougherty et al. 1999; Hermans et al. 2008; Pardini and Phillips 2010; Sugiura et al. 2009); (2) attitudes and feelings that increase the likelihood of aggression, e.g., negative affect, psychological distress, frustration, and anger (Abler et al. 2005; Herpertz et al. 2001; Kimbrell et al. 1999; Li et al. 2006; Schneider et al. 2000; Siegrist et al. 2005); and (3) imagined aggression, playing aggressive video games and delivering punishment in competitive situations (aggressive retaliation) (King et al. 2006; Lotze et al. 2007; Montag et al. 2012; New et al. 2009; Strenziok et al. 2011; Veit et al. 2010).
Thus, prefrontal activations paralleled all three main stages of aggressive conflicts: the detection of threat, the induction of feelings that engender aggressiveness, and the execution of aggressive acts. Intriguingly, prefrontal activations were enhanced in patients suffering from aggression-related psychopathologies, e.g., personality disorders, intermittent explosive disorder, and psychopathy (Herpertz et al. 2001; New et al. 2009; Schneider et al. 2000; Völlm et al. 2010). In addition, stronger activation was seen in healthy subjects who were especially aggressive in the experimental task (e.g., excessive first-person-shooter video players, cocaine abusers, and chronically violent men) (Li et al. 2006; Montag et al. 2012; Pardini and Phillips 2010). Strikingly, the orbitofrontal area which increases aggression when damaged was quite often activated in these studies (Blair et al. 1999; Herpertz et al. 2001; Kimbrell et al. 1999; King et al. 2006; New et al. 2009; Strenziok et al. 2011; Sugiura et al. 2009; Veit et al. 2010).
The anatomical substrates of such activations are just as variable as those seen in aggression history studies. For example, eight studies reported activations within the orbitofrontal area (see above); the anterior cingulate was activated in six studies, out of which only one reported the concomitant activation of the orbitofrontal cortex (Abler et al. 2005; Blair et al. 1999; Dougherty et al. 1999; Li et al. 2006; Siegrist et al. 2005). In contrast with “aggression history” studies, however, manifest aggression studies are rather few in number, and it is difficult to find two that would allow a point-by-point comparison. Even when the basic tool to study aggression was similar—e.g., aggressive video games—the circumstances were quite different. In one publication the processing of screenshot images was studied, while the other focused on playing per se (King et al. 2006; Montag et al. 2012). One can assume that differences in the location of activated areas are explained by such differences in methodologies and circumstances. Naturally, the issue needs further studies, but at present stage, a “prefrontal activation theory” of aggression seems to take shape, especially because this theory is strongly supported by animal findings.
Findings in Animals
Although orbitofrontal lesions decrease aggression in rodents just like in humans, aggressive behaviors do activate the prefrontal cortex; moreover, activation was enhanced in models where subjects showed abnormal forms of aggression.
Resident-intruder tests performed in normal subjects either activated all the prefrontal areas that were investigated (rats: Halász et al. 2006; mice: Haller et al. 2006; Wall et al. 2012) or activated extended subregions of these areas (rats: Beiderbeck et al. 2012 Clinton et al. 2011; mice: Duncan et al. 2009). The medial prefrontal cortex was also activated by maternal aggression in rats (Caffrey et al. 2010) and play fighting in hamsters (Cheng et al. 2008). These studies quantified the expression of immediate early genes, for which they may be criticized for the low temporal resolution of this technology. Indeed, the findings do not exclude the possibility that the prefrontal cortex was activated by the inhibition rather than by the initiation of aggressive acts. Biting attacks occur in bursts in rodents, which are separated by episodes of relatively peaceful interactions. The development of the c-Fos signal takes time, for which any of the events of the aggressive conflict can cause the activations seen post hoc. Therefore, the effects of escalations and returns to peacefulness cannot be told apart. A few studies show, however, that the activation of the prefrontal cortex is not related to temporary limitations of aggression. For example, Ferris et al. (2008) employed brain imaging techniques in rats that were visually challenged by opponents. Although animals did not perform aggressive behavior (i.e., there was no aggression to be “stopped” by the prefrontal cortex), all the subregions of the prefrontal cortex were activated. Similar findings were obtained by Halász et al. (2006) who showed that the prelimbic, anterior cingular, agranular insular, and ventral orbitofrontal cortices were activated by psychosocial encounters, i.e., by a situation where intruders and residents were physically separated (i.e., fights were prevented). Psychosocial encounters activated the prefrontal cortex in mice as well (Ago et al. 2013). Taken together, these findings preclude that increased prefrontal activations are specifically related to temporary (within-encounter) dampening of aggressive behavior.
Even more strikingly, prefrontal activation was exacerbated in models where the subjects showed abnormal forms of aggression. In rats selected for anxiety, for instance, the prelimbic, infralimbic, and anterior cingulate cortices were all activated in addition to the ventral orbitofrontal cortex that was activated by fights already in controls (i.e., in rats not selected for anxiety) (Beiderbeck et al. 2012). In the study by Halász et al. (2006), glucocorticoid dysfunction-induced abnormal aggression correlated negatively with the activation of prefrontal GABAergic, but positively with the activation of prefrontal glutamatergic neurons, the latter being the neuron type that sends projections to subcortical structures. This study not only suggested that the outputs of the prefrontal cortex were upregulated in abnormally aggressive subjects but also showed that local inhibitory neurons were downregulated. Postweaning social isolation, a model of exacerbated emotional aggression increased the activation of the prefrontal cortex especially in the medial and lateral orbitofrontal cortices and the anterior cingulate cortex (mice: Ago et al. 2013; rats: Toth et al. 2012). Finally, mice genetically selected for aggressive behavior showed larger activations in both the medial and the orbitofrontal prefrontal cortices as compared to their more peaceful counterparts (Haller et al. 2006). There are only two models of abnormal aggression where similar phenomena were not observed and where prefrontal activation was decreased by fights as compared to normally fighting controls. In the pubertal stress model, the aggression-induced activation of the medial orbitofrontal cortex was blunted (Márquez et al. 2013). No differences were seen in other prefrontal areas. In the study by Wall et al. (2012), rats were socially isolated for 4 weeks after weaning, and the aggression test was performed in late adolescence (postnatal days 49–52). The activation of all three medial prefrontal regions was blunted in socially isolated as compared to socially housed rats. Even in these cases, however, the prefrontal cortex was activated by fights.
4.2.3.5 Summary
The findings reviewed above can be summarized as follows: (1) prefrontal damages increase aggression only when they include orbitofrontal areas. The very same region is not necessarily dysfunctional in aggressive individuals. (2) Non-orbitofrontal damages do not increase aggression. Aggressiveness was often specifically associated with non-orbitofrontal dysfunctions. (3) Aggression-related prefrontal dysfunctions occur in patches. The location and extent of dysfunctional “patches” vary from study to study. Findings are discordant even when the characteristics of subjects and the methods of study are highly similar. (4) The execution of aggressive acts activates the prefrontal cortex. Activation is stronger in abnormally aggressive individuals. (5) Human and animal findings are highly consistent. Despite their rather simplistic formulation, the statements are essentially true when the totality of findings is considered.
4.2.4 The “Psychological Landscape” Hypothesis
This section aims at explaining the diversity of prefrontal deficits observed in aggression. The topographic and hierarchical organization of the prefrontal cortex is used as an explanatory principle. A complementary “Neural Network” hypothesis is presented in the next section.
4.2.4.1 “Psychological Homunculi” in the Prefrontal Cortex
The metaphor refers to the sensory and motor homunculi that visualize the organization of primary sensory and motor areas, which are topographically precise representations of the body. It occurs that the prefrontal cortex is organized in a somewhat similar way: it represents psychological faculties in a mosaic-like, topographically structured, and hierarchically organized fashion. This feature of the prefrontal cortex is highly relevant for aggression control and may explain a great deal of the discrepancies outlined in the previous sections. In the following we will briefly overview the proposed cognitive and emotional maps of the prefrontal cortex. The integration of these findings with those obtained in aggression research and the hypothesis per se will be described in separate sections.
Human Studies
The prefrontal cortex includes motor association areas that serve as interfaces between cognitive and motor networks and as such have important roles in behavioral integration. Therefore, the “psychological topography” of the prefrontal cortex will be started with this “cognitive-motor” level of integration and will be continued with non-motor prefrontal regions. Figure 4.8a summarizes the topographic organization of functions within motor association cortices based on Picard and Strick (2001). Others may attribute different roles to the topographic units and may delimitate them in slightly different ways (see, e.g., Hoshi and Tanji 2007; Kollias et al. 2001; Rushworth et al. 2004). The latter author for instance suggested that the pre-supplementary motor area (the anterior part of the area depicted in Fig. 4.8a) is involved in the selection of action sets, whereas the anterior cingulate cortex relates actions to their consequences and guides decisions about which actions are worth making. Wise et al. (1997) emphasized the role perceptual information that reach the premotor cortex and suggested that this area makes computations not only based on visuomotor but also on proprioceptive, attentional, and other information to produce an output that reflects the selection, preparation, and execution of movements. For the topography of the prefrontal cortex “proper,” two models were reproduced in Fig. 4.8b, c. These were based on Badre and D’Esposito (2009) and Petrides (2005), respectively. Albeit the two models appear quite different at the first sight, a closer look can detect similarities that are somewhat covered by the distinct phraseology. More elaborated models also exist; Goldman-Rakic (1996) for instance proposed a detailed prefrontal topography for working memory alone. We would like to emphasize what might not be transparent from the generalizing models reproduced (and partly simplified) in Fig. 4.8. The experimental work summarized in such models paid great attention to the precise location and extent of the functional units of the prefrontal cortex. They were highly attentive not only to the topographic details but also to the overlaps and non-overlaps reported by concurrent studies.
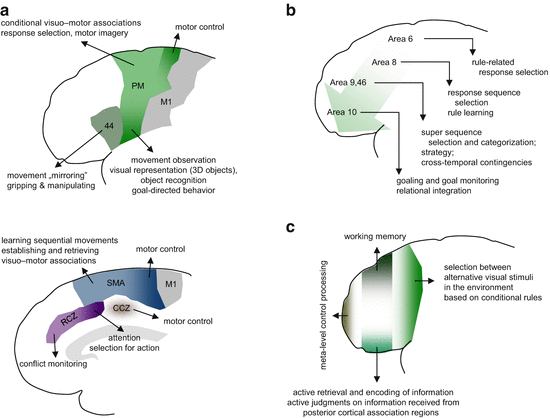
Fig. 4.8
Models for the topographic and hierarchical organization of the prefrontal cortex. (a) motor association areas (based on Picard and Strick 2001); (b, c) other areas of the prefrontal cortex (based on Badre and D’Esposito 2009 and Petrides 2005, respectively). CCZ caudal cingulate zone; M1 primary motor cortex; PM premotor cortex; RCZa anterior rostral cingulate zone; RCZp posterior rostral cingulate zone; SMA supplementary motor area. Numbers depict Brodmann areas
The “emotional maps” of the prefrontal cortex may not be as elaborate as cognitive ones, but the available information does support the notion that emotions are also parceled within this brain region. For example, the orbitofrontal cortex was specifically involved in impulsivity in all three rodents, monkeys, and humans (Matsuo et al. 2009; Rosell et al. 2010; Sellitto et al. 2011; Soloff et al. 2003; Winstanley et al. 2010). Moreover, different aspects of impulsivity may be controlled by different prefrontal regions, the orbitofrontal cortex being involved in motor impulsivity in the first place (Antonucci et al. 2006; Fineberg et al. 2010; Gansler et al. 2011). The anterior cingulate by contrast was involved in the emotional processing of pain, the same area being linked to motor centers responsible for expressing affect and executing goal-directed behavior (Bie et al. 2011; Shackman et al. 2011). A quantitative voxel-based meta-analysis of 105 studies showed that the processing of emotional faces (vs. neutral ones) activates the medial frontal gyrus, while the processing of angry faces was associated with activations in the middle and inferior frontal gyri (Fusar-Poli et al. 2009).
Related posts:


Stay updated, free articles. Join our Telegram channel

Full access? Get Clinical Tree


