Chapter 19 Figure 19-1 Obstructive sleep apnea. Figure 19-2 Obstructive sleep apnea. Figure 19-3 Obstructive sleep apnea. Figure 19-4 Sleep apnea in a child. Figure 19-5 Sleep apnea (the same patient shown in Fig. 19-4). Figure 19-6 Sleep apnea in a retrognathic child. Figure 19-7 Retrognathic child with sleep apnea. Figure 19-8 OSA with leg EMG activity. Figure 19-9 OSA with activity in the leg channels on continuous positive airway pressure (CPAP). Figure 19-10 Mixed sleep apnea with leg activity. Figure 19-11 Mixed sleep apnea with activity in the leg channels on CPAP. Figure 19-12 OSA with acromegaly. Figure 19-13 OSA or hypoventilation? Figure 19-14 OSA or hypoventilation? Figure 19-15 Obstructive sleep apnea. Figure 19-16 Awake and asleep: OSA. Figure 19-17 Awake and asleep: OSA. Figure 19-18 Awake and asleep: OSA. Figure 19-19 Mixed apnea. Figure 19-20 OSA in a patient with Down syndrome. Figure 19-21 OSA and periodic limb movements. Figure 19-22 OSA and periodic limb movements. Figure 19-23 Upper airway resistance syndrome (UARS). Figure 19-24 UARS, drilling down on the previous polysomnographic fragment (see Fig. 19-23). Figure 19-25 UARS (the same patient shown in Fig. 19-24, one breath later). Figure 19-26 UARS. Figure 19-27 UARS (the same patient as shown in Fig. 19-26). Figure 19-28 Prolonged obstructive hypoventilation. Figure 19-29 UARS causing cardiac arrhythmia. Figure 19-30 UARS or obstructive hypopneas? Figure 19-31 Idiopathic central sleep apnea. Figure 19-32 Central apnea related to opiates. Figure 19-33 Central apnea related to opiates. Figure 19-34 Idiopathic central sleep apnea. Figure 19-35 Idiopathic central sleep apnea on CPAP (the same patient as shown in Fig. 19-34). Figure 19-36 Idiopathic central sleep apnea on bilevel pressure (the same patient as shown in Fig. 19-35). Figure 19-37 Idiopathic central sleep apnea on ASV (the same patients as shown in Fig. 19-16). Figure 19-38 Idiopathic central sleep apnea: treatment with ASV. Figure 19-39 Idiopathic central apnea: treatment with adaptive servoventilation (the same patient as shown in Fig. 19-38).
Gallery of Polysomnographic Recordings
Obstructive Sleep Apnea (OSA)
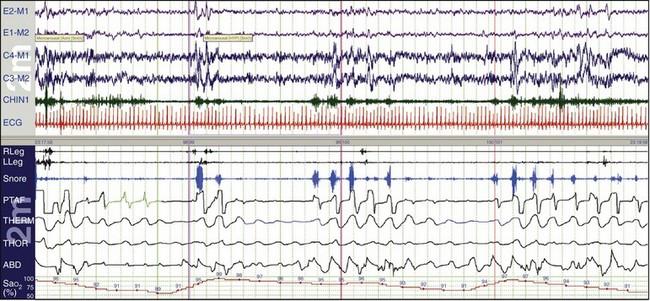
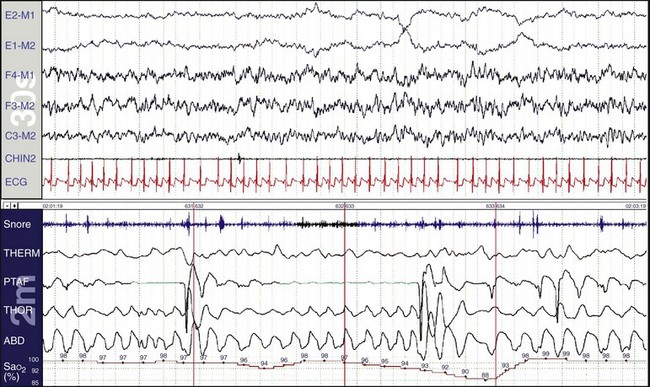
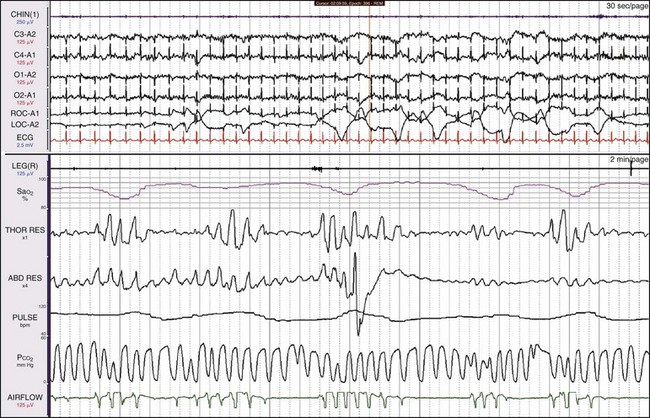
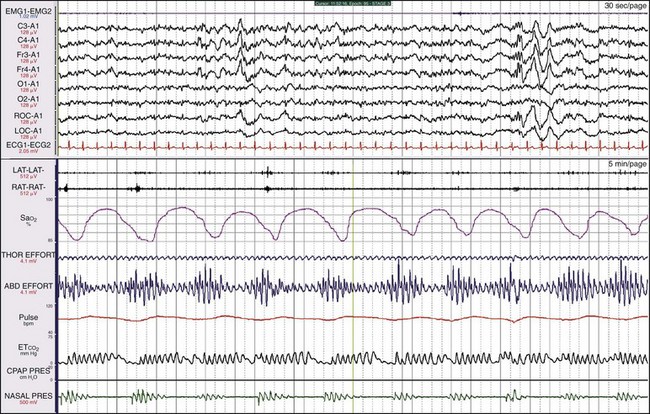
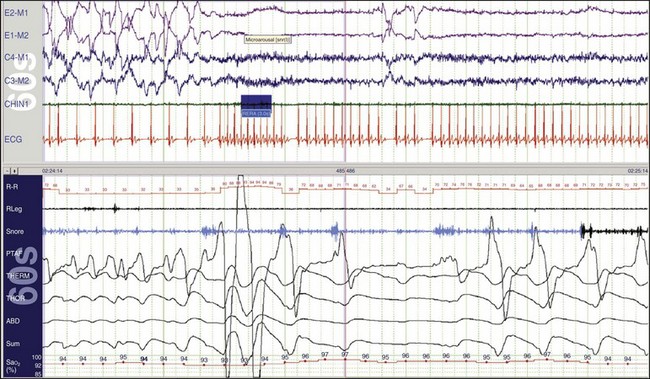
In OSA, despite thoracic and abdominal efforts, there is a cessation of airflow. In this example, airflow is being monitored by the use of the thermocouple (THERM) and nasal pressure (PTAF, for nasal pressure airflow). It is recommended by the American Academy of Sleep Medicine (AASM) scoring manual (see Chapters 13.2 and 18) that apnea be scored when there is a 90% or more reduction in the peak thermal sensor excursion (or excursion of the alternate sensor, nasal air pressure) for more than 10 seconds. The same manual suggests that hypopnea be scored when nasal pressure signal excursions—or their alternates, calibrated or uncalibrated inductance plethysmography—drop by more than 30%. In this example, the scoring technician has labeled the first event a hypopnea and the next two events apneas. In reality, there is little physiologic difference between hypopneas and apneas, and indeed, more hypoxemia was present with the hypopneic episode. All the data should be examined: in this example, the snoring channels; the chin electromyelogram (EMG), which is also detecting snoring; and the electroencephalogram (EEG) channels, which show the arousals linked to the abnormal respiratory events. Epoch lengths should be used that best enhance the interpretation and understanding of the patient (i.e., not always the recommended 30-second epoch). The top and bottom windows are 2-minute epochs.
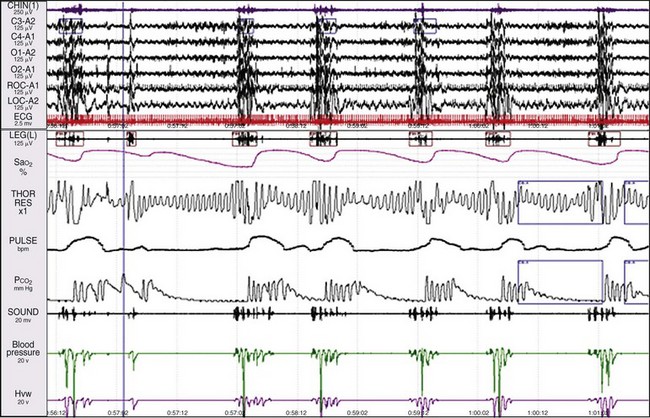
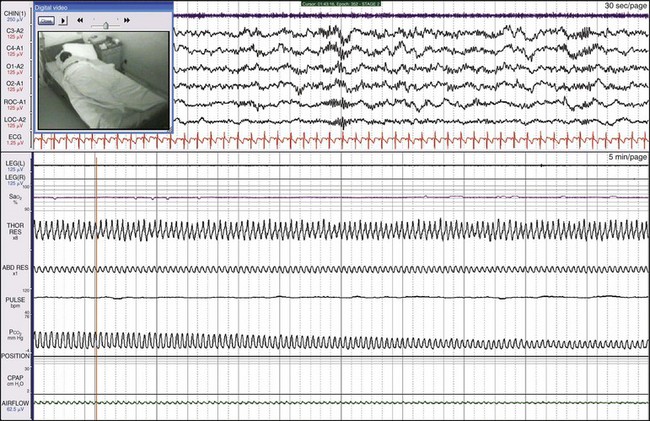
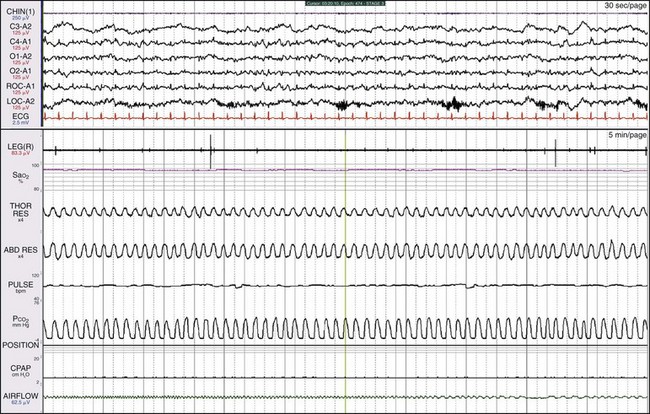
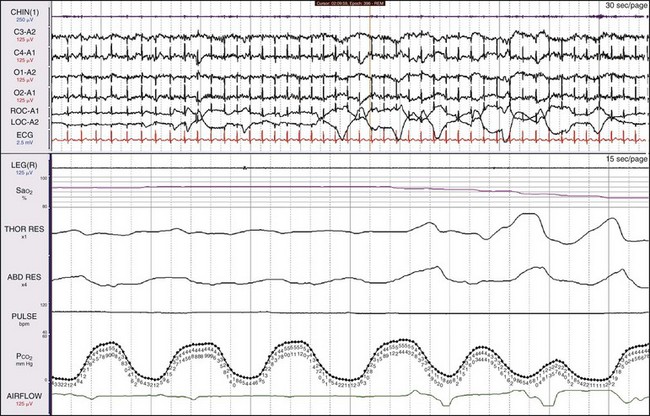
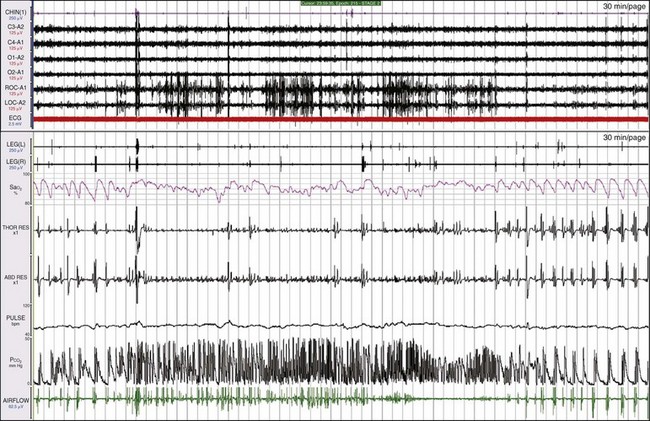
Understanding cardiorespiratory sensors is important. The AASM manual recommends a thermal sensor for detecting apneas and nasal pressure to detect hypopneas. Both of these sensors have significant potential limitations. Nasal pressure results in absent or decreased airflow in patients who are mouth breathers and may result in overestimation of the number of apneas and the length of individual events. In this figure, oronasal end-tidal pCO2, nasal pressure, and nasal airflow are being monitored. Notice that many more unobstructed breaths are detected using oronasal pCO2 and that it lags pressure by 5 to 10 seconds because of the technology of the capnometer. Thermal sensors are dependent on where they are placed in the airstream; they are nonlinear with airflow and are uncalibrated, and it is suggested that a square root transformation be made on the signal to prevent reporting hypopneas that are not present. It is recommended that pulse oximetry be collected with signal averaging of 3 seconds. In this example, the oxygen saturation (SaO2) starts to increase rapidly within 5 to 10 seconds of the onset of breathing, whereas in Figure 19-1, the SaO2 lagged by about 30 seconds. There a finger probe was used, whereas in this case, and in many others in this text, a rapidly responding ear oximeter was used. Notice that this patient has a classic tachycardia/bradycardia pattern, which corresponds very closely to the episodes of obstructive apnea. The pulse rate is usually derived directly from the calculation of the R-R interval of the electrocardiogram and is a fast-responding, accurate signal. Thus it is important to understand phase differences between channels. The top and bottom windows are 5-minute epochs.
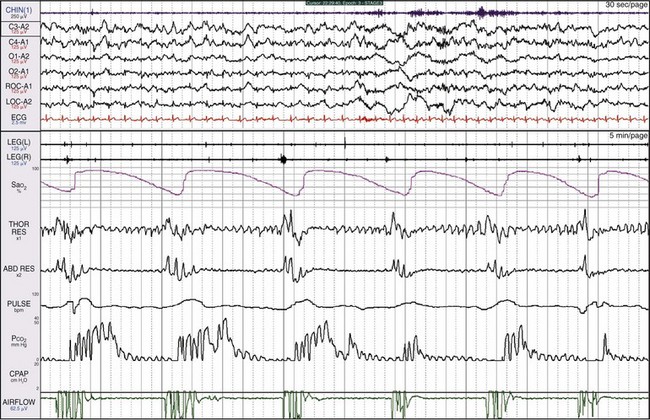
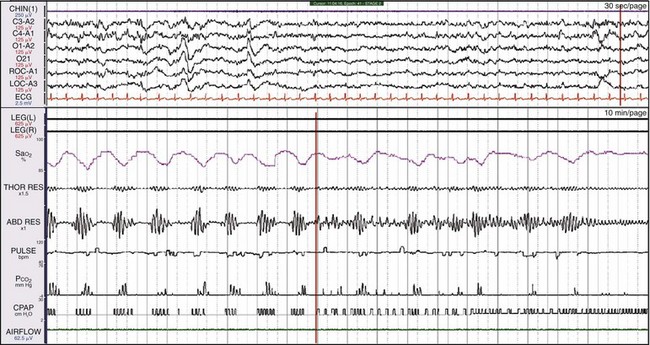
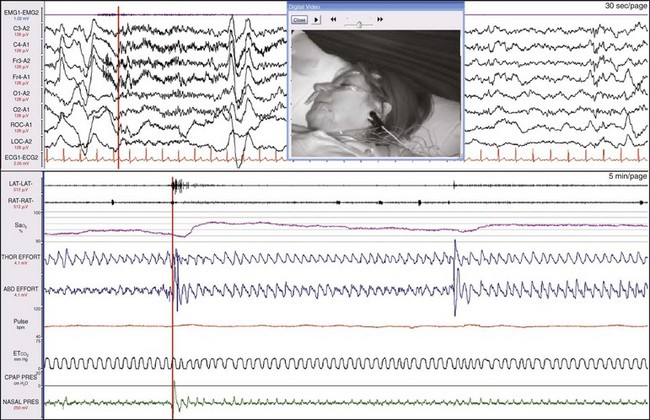
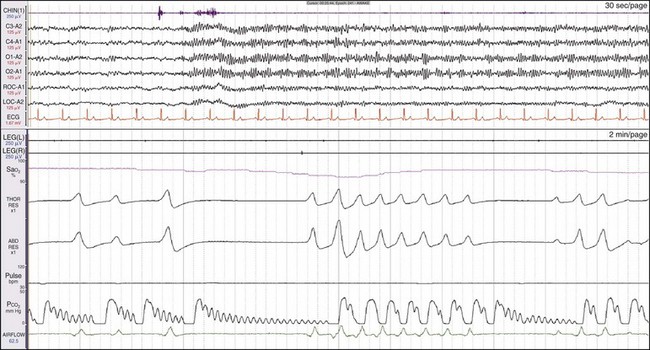
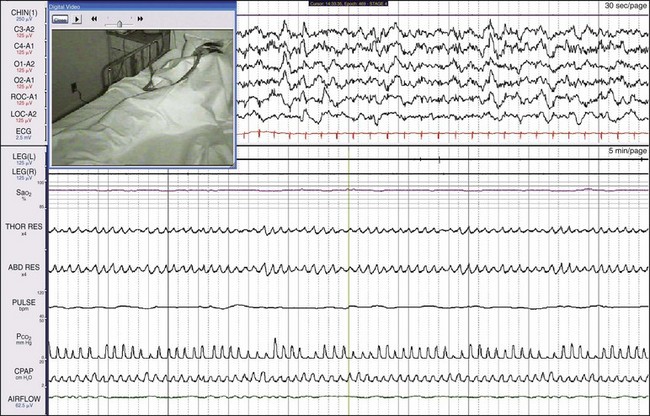
This 47-year-old former boxer had his nose broken multiple times, with resultant severe sleep apnea. The minimal channels required to differentiate obstructive from central apnea are SaO2, breathing effort (thoracic and/or abdominal), and oronasal airflow. A calibrated, rapidly responding end-tidal CO2 (EtCO2) analyzer to monitor oral and nasal airflow and detect the presence of hypoventilation is superior to a thermistor or thermocouple, which merely detect the presence or absence of airflow. Notice that the EtCO2 has detected more breaths than the pressure transducer (labeled “AIRFLOW”) in this patient, who does a great deal of mouth breathing. For examining sleep, the ideal epoch length is 30 seconds; for examining breathing during sleep, the ideal epoch length is 2 to 5 minutes, although this may vary from patient to patient. In this example, the top window is a 30-second epoch and the bottom is a 5-minute epoch.
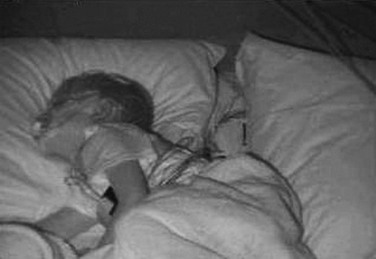
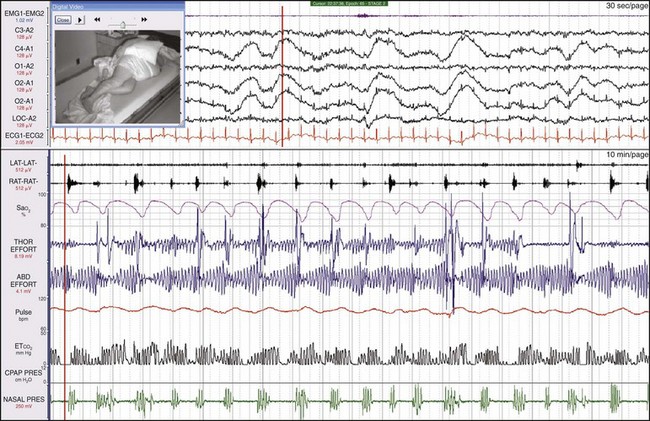
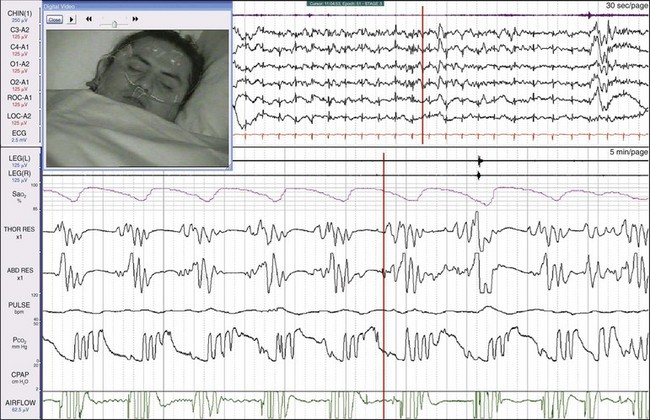
This 12-year-old boy had been snoring since birth. He was modestly overweight, had headaches and a history of awakening with shortness of breath, and was a restless sleeper. His preferred sleeping position was on his stomach. Here he is sleeping on his back and demonstrates OSA. Children with sleep apnea commonly assume positions that minimize airway obstruction. See Video 22 on expertconsult.com for a recording of this patient.
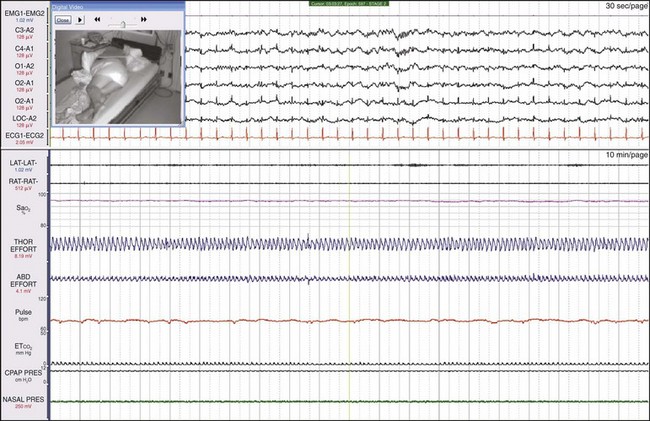
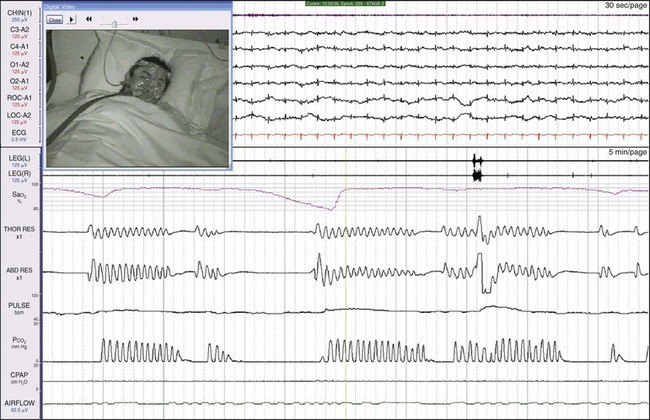
Here the patient is sleeping mostly on his stomach. The apnea has resolved entirely. This child had enlarged tonsils and adenoids that were surgically removed, resulting in the resolution of the sleep apnea.
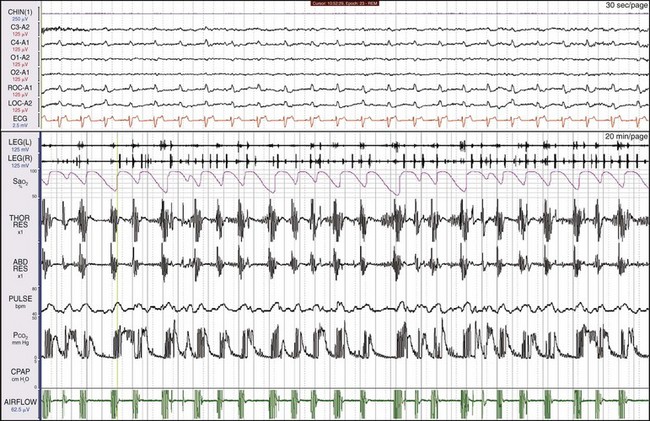
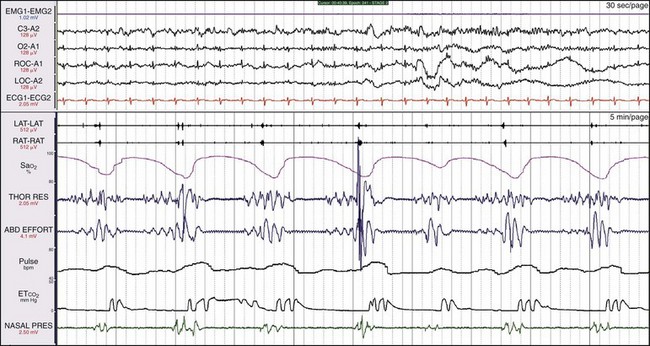
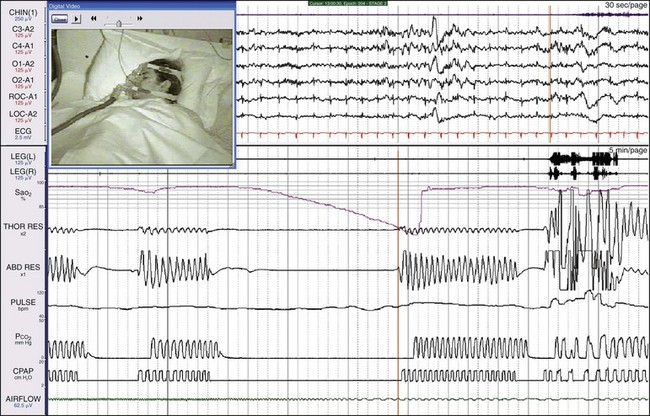
This 7-year-old girl had a history of snoring loudly since birth, and apnea and restless sleep were observed. She was thin, with a body mass index (BMI) of 21. During sleep, the patient thrust her lower jaw forward and arched her neck in an unconscious attempt to enlarge the pharyngeal airway. In rapid eye movement (REM) sleep, the patient had quite long episodes of apnea, as shown in this figure. Note the thoracic/abdominal paradox when the apnea “breaks.”
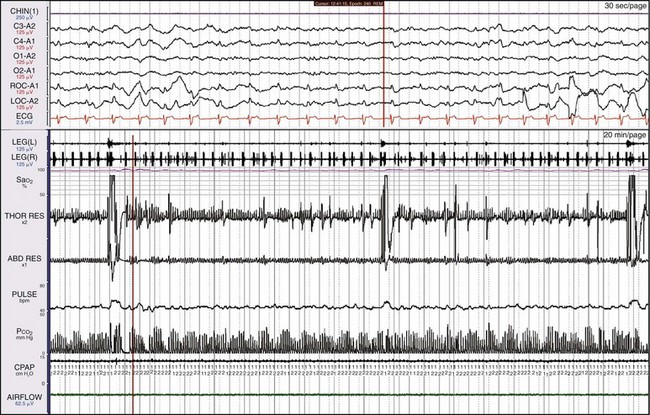
This 5-year-old boy slept with his lower jaw thrust forward in an attempt to enlarge the pharyngeal airway. He had a history of snoring, waking up gasping, and shortness of breath, and observed apnea was reported. The boy snored 62% of the night and had an apnea-hypopnea index of 2.4, which is above the threshold of 1 required for the diagnosis of pediatric sleep apnea.
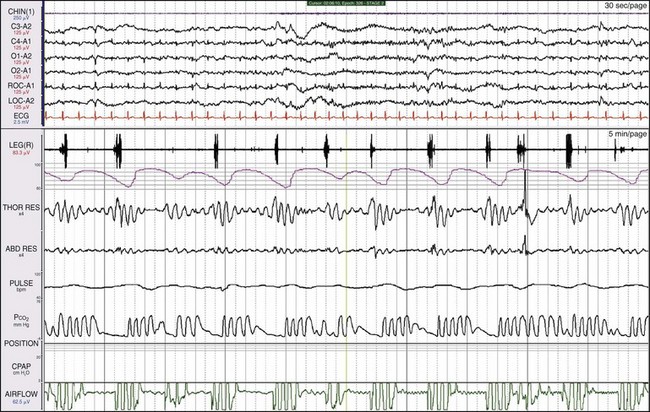
Here, leg movements are detected with every apneic episode. The movements occur at the time of the greatest respiratory efforts. Are these periodic limb movements (PLMs), or are they merely movements linked to respiratory effort? But does this patient have one or two diagnoses? The scoring manual notes that “A leg movement should not be scored if it occurs during a period from 0.5 seconds preceding an apnea or hypopnea to 0.5 seconds following an apnea or hypopnea.”
These data are from the same patient shown in Figure 19-8 but occurred later on in the night. On CPAP, the leg movements have resolved entirely; thus the movements were linked to the abnormal breathing pattern. This patient does not have PLMS.
Shown is another patient with leg movements and severe sleep apnea. The leg movements are not as periodic or as regular as those in Figure 19-9. Are the movements simply a reflection of the breathing efforts? One clue is that the heart rate, measured by the pulse, shows oscillations that are not always linked to the abnormal breathing patterns.
This is the same patient as shown in Figure 19-10. The apnea has resolved, but the leg movements continue at a very high rate. Note the improvement in SaO2. This patient has both sleep apnea and PLMS.
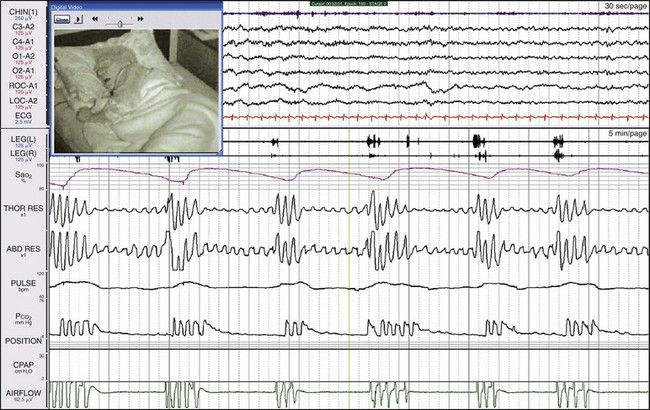
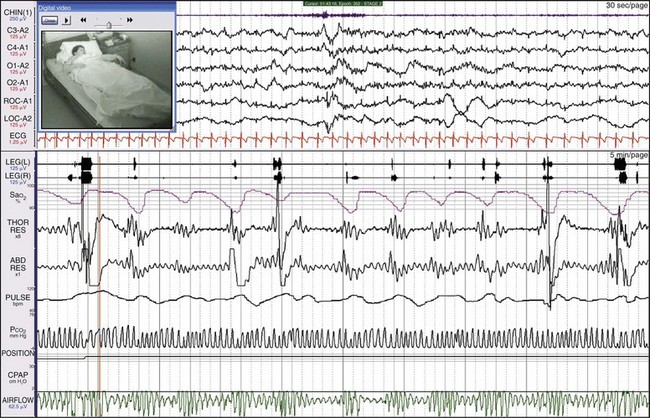
Synchronized digital video is extremely helpful in explaining the physiologic abnormalities in this patient. She slept with her mouth wide open and moved her jaw forward to reestablish breathing. See Videos 35 and 36 on expertconsult.com for recordings of this patient.
The patient is a 31-year-old man with a history of snoring, awakening with severe nocturnal headaches, and morbid obesity (BMI of 49). REM sleep is detected, even though all the EEG channels show a great deal of electrocardiographic (ECG) artifact. The nasal pressure channel suggests that the events are simply episodes of obstructive apnea. The pCO2 channel shows breaths throughout the 2-minute epoch in the lower window. Hypoventilation is suggested by the high end-tidal pCO2 being recorded. Using current data acquisition systems, the clinician can “drill down” and examine individual breaths in great detail (see Fig. 19-14).
The bottom window shows a 15-second epoch. CO2 is being detected with each of the small breaths; breathing frequency is about 26 breaths/min. The digital system can include data points collected throughout on the CO2 channel. The highest end-tidal pCO2 noted here is 54 mm Hg. This number underestimates the true pCO2 for two reasons: 1) oronasal sampling will entrain some air, thereby diluting the airstream; and 2) the patient has a rapid, shallow breathing pattern, which will not result in a true measurement of alveolar pCO2. Thus, interpreting all the data leads to the conclusion that the main problem is hypoventilation. Some health care systems require such documentation to provide the patient with a mechanical ventilator or a bilevel positive airway pressure (BiPAP) device.
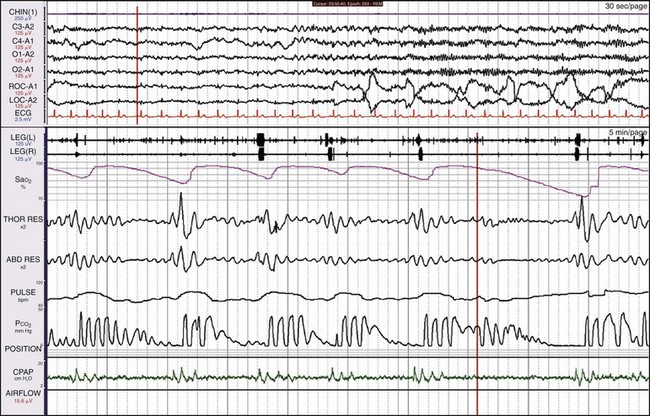
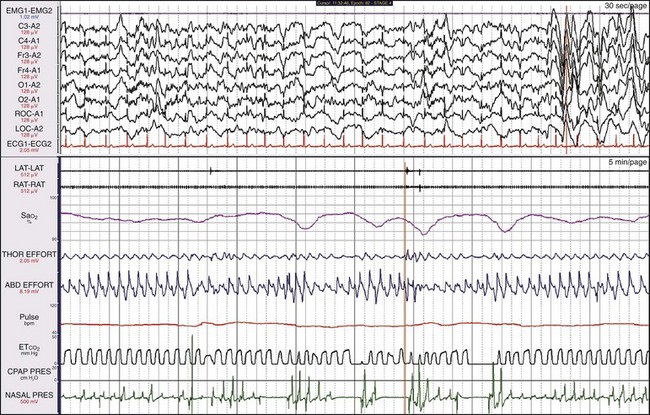
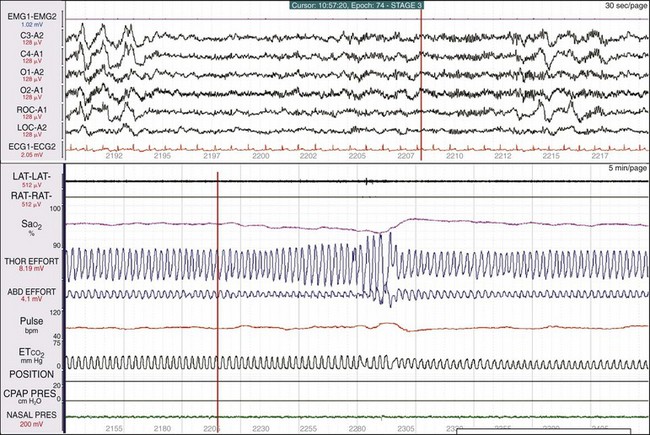
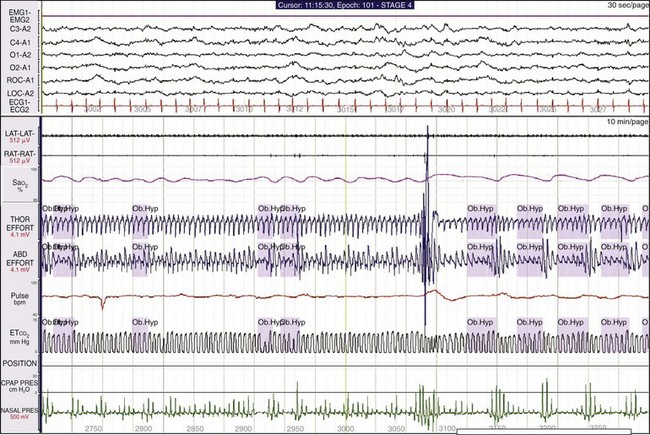
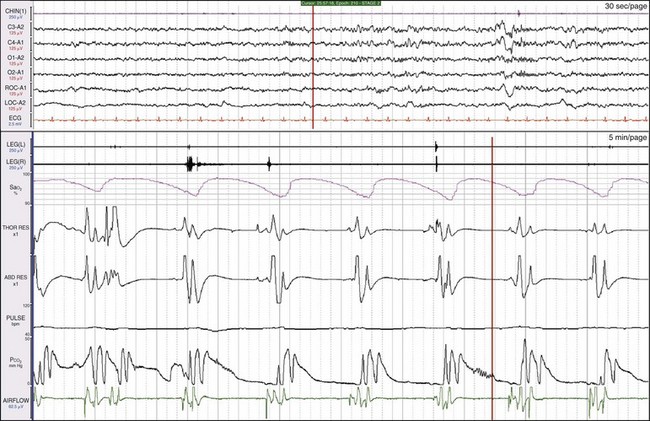
The importance of sleep-stage recording. In this example, the patient has five episodes of oxygen desaturation followed by a much longer episode of apnea, and oxygen desaturation is much greater. The top window is a 30-second epoch and the bottom is a 5-minute epoch; the top and bottom windows are synchronized by the vertical orange lines. In the middle of the upper window, the patient has gone into REM sleep, with sawtooth waves immediately followed by REM sleep. Sleep apnea is generally more severe in REM sleep.
Sleep laboratories often ignore data obtained during wakefulness. These data are from a 49-year-old woman who for 3 years had the perception that her breathing stopped during wakefulness. In addition, she had a history of snoring and severe sleepiness (Epworth sleepiness score of 24). Here the patient is awake but drowsy; notice the slow eye movements.
Here the same patient as shown in Figure 19-16 is in non-REM (NREM) sleep. The abnormal breathing pattern continues.
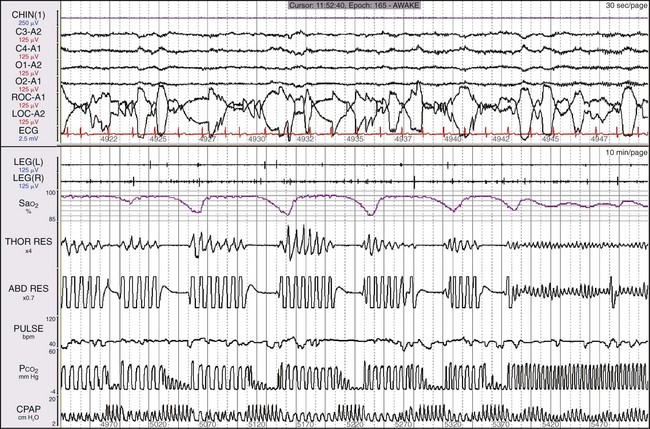
This is the same patient as shown in Figures 19-16 and 19-17. CPAP treatment was ineffective; the patient was then treated with bilevel pressure in a spontaneous mode. Notice in the channel labeled “CPAP” that clusters of 4 to 5 square waves represent the pressure generated by the bilevel machine in response to patient effort, but the apnea episodes continue. In fact, the patient now has central apneas. At the vertical orange line in the middle of the bottom window, the backup rate is added to the bilevel system. By the end of the epoch, both the breathing pattern and SaO2 have normalized.
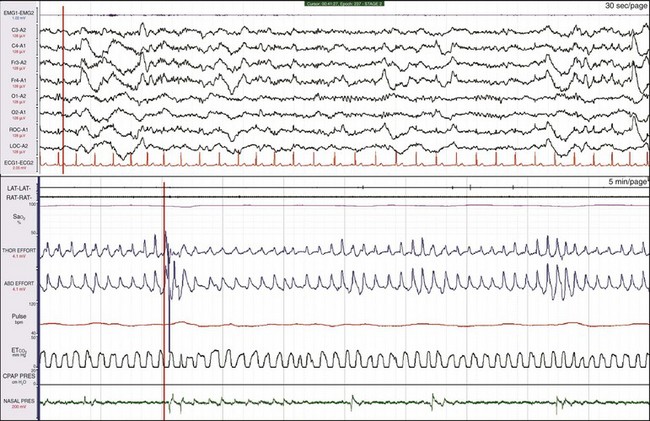
Mixed apnea usually begins with central apnea (absent thoracic and abdominal effort) followed by obstructive apnea, as documented by efforts to breathe in the absence of airflow. Physiologic changes with mixed apnea are very similar to the changes in OSA: oxygen desaturations, increases in heart rate, and arousals. Consequently, most clinicians regard mixed apnea as obstructive events. Patients may respond extremely well to CPAP, or they may develop PAP-emergent central sleep apnea. Whether the PAP-emergent episodes resolve over time (as CO2 receptors recover from blunting) or persist (due to underling cardiac, metabolic, or drug-related factors) depends on the patient’s comorbid conditions and status. These data are from a 50-year-old man who began to snore at age 16 years after sustaining a broken nose playing hockey. The nasal obstruction related to the fracture was never treated, but he responded well to CPAP.
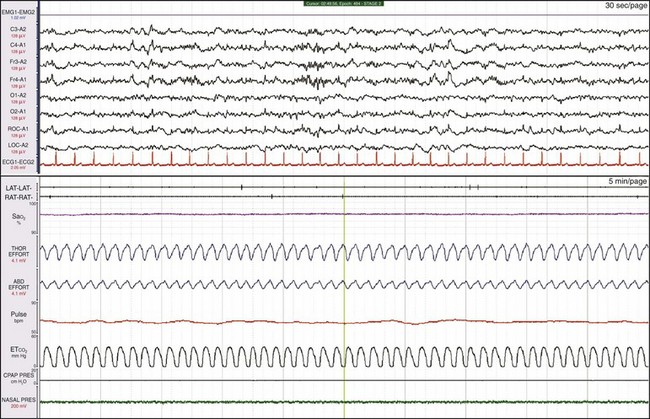
Physical examination showed an enlarged tongue. In this 5-minute recording sample, the range of SaO2 is between 90% and 100%. Thus the drops in SaO2 are quite small. Even though oxygenation pathophysiology was only mild to moderate, the patient had severe sleepiness associated with his abnormal breathing pattern.
This female patient had both severe apnea and severe PLMs. Examining the synchronized digital video is very useful with such patients because the clinician can see and hear episodes of obstruction and the often vigorous movements. This patient moved a great deal during sleep, and she sweated and kicked off her bedclothes. Notice the very large-amplitude low-frequency oscillation in the three channels referenced to the A1 electrode, representing sweat artifact.
This is the same patient as shown in Figure 19-21, now on CPAP. Her breathing has become entirely normal, the leg movements have ceased, and the sweat artifact is gone.
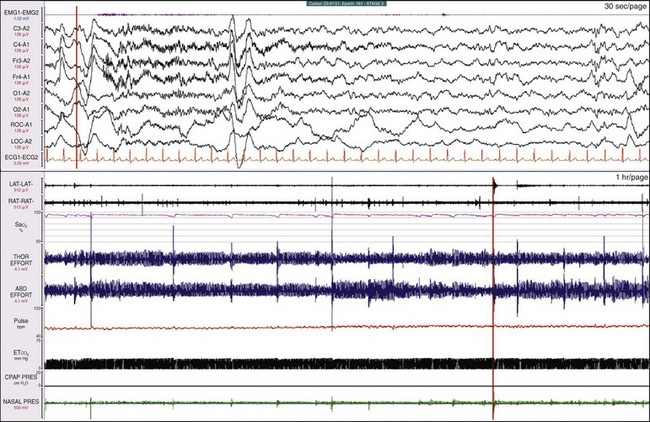
A clue to a sleep breathing abnormality becomes evident when examining the breathing variables in time compression; the bottom window is 1 hour. The SaO2 signal is “ragged,” tiny deflections are associated with sudden increased excursion in thoracic and abdominal effort, and an arousal is noted in the EEG (the orange vertical lines are synchronized). Figures 19-24 and 19-25 show additional information when drilling down on the data.
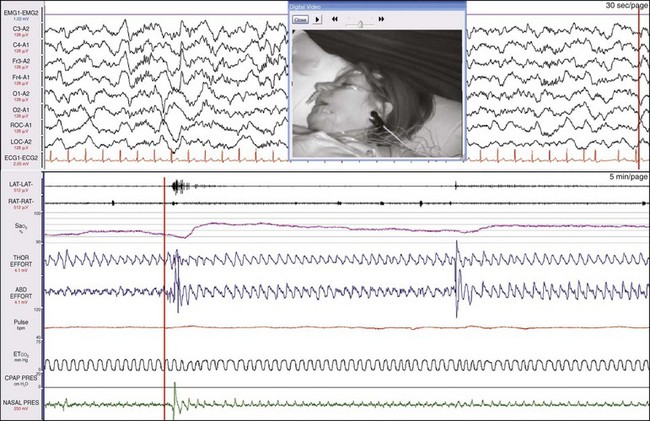
The upper window shows a 30-second epoch and the lower window shows a 5-minute epoch. The gain of the SaO2 signal has been increased, and the scale is 90% to 100%. The synchronized digital video shows that the mouth is open and the patient is snoring quietly. The synchronizing vertical orange lines indicate the patient is one breath away from an event. The drop in SaO2 is only 2%, the nasal pressure changes are small, and the oronasal EtCO2 measurement shows continuous breathing. Figure 19-25 shows a moment one breath later.
The patient has closed her mouth and is now breathing through her nose (see the nasal pressure change). This is followed by an increase in SaO2. On the video, she snorts and then turns her head. The red vertical lines, which synchronize the top and bottom windows, show that this is associated with an arousal on EEG. This is a respiratory effort–related arousal (RERA), although the nasal pressure transducer was not giving the information needed to properly characterize the event. Whereas some experts claim that the nasal pressure transducer is adequate for scoring hypopneas—because in part, they believe mouth breathing is a rare event—it has been our experience that mouth breathing is a very common finding.
The lower window shows a 5-minute epoch. Reductions in SaO2 are small and reverse with increases in the nasal pressure signal. Here the orange synchronizing vertical lines precede a K-complex and a speeding up of the EEG. This is an RERA.
The SaO2 is steady, as is the breathing pattern. Massive REM sleep rebound occurred in the second part of the night when the patient was on CPAP (not shown here).
In some continuous heavy snorers, a slow but progressive reduction is sometimes seen in SaO2, associated with a progressive increase in effort, followed by a snort and then an increase in SaO2. In this example, the change in SaO2 is only about 3%. The patient is breathing entirely through the mouth, and the nasal pressure trace is completely flat and not helpful. This would be scored as an RERA.
The upper and lower windows each show a 1-minute epoch. Notice that in the beginning of the epoch, a very low heart rate (~33 beats/min) is recorded in the R-R channel. The patient is in REM sleep, as indicated in the eye channels. About a quarter of the way into the epoch, a microarousal occurred in response to abnormal breathing. This is an RERA. There has been an increase in the snoring channel and, following the arousal, the heart rate increased abruptly to about 94 beats/min. When the heart rate was low, the ECG indicated a 2 : 1 Mobitz second-degree atrioventricular block, and there were two P waves for each conducted beat. This was presumably caused by increased parasympathetic activity, which in turn was caused by the increase in the patient’s respiratory effort when the upper airway was obstructed. See Figures. 19-70 to 19-73 for more details about heart blocks.
The lower window shows a 10-minute epoch. Small oscillations in SaO2 are associated with changes in nasal pressure, but note that little change occurs in the oronasal pCO2 trace. This suggests that the patient is mouth breathing during each event, thereby causing the reduction in SaO2. The clinician could infer that these are hypopneas. The patient is a 54-year-old man with a BMI of 31 and a 20-year history of snoring, recently observed apnea, and sleepiness. His apnea-hypopnea index was 52.3, but on CPAP it decreased to 7.9. Interpretation of a study should include consideration of all available data; the final diagnosis was severe OSA syndrome.
Central Sleep Apnea
The term central apnea refers to a cessation of breathing in excess of 10 seconds with markedly reduced or absent effort to breathe. Central apnea may occur during wakefulness, as in this example. This is a 71-year-old patient who had central apnea of unknown etiology recorded during both wakefulness and sleep. Note the absence of effort in both the thoracic and abdominal effort channels. The longest episode of apnea is almost 30 seconds. Note the cardiogenic oscillations in the CO2 trace. Although the patient is awake throughout, fluctuating levels of alpha-wave activity appear in the EEG channels. In this example, the patient’s overall breathing rate is only 7 breaths/min. The top window shows a 30-second epoch and the bottom shows a 2-minute epoch. Similar findings occur in some patients who use opioid medications. This patient responded well to low-flow CPAP.
These data are from a 44-year-old soldier treated for severe nerve pain related to an ankle injury. He had had snoring, severe sleepiness, and witnessed apnea for 2 to 3 years. His pain was treated with morphine. He had a breathing frequency of only four or five breaths/min and repetitive cycles of two to three breaths, followed by central apneic episodes. The bottom window shows a 5-minute epoch. It is likely that this pattern is related to the morphine. The patient also had central apnea during wakefulness.
The top and bottom windows each show a 30-minute epoch. REM sleep occurs when there are large, dense deflections in the two electrooculogram (EOG) channels. Notice that the patient’s breathing pattern actually changes during REM, and much less periodicity is evident in the breathing pattern and the SaO2. When the patient emerges from REM sleep at the end of this epoch, the abnormal breathing pattern seen in Figure 19-32 returns. The central apneic episodes in NREM sleep are likely being maintained by the ventilatory chemical control system, which is depressed by morphine. When the patient goes into REM sleep, REM processes override the ventilatory control system.
This patient, a 30-year-old man, came to medical attention with severe daytime sleepiness, snoring, and nocturnal headaches. Episodes of central apnea (reduced or absent thoracic and abdominal efforts) and oxygen desaturations are apparent. Note that each cluster of breaths is made up of only four to five breaths, and the apnea episodes are about 20 seconds long. The top window is a 30-second epoch and the bottom window is a 5-minute epoch. Because of his snoring history, this patient was first tested on CPAP (see Fig. 19-35).
While on CPAP, worsening of the patient’s apneic episodes was marked, to about 40 seconds in length. Complex sleep apnea is a term recently introduced that implies ventilatory instability in some patients leads to episodes of central apnea. Operationally, this is defined as patients who develop central sleep apnea with PAP therapy. By that definition, some might conclude that this patient had a variant of complex sleep apnea. However, defining a disease based on the response to treatment is problematic, and many do not believe that this is an independent entity. The most accurate description of his diagnosis would be “central apnea worsened by positive airway pressure.” Thus, although his history suggested OSA, simply initiating CPAP without monitoring or without first determining apnea type would have placed this patient at increased risk. In the sleep laboratory setting, the clinician could proceed to the next step, testing on BiPAP, as shown in Figure 19-36.
There was a further marked lengthening of this patient’s apneic episodes to about 100 seconds. Clearly this approach was not going to be effective. Rather than proceeding to BiPAP with a timed backup, this patient was started on adaptive servoventilation (ASV), as shown in Figure 19-37.
This type of airway pressure support calculates the patient’s minute ventilation and takes into account the breathing pattern. It compensates by adding additional support during episodes of apnea and less support during hyperpnea. The patient’s episodes of central apnea were resolved by this treatment.
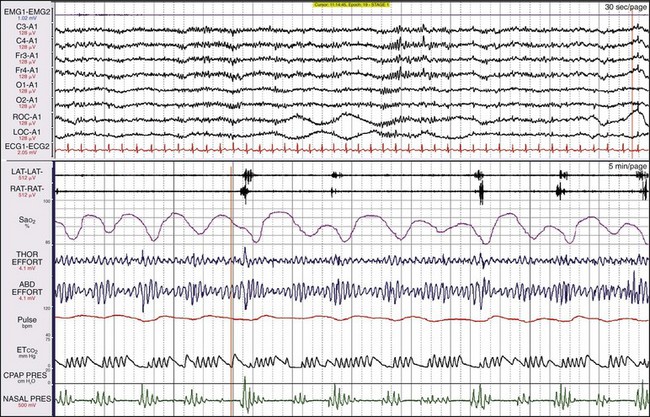
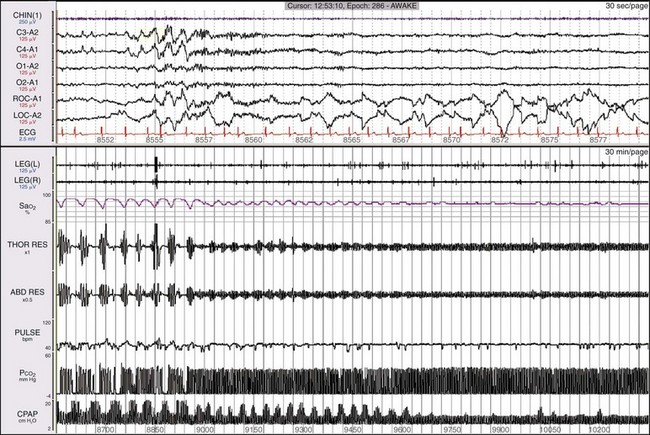
This 55-year-old man came to medical attention with cognitive impairment and sleepiness but no snoring. He was found to have episodes of central apnea and had worsening episodes on CPAP; he had no response to oxygen and was then tested on ASV. The top window shows a 30-second epoch and the bottom shows a 10-minute epoch, each starting at the same time. The channel labeled “CPAP” shows the pressure output of the ASV device. Notice that when the patient is apneic, the device produces the most pressure. By the end of the epoch, the patient’s breathing pattern is normalizing, as is his SaO2. Figure 19-39 shows a more prolonged response.
The lower window shows a 30-minute epoch. Notice that after about 7 minutes, all the data show signs of normalizing, except that the ASV is still showing periodic changes in pressure support. By the end of the epoch, everything has normalized, including the output of the ASV, which is now steady. Thus the pressure support delivered by the ASV device has changed based on changes in the patient’s breathing pattern.![]()
Stay updated, free articles. Join our Telegram channel


Full access? Get Clinical Tree


