Fig. 2.1
Angiographic anatomy of the right internal carotid artery
Fig. 2.2
Angiographic anatomy of the vertebrobasilar system
Inside the skull, each internal carotid artery bifurcates to form the anterior cerebral artery and the middle cerebral artery. The basilar artery gives rise to two posterior cerebral arteries.
The anterior system, composed of 2 internal carotid arteries, and the posterior system composed of the vertebrobasilar system, communicate in the Circle of Willis (Fig. 2.3) via communicating arteries: an anterior communicating artery and two posterior communicating arteries. The anterior communicating artery connects the 2 anterior cerebral arteries in the midline. The posterior communicating artery connects the internal carotid artery to the ipsilateral posterior cerebral artery.
Fig. 2.3
Diagram of the Circle of Willis (inferior view). ACA anterior cerebral artery, MCA middle cerebral artery, PCA posterior cerebral artery, IC internal carotid artery, BT basilar trunk, A-Com anterior communicating artery, P-Com posterior communicating artery
The cerebral blood supply (Fig. 2.4) is ensured by the anterior, middle and posterior cerebral arteries but also by the anterior choroidal artery derived from the posterior aspect of the terminal internal carotid artery and perforating vessels derived from the posterior communicating arteries.
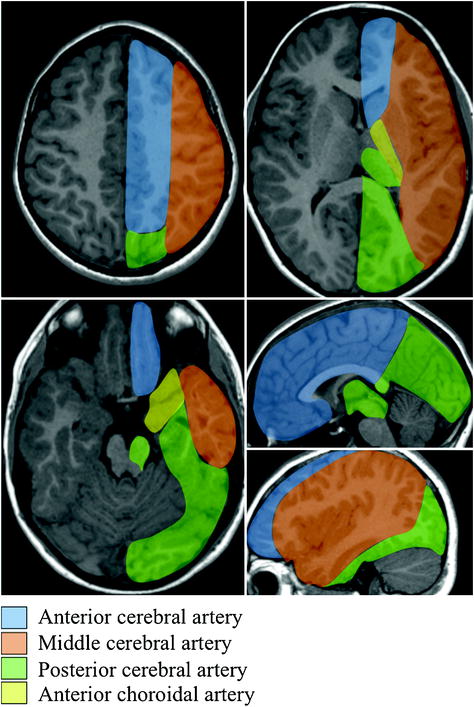
Fig. 2.4
Vascular territories of the brain
The blood supply of the brainstem and cerebellum (Fig. 2.5) is ensured by arteries derived from the terminal vertebral arteries (namely posterior inferior cerebellar artery or PICA and perforating branches) and arteries derived from the basilar artery (anterior inferior cerebellar arteries or AICA, superior cerebellar and perforating vessel system).
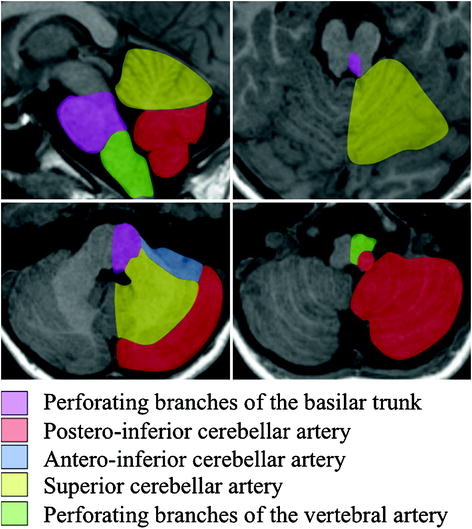
Fig. 2.5
Vascular territories of cerebellum and brainstem
Arterial Anatomical Variants
Many anatomical variants of intracranial or extracranial arteries to the brain can be observed. The internal carotid arteries present the same diameter on each side, while the vertebral arteries are often asymmetrical.
In the presence of asymmetrical internal carotid arteries (Fig. 2.6), the size of the petrous and cavernous portions of the carotid canal must be studied first.
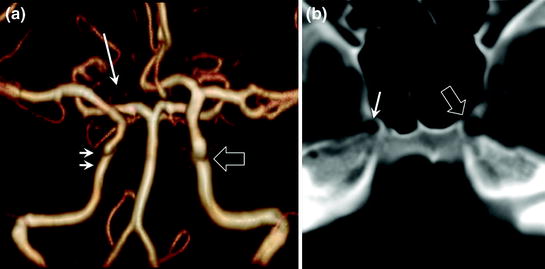
Fig. 2.6
Constitutional asymmetry of internal carotid arteries with a hypoplastic right carotid artery (a intracranial MR angiography, anterior view; double arrows: right internal carotid artery, hollow arrow: left internal carotid artery). CT confirms the presence of a constitutional variant by demonstrating a small carotid canal on the side of the hypoplastic right internal carotid artery (b single arrow) compared with the left carotid canal (b hollow arrow). Also note another variant in this patient with hypoplasia of the first segment of the right anterior cerebral artery (a arrow); both anterior cerebral arteries are supplied by the left internal carotid artery
A small carotid canal on the side of the narrowed internal carotid artery corresponds to very rare constitutional asymmetry. Otherwise, this asymmetry may indicate secondary internal carotid artery stenosis (dissection, atherosclerosis, cerebral vasculitis, etc.)
The vertebral arteries are often asymmetrical, with about 40 % of vertebral arteries of equal size, a dominant left vertebral artery in 35–40 % of cases, and a dominant right vertebral artery in 20–25 % of cases (Fig. 2.7). Marked hypoplasia is observed in 9 % of cases for the right vertebral artery and nearly 6 % of cases for the left vertebral artery. Bilateral hypoplasia of the vertebral arteries is described in 0.75 % of cases. In constitutional asymmetry, the size of the artery remains regular over its entire length with a terminal V4 segment also smaller than the contralateral V4 segment. The diameter of the V4 segment of artery can also be smaller after the origin of the PICA and in case of hypoplasia of the V4 segment. The vertebral artery may even terminate in the posterior inferior cerebellar artery (PICA) on the side of the small vertebral artery.
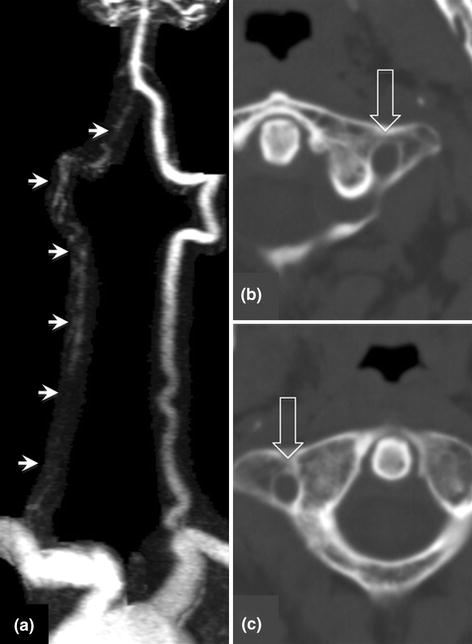
Fig. 2.7
Cerebral MR angiography showing classical features of constitutional asymmetry of the vertebral arteries with a dominant left vertebral artery and a hypoplastic right vertebral artery (a arrows). Note that the transverse foramina are not asymmetrical despite the difference in size of the arteries due to the numerous venous plexuses that also travel along the course of the vertebral arteries (b cervical spine CT scan, hollow arrow, left transverse foramen; c hollow arrow, right transverse foramen)
Many anatomical variants of the Circle of Willis have been described. The most common variants are a ‘foetal’ disposition of the posterior cerebral artery, which arises directly from the internal carotid artery via the posterior communicating artery, and hypoplasia of the first segment of the anterior cerebral artery (A1 segment), in which the artery arises directly from the contralateral internal carotid artery via the anterior communicating artery (Fig. 2.8). These anatomical variants can explain why infarction due to occlusion of a neck artery can extend to adjacent arterial territories and wrongly suggest a cardioembolic origin (Fig. 2.9).
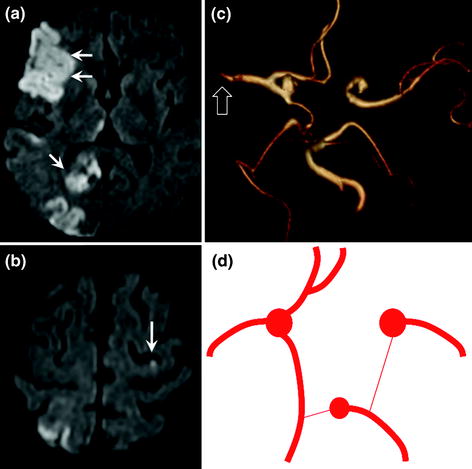
Fig. 2.8
Diagrams of the Circle of Willis (inferior view). Examples of anatomical variants with foetal disposition of the left posterior cerebral artery (a) arising directly from the posterior communicating artery. The first P1 segment is generally present but hypoplastic. Another classical variant (b) with hypoplasia of the first segment of the right anterior cerebral artery. In this case, both anterior cerebral arteries arise from the same internal carotid artery and have a common first segment
Fig. 2.9
Patient with infarction in 3 distinct territories: right MCA (a double arrow) and PCA (a single arrow) territories and distal left ACA territory (b arrow). Infarction is due to emboli derived from the right internal carotid artery. Anatomical variants of the Circle of Willis in this patient account for infarction in these 3 territories: common origin of the 2 anterior cerebral arteries from the right internal carotid artery (hypoplasia of first segment of the left internal carotid artery) and foetal disposition of the right posterior cerebral artery arising directly from the right posterior communicating artery (c MR angiography with 3D reconstruction, inferior view); d diagram showing the variants in this patient. The right middle cerebral artery is interrupted by an embolus (c hollow arrow)
Anatomy of Cerebral Veins
The cerebral venous system presents a wide range of anatomical variants.
Nevertheless, three distinct cerebral venous systems communicating with each other can be identified: deep and superficial venous system and cavernous sinus. The deep and superficial venous systems communicate with each other via the confluence of sinuses or torcular.
The superficial venous system (Fig. 2.10) includes the superior sagittal sinus, which drains into the torcular posteriorly. The superior sagittal sinus receives numerous cortical veins, the largest of which is the superior anastomotic vein (vein of Trolard). Blood from the torcular is drained by the left and right transverse sinuses and the sigmoid sinuses and finally the internal jugular veins that leave the skull via the jugular foramina. Several cortical veins drain into the sigmoid sinuses and transverse sinuses, the largest of which is the inferior anastomotic vein (vein of Labbé).
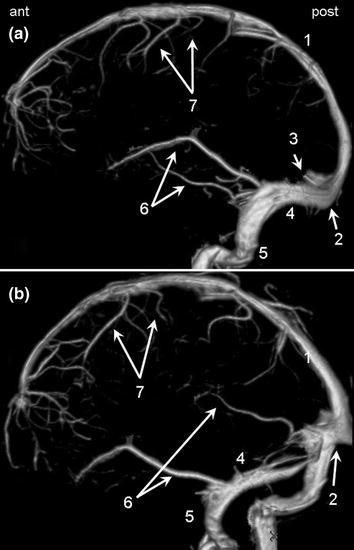
Fig. 2.10
Lateral view (a) and oblique view (b) of the superficial cerebral venous system. 1 Superior sagittal sinus. 2 Torcular. 3 Straight sinus (sectioned). 4 Transverse sinus. 5 Sigmoid sinus. 6 Inferior anastomotic veins (veins of Labbé). 7 Superior anastomotic veins (veins of Trolard)
The deep venous system (Fig. 2.11) comprises the midline inferior sagittal sinus, the paramedian deep cerebral veins and the basal veins around the midbrain. All of these veins converge posteriorly to form the great cerebral vein of Galien that drains into the straight sinus and finally the torcular, where the deep and superficial systems meet. The basal veins also drain anteriorly into the cavernous sinus.
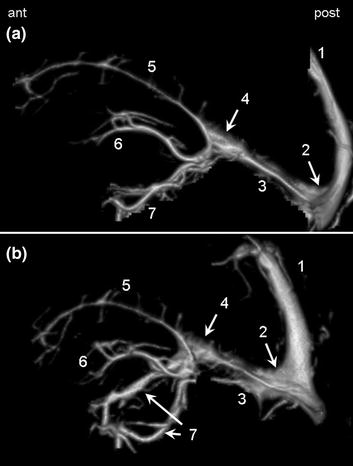
Fig. 2.11
Lateral view (a) and oblique view (b) of the deep cerebral venous system. 1 Superior sagittal sinus (sectioned). 2 Torcular. 3 Straight sinus. 4 Great cerebral vein of Galien. 5 Inferior sagittal sinus. 6 Deep cerebral veins. 7 Basal veins (of Rosenthal)
The cavernous sinus is a pericarotid venous network situated laterally to the body of the sphenoid. It drains the majority of facial veins and part of the deep cerebral venous system via the basal veins and superficial cortical veins via the superficial middle cerebral veins.
Epidemiology of Cerebral Infarction
Leading cause of acquired disability in adults.
Second leading cause of dementia (after Alzheimer’s disease).
Third leading cause of death.
20 % mortality at 1 month; 1/3 of survivors are dependent for activities of daily living.
Incidence
Ranging from 210 to 600/100,000 inhabitants per year, according to the country.
One-year recurrence rate without treatment
12 % for cardioembolic infarcts.
15 % for infarcts due to atherosclerotic carotid artery stenosis when not operated.
One-Year Recurrence Rate with Treatment
2 % for atrial fibrillation (AF) treated by oral anticoagulants.
3 % for carotid artery infarction after surgical treatment of atherosclerotic carotid artery stenosis.
Risk Factors
Non-modifiable: age, male gender (incidence 1.25 × female gender).
Modifiable: hypertension (risk × 4), dyslipidaemia (risk × 1.5), smoking (risk × 1.5), diabetes (risk × 3), alcohol (risk × 3–6), obesity (risk × 2), oral contraceptive (risk × 2), AF (leading cause of cardioembolic stroke and 50 % of cardioembolic strokes in rich countries).
Imaging of Acute Cerebral Infarction
CT
CT generally visualizes signs of ischaemia by the third hour (Fig. 2.12).
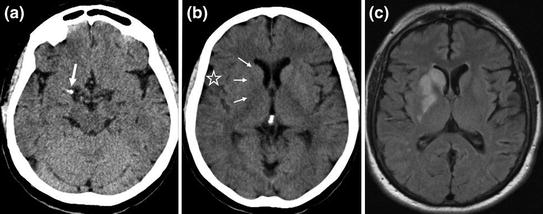
Fig. 2.12
Early signs of deep middle cerebral artery infarction on CT scan. Hyperdensity of first segment (M1) of the right middle cerebral artery (a arrow) due to the presence of intra-arterial clot caused by thrombosis or embolism with loss of the normal contours of the basal ganglia (b triple arrows) compared with the contralateral side. Slight loss of cortical sulci of the lateral sulcus (star) due to oedema. MRI FLAIR sequence (c) confirms the hyperintense deep middle cerebral artery infarction
These signs vary according to the territory concerned:
Middle cerebral artery: loss of the normal contour of the basal ganglia compared with the contralateral side and loss of the cortical sulci of the lateral sulcus due to oedema.
Anterior and posterior cerebral arteries and superficial territory of the middle cerebral artery: loss of cortical-subcortical differentiation, cortical grey matter becomes hypodense, blurring with the adjacent white matter.
The clot in the artery is generally visualized at an early stage, within the first minutes, as a linear hyperdensity.
In the case of haemorrhagic transformation of the infarction or primary haemorrhagic stroke, bleeding is visualized as a hyperdensity within the hypodensity of the affected cerebral parenchyma.
MRI
MRI visualizes early signs of ischaemia within 30 min for morphological sequences and by the first minutes for perfusion-weighted sequences (Figs. 2.13 and 2.14).
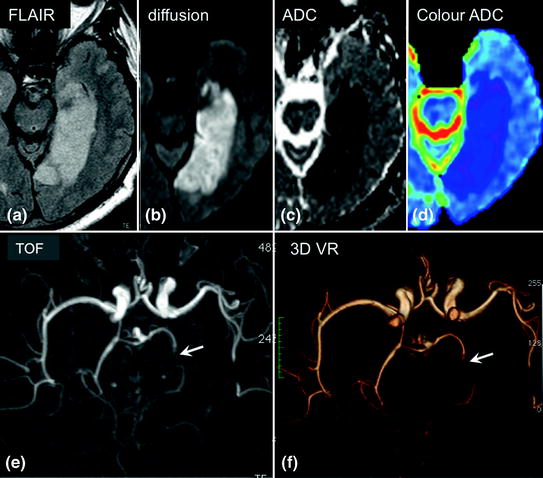
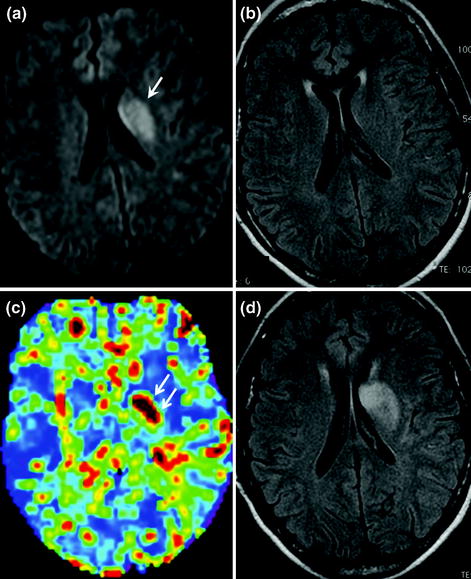
Fig. 2.13
Infarction in the territory of the left posterior cerebral artery after less than 24 h. The infarct is visible on FLAIR sequences (a) and diffusion-weighted imaging (b) as areas of hyperintensity. Apparent diffusion coefficient (ADC) mapping appears hypointense (c) on black and white maps or more intensely blue than the adjacent healthy parenchyma on colour maps (d). Arterial time-of-flight (TOF) MR angiography of the Circle of Willis (e inferior view) and 3D volume reconstruction (f volume rendering or VR) showing loss of the intravascular signal in the left posterior cerebral artery (arrow) compared to the healthy contralateral side
Fig. 2.14
Early phase (1st hour) of deep middle cerebral artery infarction on MRI. Note the absence of abnormalities on the FLAIR sequence (b) with abnormal diffusion-weighted (a arrow) and perfusion-weighted sequences (c markedly increased MTT, double arrows), demonstrating the cerebral ischaemia (decreased ADC and marked increase of MTT). Follow-up MRI 24 h later (d) shows the appearance of ischaemic abnormalities on FLAIR imaging
Restricted diffusion (hyperintensity) with early decrease of ADC by 30 min. ADC then gradually returns to normal after about 10 days, and subsequently increases thereafter (Fig. 2.15).
Fig. 2.15
Signal variation on diffusion-weighted imaging and ADC mapping as a function of time after onset of ischaemic stroke
FLAIR and T2-weighted imaging: hyperintensity of ischaemic parenchyma by the third hour.
Perfusion-weighted imaging: abnormalities are visible at an early stage, by the first minutes, as decreased cerebral blood volume (CBV) and cerebral blood flow (CBF) and increased mean transit time (MTT).
On T2-weighted gradient-echo imaging, the clot may be visible in the artery as endoluminal hypointensity.
On TOF sequences: arterial occlusion or stenosis. N.B.: TOF sequences are T1-weighted and the occlusive intravascular clot may appear spontaneously hyperintense on T1-weighted imaging, giving a falsely patent appearance of the artery: carefully examine the distal run-off, which is poorer than on the healthy contralateral side.
In the case of haemorrhagic transformation of the infarction or primary haemorrhagic stroke, bleeding appears hypointense within the ischaemic zone on T2-weighted gradient-echo sequences.
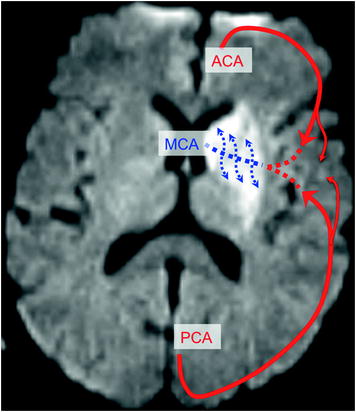
Collateral Circulation (Fig. 2.16)
Following proximal occlusion of an artery, distal collateral circulation may be ensured by leptomeningeal anastomoses with distal arteries of adjacent territories. A classical example is deep middle cerebral artery infarction (lenticulostriate arteries derived from the M1 segment of the middle cerebral artery) without superficial middle cerebral artery infarction despite occlusion of the origin of the middle cerebral artery. Ischaemia is observed in the lenticulostriate territory, in which the blood supply is terminal, in contrast with the superficial territory, in which the cortical branches of the MCA can be supplied by pial anastomoses with the ACA and/or PCA territories. This collateral circulation may subsequently be insufficient over the hours and days following onset of the symptoms, particularly in a context of poor haemodynamic conditions, such as low blood pressure or intracranial hypertension, possibly resulting in extension of deep infarction towards superficial territories, resulting in complete infarction (Fig. 2.17).