von Helmholtz
15.1 Introduction
The first step in evaluating a patient’s hemodynamics is, without doubt, the clinical assessment. Bedside observation of the patient’s general appearance, skin temperature, capillary refill, sensory status, diuresis, filling of the external jugular vein and so on, will give the physician an approximate idea of the hemodynamics. However, clinical data are often nonspecific and subjective and can be altered by the patient’s concomitant conditions.
Invasive hemodynamic monitoring yields accurate, objective and reliable data about intracardiac and intravascular pressure, blood flow volume and distribution, oxygen supply to tissues and the use thereof by cells. Assessment of hemodynamic status should include measurement of tissue oxygenation (Figure 15.1). In the presence of oxygen, aerobic cellular metabolism produces a significant amount of energy (ATP) and non-toxic and easily removed waste product metabolites (CO2). In the absence of oxygen, anaerobic cell metabolism produces little energy and toxic metabolites (lactic acid).
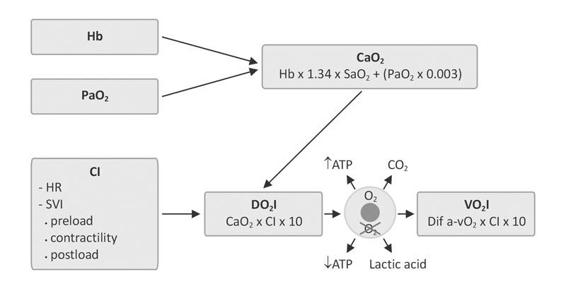
Figure 15.1. Alveolar partial pressure of oxygen (PaO2) and hemoglobin (Hb) are determinants of arterial oxygen content (CaO2). Cardiac index (CI) is derived from the stroke volume index (SVI) and heart rate (HR), oxygen delivery index (DO2I) and oxygen consumption index (VO2I).
15.2 Indications and Complexity of Hemodynamic Monitoring
Hemodynamic data are useful or even essential in proper patient management. As a general rule, the more severe the condition, the greater the complexity and depth of monitoring. A corollary to this is an appropriate risk/benefit ratio, since invasive monitoring is not devoid of complications, along with the cost/benefit ratio in the rational use of health resources, avoiding excessive spending wherever possible.
The information obtained should allow diagnosis, prognosis and effective treatment that will ensure the best outcome for the patient in terms of morbidity and mortality, minimizing risks through a more effective use of medical resources.
Noninvasive monitoring of heart rate, respiratory rate, and blood pressure, electrocardiography (ECG), pulse oximetry and exhaled CO2 provide comprehensive information of the circulatory status.
Invasive monitoring involves the percutaneous introduction of catheters into the intravascular space to directly measure certain variables from which others can be calculated for more accurate and specific control of a particular hemodynamic situation.
Before a diagnosis can be established, hemodynamic monitoring data are necessary to obtain a quantitative basis which, together with the operator’s clinical criteria, can aid in proper decision-making.
15.3 Definitions and Hemodynamic Parameters
15.3.1 Definitions
Preload. The load or volume that distends the left ventricular end-diastolic volume (Figure 15.2). It is determined by the volume of blood at the end of ventricular filling (left ventricular end-diastolic volume, LVEDV) [1]. The LVEDV correlates with left ventricular end-diastolic pressure (LVEDP) in ventricles with normal compliance. In restrictive ventricles (ischemic or hypertrophic) a higher filling pressure is needed to have an adequate volume at the end of diastole. Pulmonary capillary wedge pressure (PCWP) indicates left ventricular preload. The central venous pressure (CVP) is the practical expression of right ventricular preload.
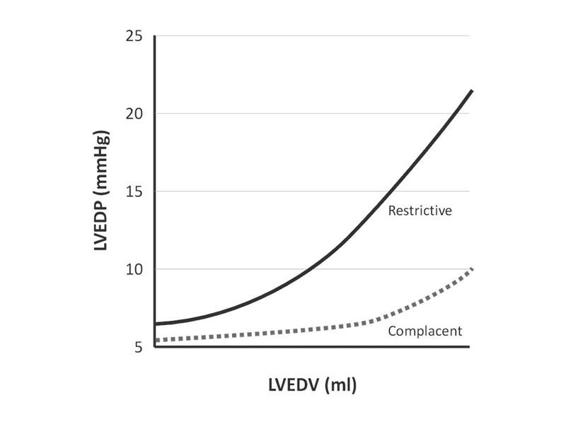
Figure 15.2. Preload: pressure/volume in complacent and restrictive ventricles.
LVEDV = left ventricular end-diastolic volume; LVEDP = left ventricular end-diastolic pressure.
Contractility. The ability of cardiac muscle fibre to shorten after elongation. Prior knowledge of ventricular function through ventricular ejection fraction and fractional shortening provide useful baseline information in hemodynamic management. During monitoring the contractile capacity can be roughly related to the contractility index (CI) or the stroke volume index (SVI), although these parameters are also influenced by preload and afterload.
A somewhat more specific parameter of contractility is the ventricular stroke work index.
Afterload. Determined by the resistance to ventricular ejection, which is opposed to ventricular emptying during systole [2,3]. Left ventricular afterload is expressed as systemic vascular resistance (SVR), which is directly proportional to the pressure difference between the two ends of systemic circulation (mean arterial pressure-central venous pressure, MAP-CPV) and inversely proportional to blood flow (cardiac output, CO). Right ventricular afterload is expressed as pulmonary vascular resistance (PVR), which is directly proportional to the pressure difference between the ends of pulmonary circulation (mean pulmonary artery pressure-pressure wedge, MPAP-PW) and inversely proportional to cardiac output.
15.3.2 Hemodynamic Parameters
Parameters in a hemodynamic profile include pressure and flow data, some measured directly and others calculated therefrom (Table 15.1).
Measured variables |
|
Calculated variables |
|
Metabolic variables | In addition to pressure and flow rate, tissue oxygenation parameters are also monitored:
|
Hemodynamic parameters |
|
Calculated hemodynamic parameters |
|
Table 15.1 Parameters in hemodynamic monitoring.
15.4 Pressure Monitoring
Arterial blood pressure and central venous pressure are the most common parameters measured in the ICU patient.
15.4.1 Arterial Blood Pressure
Mean arterial pressure (MAP), the best parameter for assessing global perfusion pressure of all organs, should ideally be between 70 and 100 mmHg. The radial artery is most commonly used for intra-arterial catheter placement, but the brachial, femoral or pedal artery can also be used. In intra-aortic balloon counterpulsation, arterial blood pressure is measured with the same lumen of the balloon catheter.
Perfusion pressure requirements differ depending on the clinical situation and the organ in question. In the postoperative period after cardiac surgery, MAP must be >70 mmHg to ensure good perfusion of the bypass and good coronary blood flow (CBF), but it should be <100 mmHg to minimize postoperative bleeding. In a brain-injured patient with elevated intracranial pressure (ICP), however, MAP must be high enough to ensure adequate cerebral perfusion pressure (CPP). A patient in postoperative renal transplant requires good perfusion pressure to maintain adequate glomerular filtration rate of the graft.
In addition to MAP, systolic blood pressure (SBP), diastolic blood pressure (DBP) and differential pressure (DP) allow us to infer a particular hemodynamic situation. A low diastolic pressure with a high differential may generate (besides aortic insufficiency) a pattern of vasodilatation and high cardiac output (sepsis). By contrast, a small differential pressure, with impingement of the SBP and DBP, can generate a pattern of low cardiac output (hypovolemia, cardiogenic shock).
The morphology of the curve offers additional information. Uneven and irregular arterial pressure waves can be seen in certain arrhythmias such as atrial fibrillation; unlike the ECG tracing, the monitor shows a higher pulse rate, i.e., the effective heartbeat is greater. And it also shows the variation in the amplitude of the pulse wave in relation to breathing [4], which is very evident in a patient with hypovolemia or cardiac tamponade (pulsus paradoxus: systolic pressure variation >12 mmHg between inspiration and expiration). This is magnified even more in patients on mechanical ventilation [5]. Pronounced respiratory variation of the pulse wave is also observed in patients with airflow obstruction. Therefore, bedside analysis of the arterial pressure wave is important in hemodynamic evaluation (Figures 15.3 and 15.4).
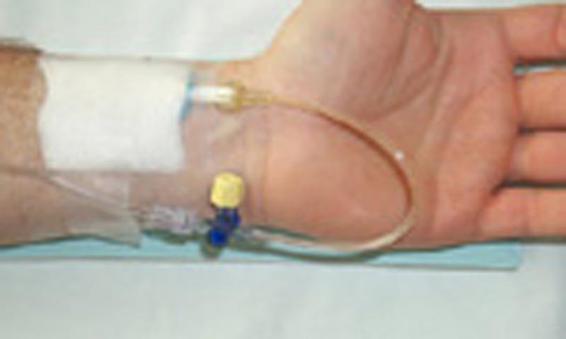
Figure 15.3. Radial artery catheter.
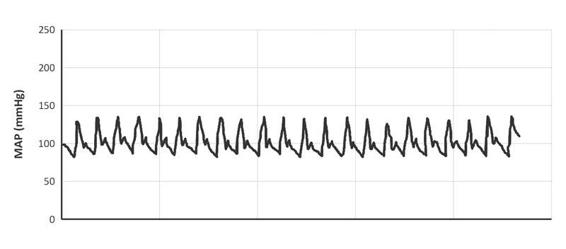
Figure 15.4. Curve of arterial blood pressure (MAP).
15.4.2 Central Venous Pressure
The introduction of central venous pressure monitoring in 1962 was the first step in bedside hemodynamic monitoring. The most common vascular access in ICU patients is via subclavian or internal jugular vein puncture. The distal end should be located in the distal part of the vena cava, without entering the right atrium or touching the tricuspid valve, as this can cause arrhythmias. The catheter serves for the infusion of solutions and drugs and to measure central venous pressure (CVP). This is an indicator of the balance between systemic venous return and right ventricular (RV) function. Its normal value is between 8 and 12 mmHg or, more widely, between 5 and 15 mmHg, although this “normal” value may differ depending on the patient’s clinical situation. CVP is not correlated with right ventricular end-diastolic volume in critically ill patients, and it does not correlate with left ventricular preload in patients with right ventricular failure or pulmonary vascular disease; however, in many cases when these values are extremely low or high, CVP can reflect a reduction or an increase in relative or absolute intravascular volume. The respiratory variation of CVP is due to a drop in CVP during inspiration, which is more marked in a setting of hypovolemia [6]. The greater the drop in CVP, the greater the need for volume replacement. Despite these limitations, CVP in the hands of an experienced operator is a useful parameter in the hemodynamic management of patients in intensive care. Figure 15.5 shows the standard morphology of the CPV curve.
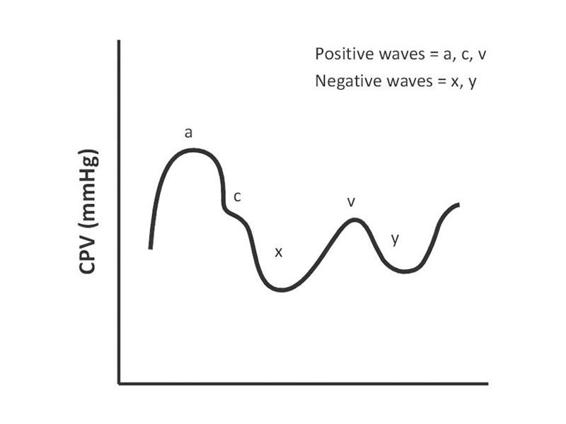
Figure 15.5. Morphology of the central venous pressure (CPV) curve.
15.5 Pulmonary Artery Pressure and the Swan-Ganz Catheter
The development and clinical application of a pulmonary artery catheter introduced by Swan and Ganz in 1970 provided a relatively simple, safe, fast and accurate way to measure pulmonary artery pressure and to estimate left ventricular end-diastolic pressure through the measurement of wedge pressure or pulmonary capillary wedge pressure.
Use of the Swan-Ganz catheter allows the calculation of cardiac output by the thermodilution method, as well as sampling of mixed venous blood from the pulmonary artery to assess systemic oxygenation.
The primary data are the measured variables; by applying mathematic formulas, other variables called secondary or calculated variables are obtained which complete the spectrum of hemodynamic information (Table 15.1) [7,8].
Later refinements to the original catheter have increased its usefulness, so that we can now continuously monitor cardiac output, determine the right ventricular ejection fraction, continuously measure right atrial pressure and oxygen saturation of mixed venous blood. There are also models that incorporate electrodes that can stimulate the right atrium or the right ventricle like a pacemaker.
15.5.1 Indications for Pulmonary Artery Catheterization
While there are no absolute rules that define the need for a Swan-Ganz catheter, there are clear recommendations for its use in certain contexts, such as acute myocardial infarction (AMI) with hemodynamic compromise. Its usefulness in other situations, such as routine use in cardiovascular surgery patients remains controversial. It can be useful in patients presenting with patterns of shock or severe hemodynamic instability or situations where the physician’s experience suggests its use is warranted.
- Diagnosis or guide in the treatment of acute myocardial infarction:
- Progressive heart failure, acute pulmonary edema.
- Cardiogenic shock or progressive hypotension [9].
- Mechanical complications (acute mitral insufficiency).
- Doubt about the hemodynamic pattern: peripheral hypoperfusion or hypotension unresponsive to fluid administration without pulmonary congestion.
- Patients with suspected AMI with hemodynamic compromise of the right ventricle.
- Progressive heart failure, acute pulmonary edema.
- Determining the cause of dyspnea and hypoxemia:
- Patients with coexisting cardiac and pulmonary disease (diagnostic difficulties and therapeutic dilemmas).
- Patients with AMI and shock of unknown cause.
- Patients with coexisting cardiac and pulmonary disease (diagnostic difficulties and therapeutic dilemmas).
- Refractory heart failure:
- Patients with dilated cardiomyopathy, hospitalized for decompensated heart failure, difficult to manage, requiring high doses of inotropes.
- Suspected pulmonary embolism with hemodynamic compromise.
- Septic shock [8,10,11], traumatic shock [12], vasoplegia.
Relative indications are:
Related posts:
 Neuroscience Critical Care: Two Experts’ Point of View
Neurocritical Care of Patients With Arteriovenous Malformations
Neuroscience Critical Care: Two Experts’ Point of View
Neurocritical Care of Patients With Arteriovenous Malformations
 Pathophysiology of Intracranial Hypertension
Concepts and Management of Brain Death and Management of Potential Organ Donation
Pathophysiology of Intracranial Hypertension
Concepts and Management of Brain Death and Management of Potential Organ Donation
 Extracranial Atherosclerotic Carotid Artery Disease
 Surgical Treatment of Spinal Cord Injury
Stay updated, free articles. Join our Telegram channel

Full access? Get Clinical Tree


