Fig. 9.1
Three steps of the “triple jump” approach
9.3 Results
Figure 9.2 depicts a 3D-rendered quantitative T1 map of a living subject in an anatomically “normal” view with gyri and sulci (Fig. 9.2a) and in an inflated view (Fig. 9.2b). The inflated surface map shows a very heterogeneous spatial T1 distribution on the lateral convexity with low T1 regions rostral and caudal to the central sulcus, in the planum temporale (lower bank of the Sylvian fissure), on the lateral occipital surface, and around the occipital pole extending further medio-rostrally along the calcarine sulcus (not shown). It is interesting to compare this T1 map with a map of myelin density in a post-mortem brain (Fig. 9.3). In the 1950s Adolf Hopf, working in the Institute for Brain Research and General Biology (Institut für Hirnforschung und allgemeine Biologie) in Neustadt in the Black Forest (directed at that time by Oskar Vogt) started to produce semi-quantitative maps of the density of myelinated fibers (“Gesamtfaserdichte”) in the cerebral cortex. The map shown in Fig. 9.3 is a collage from three different publications by Hopf: a map of the frontal (Hopf 1956), parietal (Hopf and Vitzthum 1957), and temporal lobe (Hopf 1955). The maps are based on earlier qualitative myeloarchitectonic parcellations of the frontal (Strasburger 1937; Vogt 1910), parietal (Batsch 1956; Vogt 1911) and temporal cortex (Hopf 1954). The occipital cortex was never charted, so that part of the brain remains a “terra incognita”. The dashed and dotted lines in Fig. 9.3 represent the boundaries of the myeloarchitectonic areas, the grey values are a semi-quantitative measure of the average density of myelinated fibers within each area. Dark grey represents a high, light grey a low mean fiber density. There is a striking correspondence between high fiber density (dark in Fig. 9.3) and low T1 values (dark in Fig. 9.2) rostral and caudal to the central sulcus and in the planum temporale. The most probable candidates for the “dark” regions rostral and caudal to the central sulcus are the primary motor (M1) and somatosensory (S1) cortex, respectively. The “dark” area in the planum temporale most probably belongs to the primary auditory cortex (A1). A plausible candidate for the “dark” region on the lateral occipital surface is area V5/MT, known from human post-mortem studies (Clarke and Miklossy 1990) to be heavily myelinated. The “dark” patch around the occipital pole extending on the mesial surface further rostrally along the calcarine sulcus most likely corresponds to the primary visual cortex (V1) that owes its high myelination to the very prominent myelin-rich Stria of Gennari.
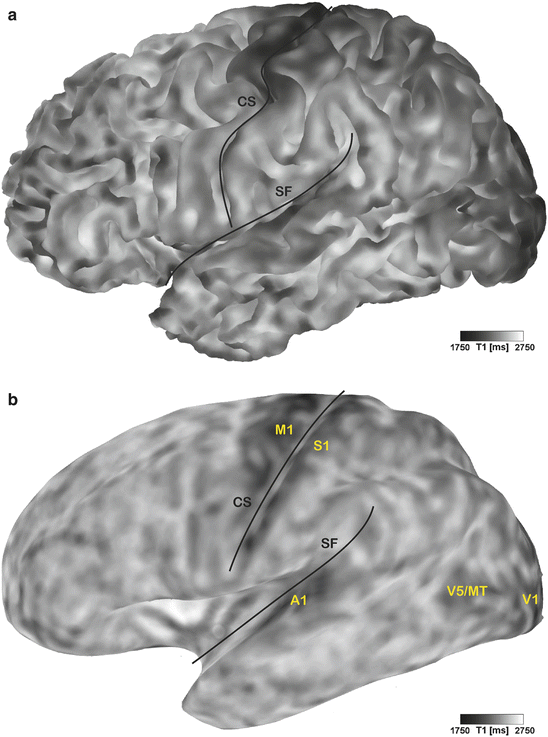
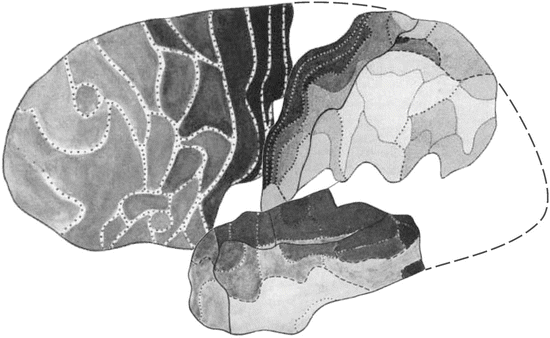

Fig. 9.2
In vivo quantitative T1 map in an anatomically “normal” (a) and an inflated (b) view. Dark regions with low T1 values reflect cortical areas with increased density of myelinated fibers (cf. Fig. 9.3). All major primary functional areas (M1, primary motor; S1, somatosensory; A1, auditory; and V1, visual area), known for their high myelination, can be identified. CS, central sulcus; SF, Sylvian fissure; V5/MT, motion selective visual area V5/MT

Fig. 9.3
Semi-quantitative map of the density of myelinated fibers based on microscopic analysis of myelin-stained sections from post-mortem brains. Dashed and dotted lines represent boundaries of myeloarchitectonic areas, grey values indicate average density of myelinated fibers within each area (light gray: low density, dark gray: high density). Collage from three publications by Adolf Hopf: frontal cortex map reproduced from Hopf (1956), parietal cortex map from Hopf and Vitzthum (1957), and temporal cortex map from Hopf (1955). Note striking correspondence between high fiber density (dark in Fig. 9.3) and low T1 values (dark in Fig. 9.2)
This qualitative comparison between ex-vivo myelination and in-vivo T1 values shows the approximate location and extent of heavily myelinated, mainly primary areas on the cortical surface. However, what is ultimately needed for a valid correlation with functional imaging data, are precise borders between cortical areas – and here the “triple jump” approach comes into play since, classically, structural borders between areas are defined by their myelo- and cytoarchitectonic pattern ex vivo. Figure 9.4a, b shows a tissue block (pre- and postcentral gyrus, in situ in Fig. 9.4a and after dissection in Fig. 9.4b) from a post-mortem human brain prior to MR scanning and histological processing. M1 denotes the primary motor cortex in the posterior wall of the precentral gyrus, S1 the primary somatosensory cortex in the anterior wall of the postcentral gyrus. A quantitative T1 map of the tissue block (for plane of sectioning see rectangle in Fig. 9.4b) is shown in Fig. 9.4c. The arrow indicates a sharp change in T1 contrast at the base of the precentral gyrus that matches a change in the myelo- and cytoarchitectonic pattern (see further below). Fig. 9.5 shows two adjacent sections from a corresponding position of the same tissue block stained for myelin basic protein (myeloarchitecture, Fig. 9.5a) and cell bodies (cytoarchitecture, Fig. 9.5b). Only the fundus region of the central sulcus is shown. The drop in T1 values at the base of the precentral gyrus (arrow in Fig. 9.4c) coincides with an increase in myelin basic protein immunostaining (line in Fig. 9.5a). In an accompanying section stained for cell bodies, this position is characterized by an increase in gray matter thickness, a disappearing inner granular layer (asterisks), and emerging giant pyramidal (Betz) cells (arrowheads). This transition (line in Fig. 9.5b) marks the border between area 3a (somatosensory cortex) and area 4 (primary motor cortex; Geyer et al. 1999). The final step of the “triple jump” approach is to transfer this microanatomically validated “T1 border” to living brains and define the same border in vivo. A T1 map of the central sulcus region in a living subject (coronal view of a brain section in Fig. 9.6a, latero-dorsal view of the 3-D rendered and inflated cortical surface in Fig. 9.6b) shows a sharp drop in T1 values and an increase in cortical thickness at the base of the precentral gyrus (arrows in Fig. 9.6a and dashed line in Fig. 9.6b). Position and MR parameters of this border in vivo match the corresponding border between area 3a and 4 ex vivo (cf. Figs. 9.4 and 9.5).
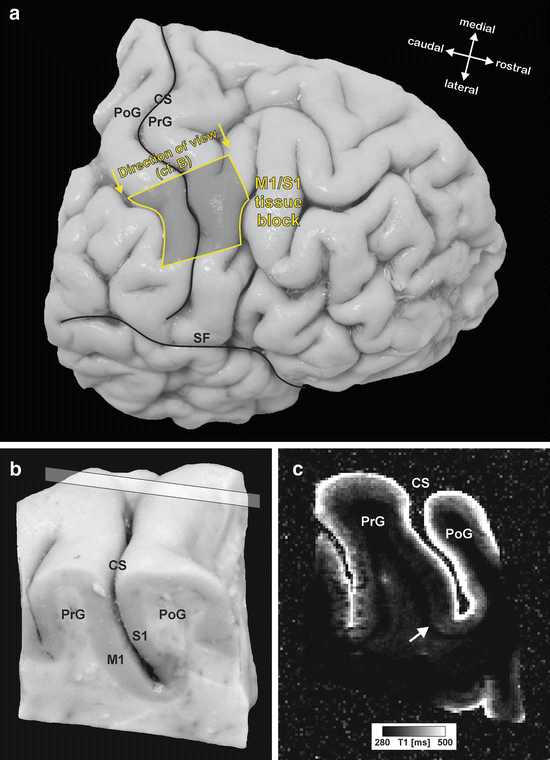
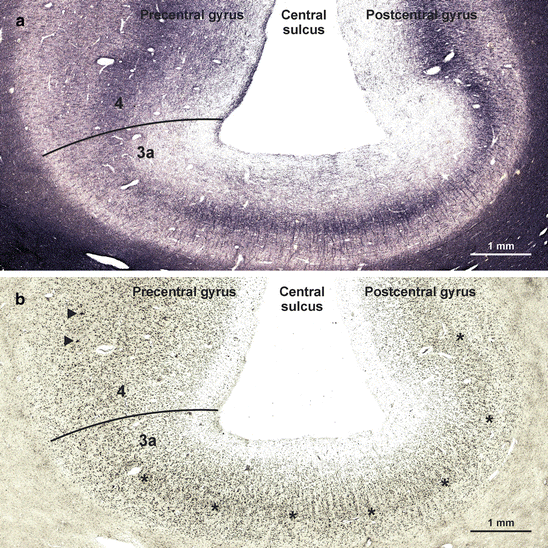
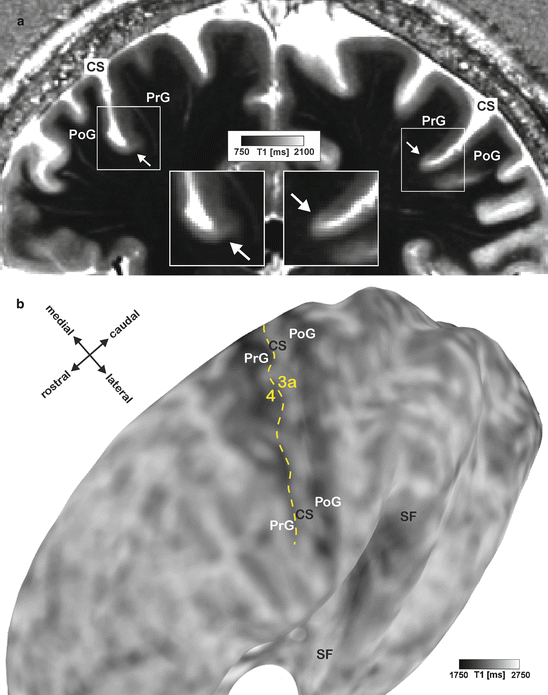

Fig. 9.4
Ex vivo mapping of the border between primary motor (area 4) and somatosensory (area 3a) cortex. (a, b) Tissue block of the precentral (PrG) and postcentral (PoG) gyrus in situ (a) and after dissection (b) from a post-mortem human brain. (c) Quantitative T1 map of the tissue block (for plane of sectioning see rectangle in b). Arrow indicates a sharp change in T1 contrast at the base of the precentral gyrus that matches a change in the myelo- and cytoarchitectonic pattern (see Fig. 9.5). CS, central sulcus; M1, primary motor cortex; S1, primary somatosensory cortex; SF, Sylvian fissure (Panel b and c reproduced from Geyer et al. 2011)

Fig. 9.5
Ex vivo mapping of the border between primary motor (area 4) and somatosensory (area 3a) cortex. Two adjacent sections from a corresponding position of the same tissue block (cf. Fig. 9.4c) stained for myelin basic protein (myeloarchitecture, a) and cell bodies (cytoarchitecture, b). Micrographs show fundus of the central sulcus (same orientation as in Figs. 9.4b, c). The drop in T1 values at the base of the precentral gyrus (cf. Fig. 9.4c) coincides with an increase in myelin basic protein immunostaining (line in a). In an accompanying section stained for cell bodies, this position is characterized by an increase in gray matter thickness, a disappearing inner granular layer (asterisks), and emerging giant pyramidal (Betz) cells (arrowheads). This transition (line in b) marks the border between area 3a (somatosensory cortex) and area 4 (primary motor cortex) (Panel a and b reproduced from Geyer et al. 2011)

Fig. 9.6
In vivo mapping of the border between primary motor (area 4) and somatosensory (area 3a) cortex. Quantitative T1 map of the central sulcus region (coronal view in a, insets show fundus regions at higher magnification (x 1.5), latero-dorsal view of the inflated surface in b). Arrows in a and dashed line in b show a sharp drop in T1 values at the base of the precentral gyrus (PrG). Position and MR parameters of this border in vivo match the corresponding border between area 3a and 4 ex vivo (cf. Figs. 9.4 and 9.5). CS, central sulcus; PoG, postcentral gyrus; SF, Sylvian fissure (Panel a reproduced from Geyer et al. 2011)
9.4 Concluding Remarks
As already outlined in the introduction, differences in cytoarchitecture are detectable with MRI only in rare instances, but myelin is very easy to pick out. The main challenge is to find MR parameters that correlate well with the cortical myelin content. Among several candidates, e.g., myelin water fraction, magnetization transfer rate, transverse relaxation times T2 and T2*, the longitudinal relaxation time T1 seems to be a very promising candidate. Myelin and its biochemical components, e.g., cholesterol and galactocerebroside, substantially accelerate T1 relaxation by magnetization transfer from slowly relaxing free water protons to rapidly relaxing protons bound to large molecules in the cell membranes. Specifically designed MR sequences such as MP2RAGE (Marques et al. 2010) sample the MP RAGE (magnetization-prepared rapid gradient-echo; Mugler and Brookeman 1990) signal at two different inversion times and thus allow to map the longitudinal relaxation time T1 with reasonable precision. This is, in a nutshell, the MR basis for our myelin density-based mapping approach. Many more details on this topic can be found in the chapter “MRI Methods for In-Vivo Cortical Parcellation” by Robert Turner in this book.
Stay updated, free articles. Join our Telegram channel

Full access? Get Clinical Tree


