(1)
(2)
Data Analysis
Data are presented as the mean ± standard error of the mean (SEM). Data was analyzed using one-way analysis of variance (ANOVA) with Tukey post hoc tests for the effects of blood glucose on brain swelling and infarct volume. Blood glucose data was analyzed using one-way repeated measures ANOVA with Tukey post hoc test (Table 1). A p < 0.05 was considered statistically significant.
Table 1
Blood glucose for animals given dextrose
Sham | MCAO | |
|---|---|---|
15 min pre-MCAO | 73.3 ± 3.8 | 81.1 ± 2.1 |
1 min pre-MCAO | 239.3 ± 43.9a | 198.5 ± 20.1a |
5 min post-MCAO | 278.1 ± 44.2a | 213.1 ± 19.7a |
24 h post-MCAO | 71.2 ± 5.9 | 67.4 ± 4.5 |
Results
Baseline blood glucose levels for animals in the hyperglycemic groups were 73.3 ± 3.8 mg/dL and 81.1 ± 2.1 mg/dL for the hyperglycemic sham and hyperglycemic MCAO groups, respectively. Acute hyperglycemia was achieved before surgery began (1 min pre-MCAO, Sham: 239.3 ± 43.9 mg/dL, MCAO: 198.5 ± 20.1 mg/dL) and remained elevated at the beginning of reperfusion (5 min post-MCAO, Sham: 278.1 ± 44.2 mg/dL, MCAO: 213.1 ± 19.7 mg/dL) (p < 0.05 for 1 min pre-MCAO vs 15 min pre-MCAO for both sham and MCAO groups, p < 0.05 for 5 min post-MCAO vs 15 min pre-MCAO for both sham and MCAO groups, and p > 0.05 for 1 min pre-MCAO vs 5 min post-MCAO for both sham and MCAO groups). At the time of sacrifice, the blood glucose had returned to baseline levels (24 h post-MCAO, Sham: 71.2 ± 5.9 mg/dL, MCAO: 67.4 ± 4.5 mg/dL) (p < 0.05 for both sham and MCAO groups vs 1 min pre-MCAO and 5 min-post MCAO, and p > 0.05 for both sham and MCAO groups vs 15 min pre-MCAO) (Table 1).
Hemispheric Brain Swelling
The sham groups, normo-glycemic and hyperglycemic, did not have any hemispheric brain swelling (Normo-glycemic Sham: 0.6 ± 1.74 %, n = 9; Hyperglycemic Sham: −2.6 ± 1.24 %, n = 10). However, both normo-glycemic and hyperglycemic animals subjected to MCAO presented with hemispheric brain swelling (Normo-glycemic MCAO: 7.2 ± 1.60 %, n = 21; Hyperglycemic MCAO: 12.4 ± 1.54 %, n = 14) (Fig. 1).
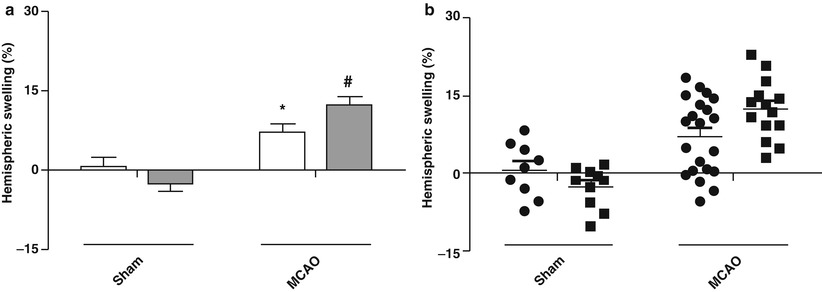
Fig. 1
Hemispheric brain swelling 24 h after MCAO. Hemispheric brain swelling (%) for normo-glycemic (white bars, circles) and hyperglycemic (gray bars, squares) animals. Swelling of the ipsilateral hemisphere is significantly higher in both normo-glycemic and hyperglycemic animals after MCAO compared with their respective shams (p < 0.001). *p < 0.001 vs Normo-glycemic Sham, # p < 0.001 vs Hyperglycemic Sham. n = 9–21/group. (a) Bar Graphs. (b) Scatter Plots
Regardless of blood glucose, the hemispheric swelling for sham animals was not statistically different from each other (p > 0.05 for Normo-glycemic Sham vs Hyperglycemic Sham). Interestingly, animals subjected to MCAO had indistinguishable hemispheric swelling for normo-glycemic and hyperglycemic animals (p > 0.05 for Normo-glycemic MCAO vs Hyperglycemic MCAO) (Fig. 1).
Although no significance was observed for the hemispheric swelling with respect to blood glucose levels for either injury group, the hemispheric swelling between animals subjected to MCAO and sham surgery is significantly different for both the normo-glycemic (p < 0.001 for Normo-glycemic MCAO vs Normo-glycemic MCAO) and hyperglycemic animals (p < 0.001 for Hyperglycemic MCAO vs Hyperglycemic Sham) (Fig. 1).
Infarct Volume
Normo-glycemic and hyperglycemic sham animals had essentially no infarcts (Normo-glycemic Sham: −0.4 ± 0.89 %, n = 9; Hyperglycemic Sham: 1.5 ± 0.65 %, n = 10). MCAO caused normo-glycemic and hyperglycemic animals to have large infarcts (Normo-glycemic MCAO: 14.6 ± 1.66 %, n = 21; Hyperglycemic MCAO: 14.7 ± 2.03 %, n = 14) (Fig. 2).
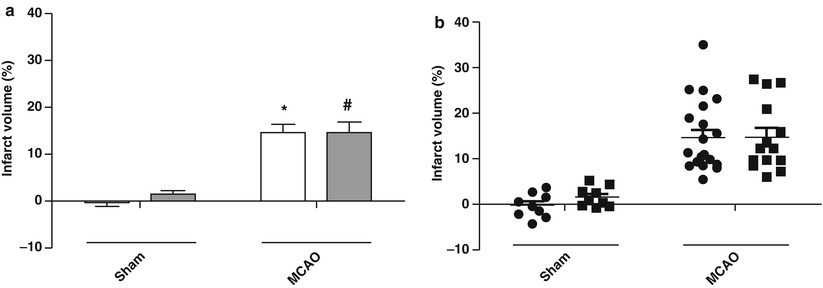
Fig. 2
Infarct volume 24 h after MCAO. Infarct volume (%) for normo-glycemic (white bars, circles) and hyperglycemic (gray bars, squares) animals. Infarct volume is significantly higher in both normo-glycemic and hyperglycemic animals after MCAO compared with their respective shams. *p < 0.001 vs Normo-glycemic Sham, # p < 0.001 vs Hyperglycemic Sham. n = 9–21/group. (a) Bar Graphs. (b) Scatter Plots
The infarct volumes for normo-glycemic and hyperglycemic sham animals were not significantly different from each other (p > 0.05 for Normo-glycemic Sham vs Hyperglycemic Sham). Similarly, the infarct volumes of MCAO animals were not statistically different for either the normo-glycemic or hyperglycemic cases (p > 0.05 for Normo-glycemic MCAO vs Hyperglycemic MCAO) (Fig. 2).
The infarct volumes between the sham and MCAO animals were significantly different for both the normoglycemic (p < 0.001 for Normo-glycemic MCAO vs Normo-glycemic MCAO) and hyperglycemic cases (p < 0.001 for Hyperglycemic MCAO vs Hyperglycemic Sham) (Fig. 2).
Related posts:
 of Behavioral Deficits in Rodents Following Brain Injury Across Species, Gender, and Experimental Model
 Infarction After Aneurysmal Subarachnoid Hemorrhage
 Volume Determination in Subarachnoid Hemorrhage Using Rats
 Endothelial Growth Factor in Brain Edema Formation After Subarachnoid Hemorrhage
 in Brain Swelling and Infarction Volume over Four Days After Hypoxia Ischemia in Neonatal Rats
 of Gender on Iron-induced Brain Injury in Low Aerobic Capacity Rats
Stay updated, free articles. Join our Telegram channel

Full access? Get Clinical Tree


