Swelling of the ipsilateral hemisphere was computed using the area of the contralateral and ipsilateral, I i , slices with
All measures are presented as the mean ± SEM. Data were analyzed using one-way analysis of variance (ANOVA) with Tukey post hoc tests for the infarct volume, swelling volume, and hemoglobin volume. Blood glucose data were analyzed using one-way repeated measures ANOVA with Tukey post hoc test. A p < 0.05 was considered statistically significant.
Results
Blood glucose of sham and MCAO animals at the beginning of MCAO surgery (1 min pre-MCAO, sham: 242.3 ± 46.4 mg/dl, MCAO: 194.0 ± 22.5 mg/dl) and immediately after reperfusion (5 min post-MCAO, sham: 285.0 ± 46.9 mg/dl, MCAO: 209.3 ± 17.9 mg/dl) were significantly higher than that of sham and MCAO animals 15 min pre-MCAO (15 min pre-MCAO, sham: 75.8 ± 4.3 mg/dl, MCAO: 81.8 ± 2.2 mg/dl) and 24 h post-MCAO (24 h post-MCAO, sham: 75.5 ± 3.3 mg/dl, MCAO: 67.5 ± 3.3 mg/dl) (sham: p < 0.05 vs 15 min pre-MCAO and p < 0.05 vs 24 h post-MCAO for the both the 1 min pre-MCAO and 5 min post-MCAO groups; MCAO: p < 0.05 vs 15 min pre-MCAO and p < 0.05 vs 24 h post-MCAO for the both the 1 min pre-MCAO and 5 min post-MCAO groups) (Table 1).
Table 1
Blood glucose measurements
Sham | MCAO | |
|---|---|---|
15 min pre-MCAO | 75.8 ± 4.3 | 81.8 ± 2.2 |
1 min pre-MCAO | 242.3 ± 46.4* | 194.0 ± 22.5* |
5 min post-MCAO | 285.0 ± 46.9* | 209.3 ± 17.9* |
24 h post-MCAO | 75.5 ± 3.3 | 67.5 ± 3.3 |
Progression of Infarct Volume
Within 15 min post-MCAO, the infarct volume (15 min post-reperfusion, 14.9 ± 2.59 %) was significantly higher than sham animals (0.3 ± 0.30 %; p < 0.05), and reached its maximum. No difference in infarct volume was observed between any of the groups after 15 min (p > 0.05 for all group comparisons between 15 min, 1, 3, and 24 h post-reperfusion) and all were significantly higher than sham animals (p < 0.05 vs sham for all groups). The infarct volumes were 10.75 ± 0.79 %, 11.8 ± 3.53 %, and 13.1 ± 1.81 % for the 1, 3, and 24 h post-reperfusion, respectively (Fig. 1).
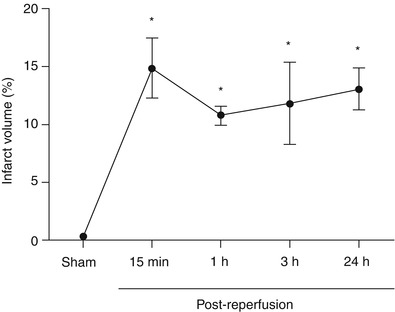
Fig. 1
Development of infarct volume after MCAO. Infarct volume (%) time course after MCAO. * p < 0.05 vs sham. n = 5/group
Progression of Ipsilateral Hemisphere Swelling
Swelling of the ipsilateral hemisphere was elevated at 15 min (4.3 ± 1.34 %) and 1 h post-reperfusion (6.2 ± 1.50 %) but not significantly different from sham (−0.7 ± 0.66 %) (p > 0.05 vs sham for the 15 min and 1 h post-reperfusion groups). By 3 h after reperfusion, ipsilateral hemisphere swelling reached statistically significant values (9.7 ± 1.91 %; p > 0.05) and continued to increase to the 24 h time point (14.5 ± 2.69 %; p < 0.05 vs sham for 3 and 24 h post-reperfusion groups). At 24 h, the ipsilateral swelling was also significantly higher than the 15 min and 1 h post-reperfusion time points (p < 0.05 vs 15 min and 1 h post-reperfusion) (Fig. 2a).
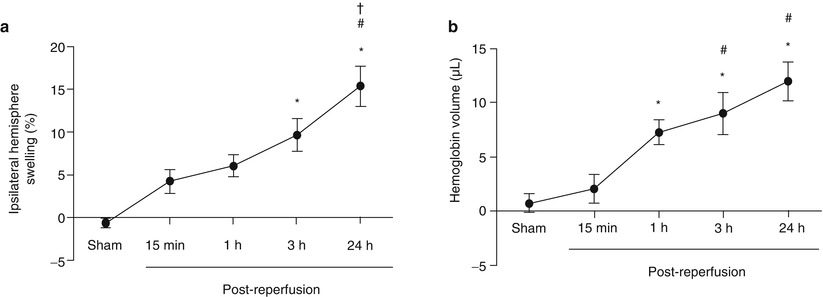
Fig. 2
Development of brain swelling and hemorrhagic transformation after MCAO. (a) Ipsilateral hemispheric swelling (%) time course after MCAO. *p < 0.05 vs sham. #p < 0.05 vs 15 min. †p < 0.05 vs 1 h. n = 5/group. (b) Hemoglobin volume (μL) describes hemorrhagic transformation after MCAO. *p < 0.05 vs sham. #p < 0.05 vs 15 min. n = 5/group, † p < 0.05 vs 1 h. n = 5/group
Development of Hemorrhagic Transformation
The amount of hemoglobin in the brain tissue was not significantly elevated 15 min after reperfusion (15 min post-reperfusion, 2.0 ± 1.33 μl) compared with sham (0.4 ± 1.03 μl) (p > 0.05). However, 1 h post-reperfusion, the hemoglobin volume (1 h post-reperfusion, 7.7 ± 1.31 μl) was significantly higher than sham and continued to rise to the 3 (9.0 ± 1.90 μl) and 24 h (12.3 ± 2.15 μl) time points (p < 0.05 vs sham for the 1, 3, and 24 h post-reperfusion groups). Additionally, the hemoglobin volume at 3 and 24 h after reperfusion was significantly higher than the 15 min time point (p < 0.05 vs 15 min post-reperfusion for the 3 h, and 24 h post-reperfusion groups) (Fig. 2b).
Discussion
Hemorrhagic transformation occurs in a large number of ischemic stroke patients and contributes to the morbidity and mortality after stroke [11]. Several risk factors have been identified for causing hemorrhagic transformation, including tPA [19], hyperglycemia [9], and hypertension [9]. Clinically, treatment of hemorrhagic transformation relies primarily on surgical interventions, which may be ineffective [18]. Furthermore, pharmacologic interventions of hemorrhagic transformation are almost non-existent [1, 15, 18]. Thus it is critically important to develop novel therapeutics which can prevent the occurrence of, as well as treat, hemorrhagic transformation.
Related posts:
 of Behavioral Deficits in Rodents Following Brain Injury Across Species, Gender, and Experimental Model
 Infarction After Aneurysmal Subarachnoid Hemorrhage
 Volume Determination in Subarachnoid Hemorrhage Using Rats
 Endothelial Growth Factor in Brain Edema Formation After Subarachnoid Hemorrhage
 in Brain Swelling and Infarction Volume over Four Days After Hypoxia Ischemia in Neonatal Rats
 of Gender on Iron-induced Brain Injury in Low Aerobic Capacity Rats
Stay updated, free articles. Join our Telegram channel

Full access? Get Clinical Tree


