Chapter 6 The possible combinations of pathophysiological features are many, and the following snapshots show some of the patterns that can be seen (Figs. 6.1 to 6.19) and provide unique insights into disease. FIGURE 6.1 Classic hypoxic obstructive sleep apnea. FIGURE 6.2 Response to therapy for sleep apnea. FIGURE 6.3 Split night polysomnogram. FIGURE 6.4 Congenital myotonic dystrophy. FIGURE 6.5 Spontaneous switches between stable and unstable non–rapid eye movement sleep.
Hypnogram Analysis
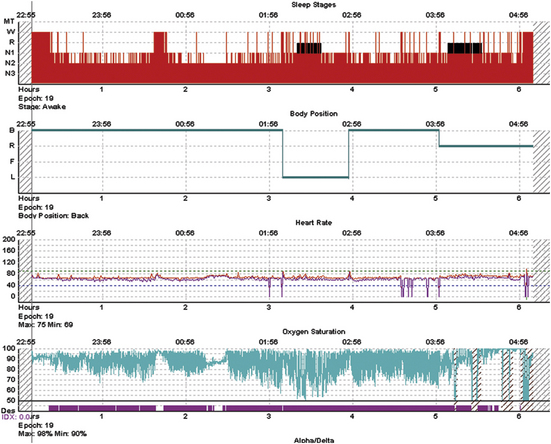
A 52-year-old obese man with a body mass index of 45 kg/m2 presents with snoring, daytime sleepiness, and witnessed apneas. The diagnostic polysomnogram shows relatively well-preserved overall sleep macroarchitecture even though stage and state transitions are frequent, and there is severe oxygen desaturation that seems worse during the first rapid eye movement period. The return of saturation to baseline is caused by vigorous arousals. There is one brief period of stable sleep just after 1 AM, in which the oximetry does not show fluctuations.
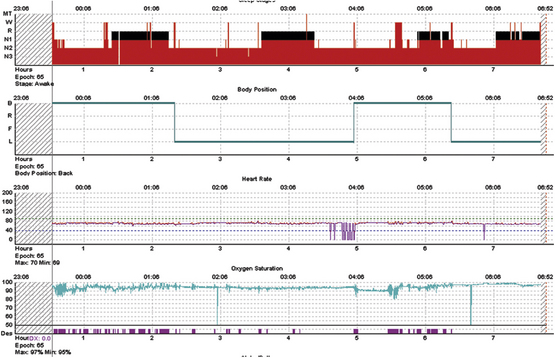
The same subject as in Figure 7.1, during positive pressure therapy. Optimal pressures were obtained quickly and resulted in nearly normalized oxygenation, elimination of stage and state transitions, but no slow wave sleep. The latter may reflect limitations of conventional amplitude-based sleep stage scoring; it may also be speculated that such severe sleep apnea could cause cortical injury and an inability to generate large-amplitude slow waves acutely. On the other hand, slow wave sleep rebound is considered a feature of successful titration but is absent here. Note that the duration of rapid eye movement (REM) sleep shows the inverse of the norm—longer periods earlier, which is one manifestation of REM sleep rebound.
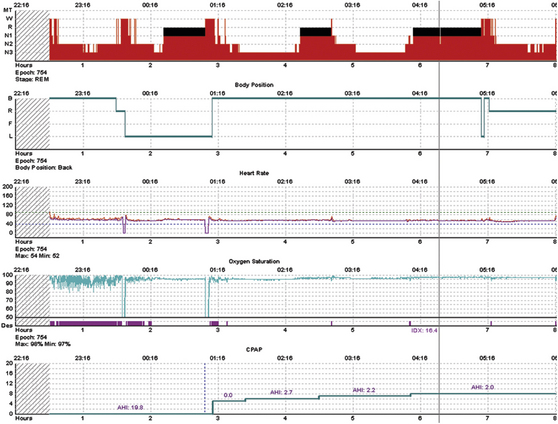
A 42-year-old woman presents with typical sleep apnea symptoms. Here, there is a relatively straightforward response to positive pressure therapy, with a major slow wave sleep and possibly some rapid eye movement sleep rebound.
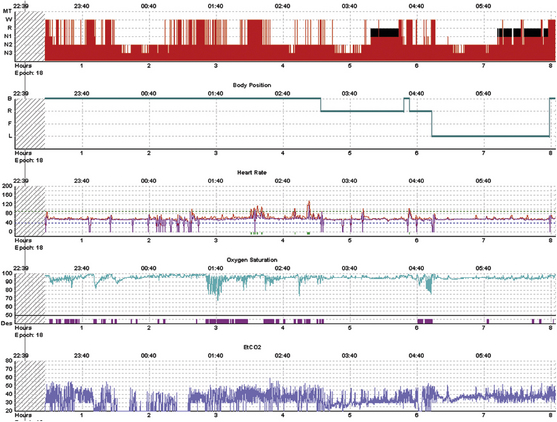
A 40-year-old man with nocturnal respiratory failure and central sleep apnea from congenital myotonic dystrophy. This is a positive pressure titration with bilevel ventilation and a backup rate. The majority of breaths are ventilator supported. The bottom trace is end-tidal CO2 measures using a nonvented mask; variable leak intermittently degrades the signal. Transcutaneous CO2 was also measured and remained between 48 and 56 mm Hg. Severe sleep fragmentation with greater consolidation during the second half of the night is consistent with moderate phase delay. The periods of severe desaturation were caused by inadvertent switch to continuous positive airway pressure while adjusting pressures in the Respironics PC Direct module. Supplemental oxygen was not used.
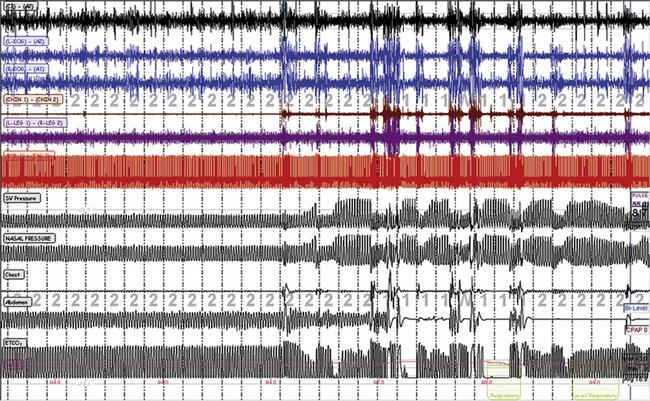
Periods of stability occur in stage N2 that are intrinsic to sleep and are recognized readily as periods of stable breathing even in those with severe sleep apnea. This is a titration with ResMed adaptive servo ventilation (ResMed Adapt SV). The left half of the figure shows a period of stability and stage N2; the right half shows repetitive arousals, respiratory events, and periodic breathing. The SV pressure channel is the pressure output from the ventilator, the nasal pressure is mask pressure, the chest effort and then the abdominal effort belts have fallen off, and the end-tidal CO2 (ETCO2) is being measured using a nonvented oronasal mask. The “cycling” of ventilator pressure is a typical response of this specific ventilator to detected periodic breathing.
Related posts:
 1: Narcolepsy—Unequivocal Diagnosis After Split-Screen, Video-Polysomnographic Analysis of a Prolonged Cataplectic Attack
 4: Isolated Sleep Paralysis: An REM-“Sleep” Polysomnographic Phenomenon as Documented With Simultaneous Clinical and Electrophysiological Assessment
 Motor Disorders During Sleep
 Oral Appliances and Surgical Techniques for Obstructive Sleep Apnea Syndrome Therapy
 Specialized Techniques


