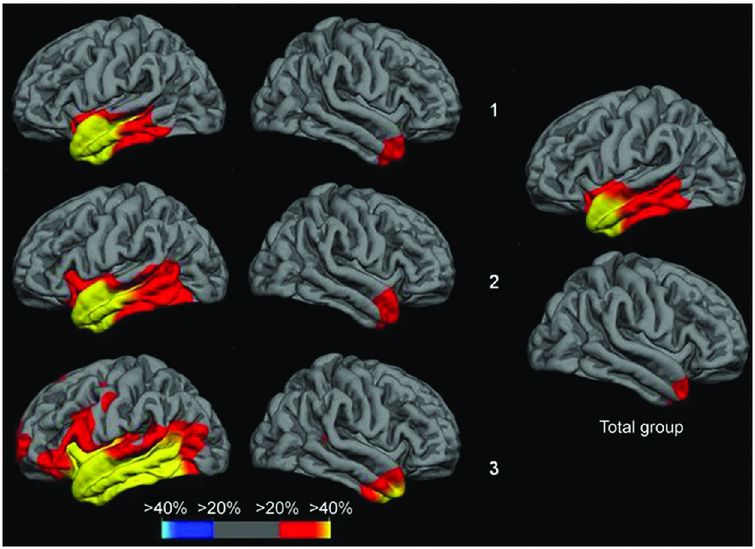
Regional brain atrophy across three clinical stages of behavioral variant FTD. In the group with very mild dementia (CDR 0.5), atrophy involved areas in the frontal lobe (rostromedial frontal, frontal pole, dorsolateral frontal, and orbitofrontal) as well as anterior cingulate, anterior insula, hippocampus, and subcortical areas (ventral striatum and dorsomedial thalamus). The right hemisphere was more prominently involved than the left. In the group with mild dementia (CDR 1), atrophy became more extensive in the same areas, particularly within the frontal lobe, with spread to more posterior areas including posterior insula, temporal, and anterior parietal lobes. In moderate to severe FTD dementia (CDR 2–3), atrophy continued to extend beyond the areas originally involved.
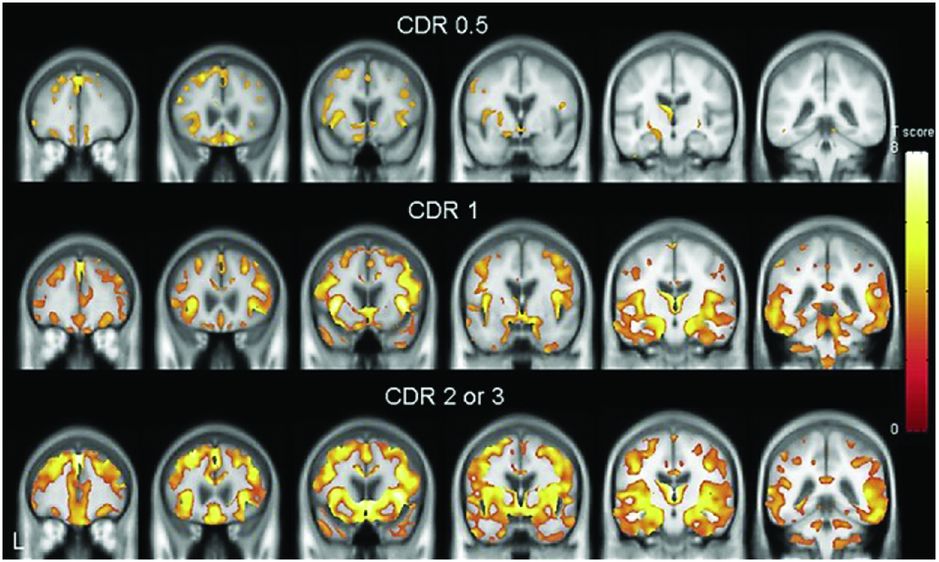
A study of pathologically confirmed bvFTD patients separated by CDR found very similar results to those in Figure 10.1. Further studies have suggested that these areas affected in early disease (frontal-insula-anterior cingulate) are part of a structurally and functionally connected neural network that is particularly vulnerable in bvFTD and that has a histopathologic correlate in the form of selectively vulnerable von Economo neurons.
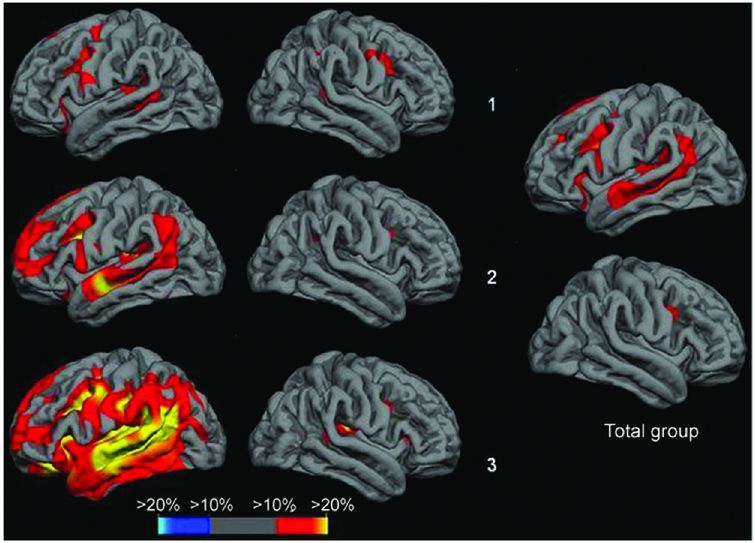
However, bvFTD is pathologically heterogeneous and it is unclear whether this same network is affected in all groups independent of the underlying pathology. One study performed a cluster analysis which suggested that bvFTD can be divided into four separate neuroanatomical groups: frontal dominant, temporal dominant, frontotemporal and temporofrontoparietal (Figure 10.3) [9]. In a subgroup of patients in this study who had come to post-mortem there were no clear correlations between imaging features and pathologic subtype apart from the temporal-dominant group who all had mutations in the MAPT gene. Further work needs to be done to see whether these four groups map on to separate brain networks (or subsystems within the same network).
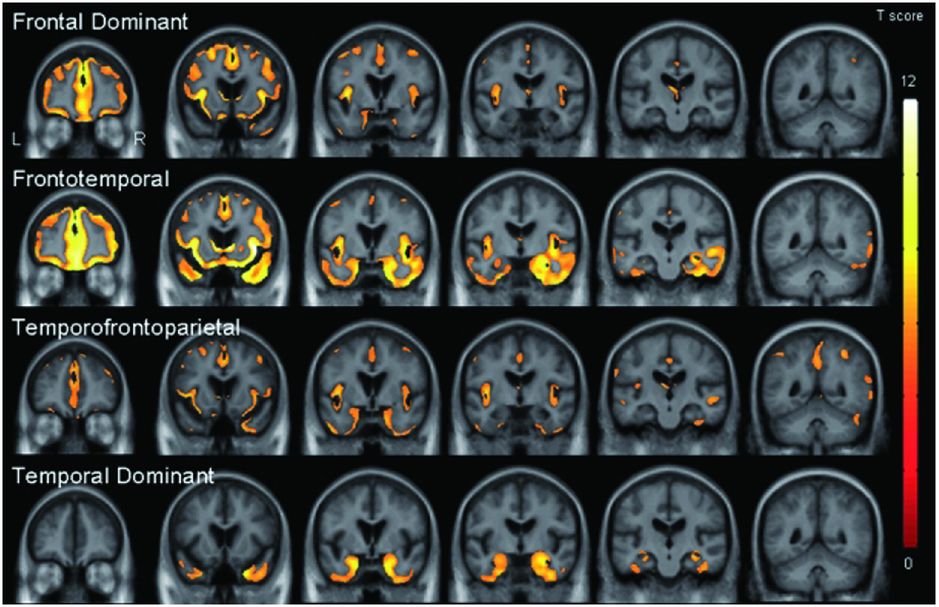
One study performed a cluster analysis which suggested that bvFTD can be divided into four separate neuroanatomical groups: frontal dominant, temporal dominant, frontotemporal and temporofrontoparietal. In a subgroup of patients in this study who had come to post-mortem there were no clear correlations between imaging features and pathological subtype apart from the temporal-dominant group who all had mutations in the MAPT gene. Further work needs to be done to see whether these four groups map on to separate brain networks (or subsystems within the same network).
Longitudinal T1 MRI studies of bvFTD have been performed less frequently but such studies show an elevated rate of whole-brain atrophy [10, 11].
Other MR sequences have been investigated to a lesser extent in bvFTD but there are now an increasing number of studies using DTI, rsfMRI, and ASL perfusion MRI.
DTI allows characterization of abnormalities in the structure of white matter fiber tracts in the brain. Diffusion of water is anisotropic (directionally dependent) in these tracts because axons and myelin sheaths act as barriers. Fractional anisotropy (FA) is a measure of the degree of anisotropy of a diffusion process and ranges from zero, when diffusion is isotropic (i.e., unrestricted in all directions), to one, when diffusion occurs only along one axis and is fully restricted in the other directions. FA can therefore provide information on the orientation and integrity of white matter fibers. It is also possible to measure the diffusivity, essentially the rate of diffusion, either as an overall mean within the fibers or in particular directions.
In bvFTD, studies have shown alterations in FA and diffusivity bilaterally in the majority of the frontal white matter tracts including the anterior superior longitudinal fasciculus (SLF), anterior cingulum, and the genu of the corpus callosum, as well as the temporal white matter tracts including the uncinate fasciculus (UF), inferior longitudinal fasciculus (ILF), and inferior fronto-occipital fasciculus (IFOF) [12–14]. Some studies do show changes (albeit to a lesser extent) more posteriorly such as in the posterior cingulate and posterior parts of the SLF, particularly as the disease becomes more severe [15].
rsfMRI examines synchronization of intrinsic fluctuations in blood-oxygen-level-dependent signals arising from neuronal and synaptic activity that is observed independent of overt cognitive information processing. rsfMRI has been used to elucidate a variety of coherent large-scale functional brain networks, the best described being the default mode network, a set of regions that routinely decrease their activity during attention-demanding tasks. In bvFTD the networks of most interest have been a salience network centered around the ventral frontal cortex, insula, and dorsal anterior cingulate; an executive control network linking dorsolateral frontal and parietal cortices; and also language and semantic networks in the left hemisphere (although these latter networks have been investigated more in primary progressive aphasia [PPA]) [8].
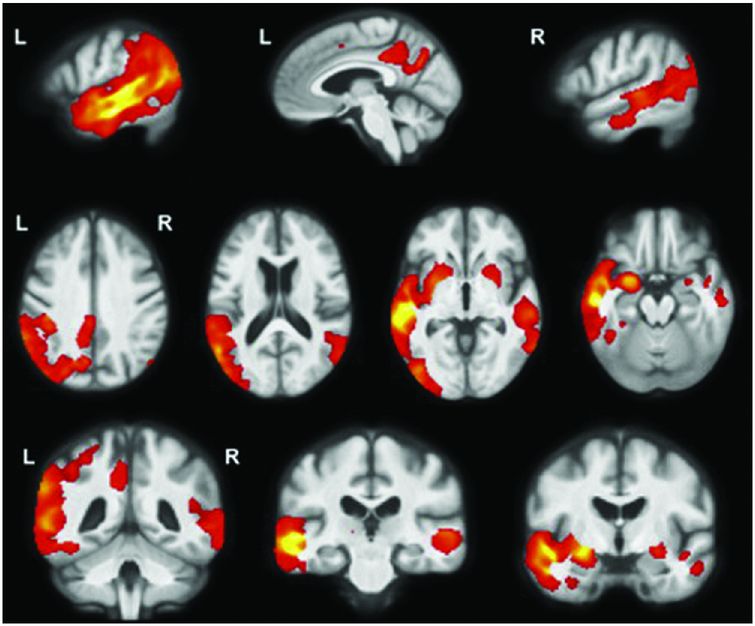
An early rsfMRI study showed that bvFTD is associated with reduced connectivity in the salience network but with increased connectivity in the default mode network (with the opposite pattern being found in Alzheimer’s disease [AD]) (Figure 10.4) [16]. This reduced connectivity in the salience network has been replicated in further studies of bvFTD but other results from these studies are conflicting. One study showed similarly increased connectivity in the default mode network [17] whilst others have shown reduced connectivity in the default mode network [18, 19]. It remains unclear why there are such divergent findings in rsfMRI studies in bvFTD, although this may represent differences in the disease stage at which subjects were studied, in the types of underlying pathology represented in the groups, or in the methods used for analysis.
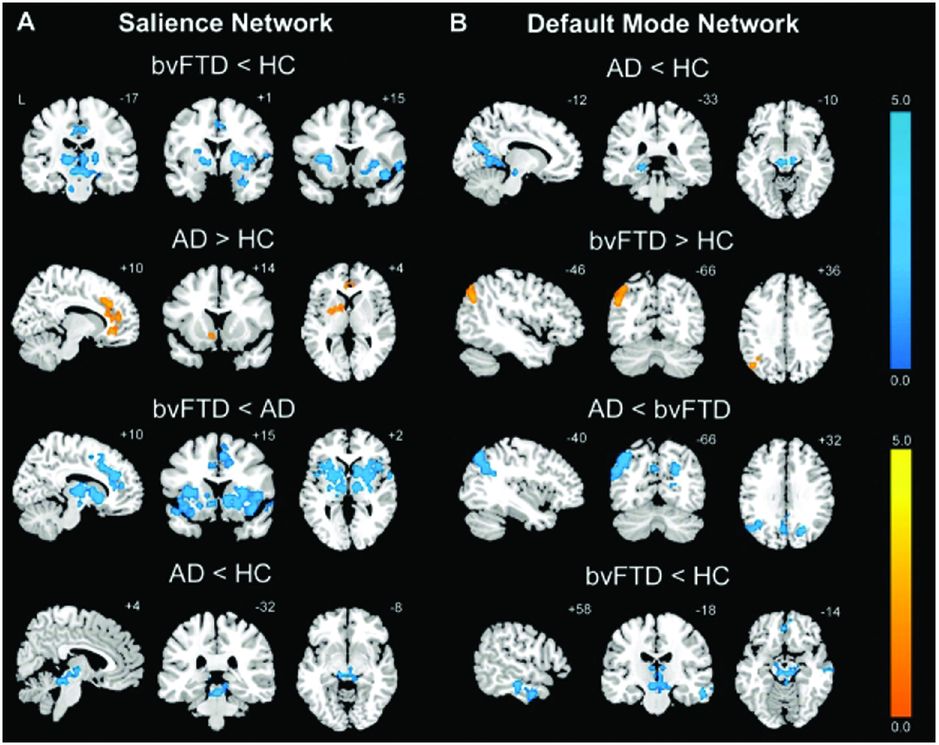
An early rsfMRI study showed that bvFTD is associated with reduced connectivity in the salience network (A) but with increased connectivity in the default mode network (B) (with the opposite pattern being found in Alzheimer’s disease).
ASL MRI is a method for assessing brain perfusion (blood flow). Studies in bvFTD have shown hypoperfusion in bilateral frontal regions as well as the anterior cingulate and thalamus compared with controls [20]. A further study looking at a group of patients with FTD that included PPA as well as bvFTD found hypoperfusion compared with controls in dorsolateral prefrontal cortex bilaterally and right inferior fronto-insular areas, with areas of hyperperfusion in medial parietal cortex, precuneus, and posterior cingulate [21].
Brain perfusion has more commonly been assessed using SPECT and PET by measuring the uptake of a variety of compounds that are labeled with radioactive isotopes. The most commonly studied SPECT method uses 99mTc-hexamethyl propyleneamine oxime (HMPAO), which crosses the blood–brain barrier and is taken up in proportion to blood flow allowing the tracking of cerebral perfusion. The PET compound most commonly used in FTD is [18F]-fluorodeoxyglucose (FDG), which crosses the blood–brain barrier and is taken up by metabolically active cells thus providing a measure of brain activity.
Both HMPAO-SPECT and FDG-PET have shown a pattern of anterior hypometabolism in the frontal and anterior temporal regions in bvFTD, which similarly to structural T1 imaging may be asymmetric, and may involve subcortical regions [3, 22–25]. A study comparing FTD and AD patients whose diagnoses were ultimately confirmed at autopsy showed that FDG-PET increases diagnostic accuracy beyond clinical features alone [24], with a further study suggesting that FDG-PET combined with structural MRI improves diagnostic accuracy compared with each modality alone [26]. The utility of FDG-PET in diagnosing FTD led to this technique being the first imaging technique approved by the US Medicare health insurance program for diagnosis of FTD (versus AD). Unfortunately, this insurance program is only available to people over 65, and it is often still difficult to obtain insurance reimbursement for FDG-PET in the USA for younger people with private insurance. Similar diagnostic benefits to FDG-PET have been shown for HMPAO-SPECT [23, 25]. There are fewer longitudinal studies of SPECT or PET imaging in bvFTD but one study showed further hypometabolism more posteriorly in the temporal and parietal cortices with disease progression [27].
Newer PET-based imaging techniques have also been used in FTD, particularly those that use ligands that bind to amyloid such as Pittsburgh compound B (PiB). PiB has been demonstrated to differentiate FTD from AD [28], although only small numbers of pathologically verified FTD patients have been studied so far. Of further interest will be ligands that bind to tau protein [29], which are currently under investigation in FTD (see Chapter 8, Figure 8.4), and those ligands that identify neuroinflammation and microglial activation, processes proposed to be involved in the pathophysiology of FTD [30].
Some patients who present with behavioral symptoms perform normally on neuropsychological tests and do not have abnormalities on structural brain imaging or FDG-PET imaging [31]. These have been termed “bvFTD phenocopies” and do not appear to worsen over time. The majority of these cases remain unexplained but may well not have a neurodegenerative etiology, although some cases have recently been described as having expansions in the C9orf72 gene.
Frontotemporal dementia with motor neuron disease/amyotrophic lateral sclerosis (FTD-MND/ALS)
As described in detail in Chapter 6, FTD-MND/ALS can present initially with either an FTD syndrome (usually bvFTD, less commonly non-fluent variant of PPA [nfvPPA], and very rarely semantic variant of PPA [svPPA]) or with an MND/ALS syndrome. Early neuroimaging studies of patients with FTD-MND/ALS showed relatively symmetrical frontal and temporal lobe involvement. In a study comparing FTD-MND/ALS with bvFTD without MND/ALS, similar patterns were seen in both groups involving not only the frontal and temporal lobes but also subcortical structures including the thalamus and striatum (Figure 10.5) [32]. However, there was less atrophy in the superior frontal lobe and paracingulate gyrus in FTD-MND/ALS compared with bvFTD, with no areas of more atrophy. DTI in this same study showed a similar pattern of involvement of the frontal and temporal white matter tracts in FTD-MND/ALS as in bvFTD but with greater corticospinal tract degeneration (in a pattern similar, although to a lesser extent, to patients with ALS alone). The recognition that many cases of FTD-MND/ALS have expansions in the C9orf72 gene has allowed better stratification of cases. However, whilst there are now imaging studies comparing pure ALS with and without C9orf72 expansions, there are no current studies in those with FTD-ALS. Imaging of C9orf72 expansions are discussed further in the Genetic syndromes section below.
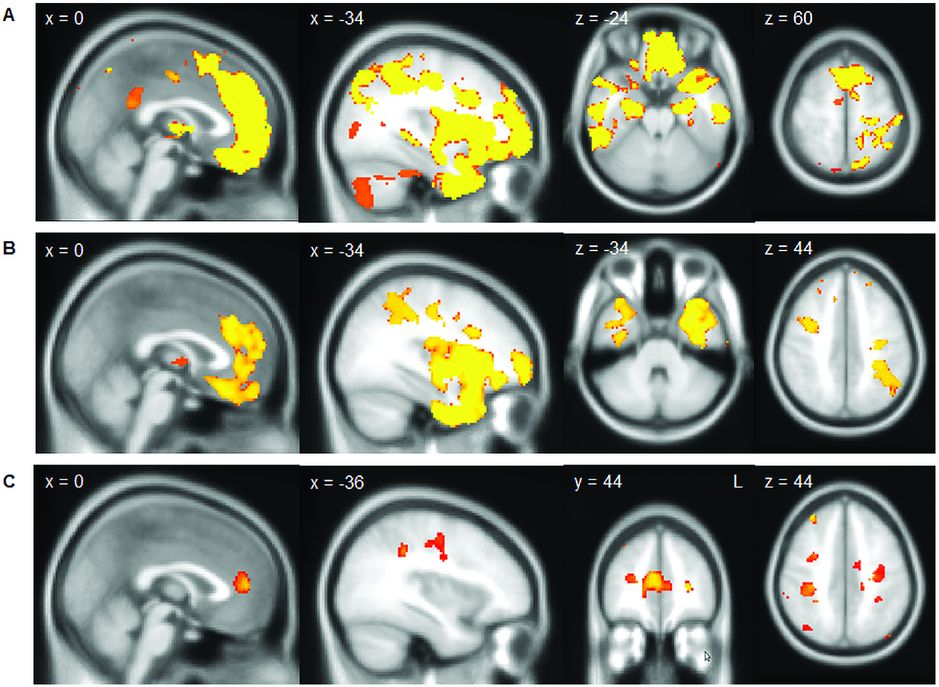
In a study comparing FTD-MND/ALS with bvFTD (A, showing areas of greater atrophy in bvFTD than in FTD-MND/ALS) and bvFTD with ALS (B, showing areas of greater atrophy in bvFTD than in ALS without cognitive or behavioral symptoms) similar patterns were seen in both groups involving not only the frontal and temporal lobes but also subcortical structures including the thalamus and striatum. However, there was less atrophy in the superior frontal lobe and paracingulate gyrus and in the anterior temporal lobe in ALS than in FTD-MND/ALS (C).
Primary progressive aphasia (PPA)
Semantic variant PPA (svPPA)
svPPA is the most comprehensively studied of the PPA subtypes in terms of cross-sectional patterns of atrophy seen using T1 MRI. Initial VBM studies of clinically diagnosed svPPA identified an asymmetric pattern of atrophy affecting mainly the anterior, inferior, and lateral temporal lobes, more so in the left hemisphere. The findings of these studies were extended by detailed ROI studies of temporal lobe structures, which showed that the temporal pole, fusiform gyrus, entorhinal cortex, inferior temporal gyrus, as well as the amygdala and hippocampus were the most affected areas with relative sparing of the superior temporal gyrus; there was also the presence of an anteroposterior gradient with relative sparing of posterior cortical areas [33]. Further VBM studies showed that there may be involvement of areas outside the temporal lobes in svPPA, particularly orbitofrontal, insular, and anterior cingulate cortices. This asymmetric temporal, frontal, and anterior cingulate pattern distinguishes svPPA from AD, which has more symmetrical hippocampal atrophy involvement without an anteroposterior gradient and greater posterior cingulate and parietal lobe atrophy. Other subcortical regions have also been shown to be involved in svPPA – in a study of caudate, putamen, and nucleus accumbens atrophy, unlike bvFTD which had panstriatal degeneration, svPPA had more focal involvement of the putamen and nucleus accumbens only [34]. A small VBM study of pathologically confirmed patients found that patterns of atrophy were similar in semantic dementia cases associated with both ubiquitin-positive and tau-positive frontotemporal lobar degeneration (FTLD) pathology but, in the rare cases with Alzheimer’s pathology, there was mainly left hippocampal atrophy [35].
The majority of svPPA cases described in the literature have asymmetric left-greater-than-right temporal lobe atrophy, but there are a number of reports of the opposite pattern with right-greater-than-left temporal lobe atrophy. This right temporal variant appears to be less common than the left temporal variant, although this may simply represent an ascertainment bias. Of note, these are different from the rare left-handed/right hemisphere-dominant individuals with svPPA. Patients often have initial behavioral symptoms rather than a progressive aphasia, with the development of semantic impairment only later in the illness (leading some authors to argue that this right temporal variant should be logically separated from the PPAs). In subjects that develop semantic impairment the pattern of atrophy seems to be the mirror image of subjects with left temporal-predominant svPPA and they have the same pathology (i.e., TDP-C) [36]. However, it has been suggested that there is a second right temporal FTD variant that does not develop semantic impairment but has predominantly a bvFTD phenotype – one study showed greater frontal lobe involvement in this group compared with the right temporal svPPA group (with greater fusiform atrophy in the svPPA group) [37].
Longitudinal studies in svPPA are less common. In those with the left temporal variant, there seems to be increased right temporal lobe involvement as the disease progresses, as well as spread of atrophy within the left hemisphere, particularly the more posterior temporal areas and the orbitofrontal, anterior insular, inferior frontal, and anterior cingulate lobes (Figure 10.6) [38]. In the right temporal variant, limited evidence suggests that a similar but mirror-image pattern of atrophy spread is seen. Rates of whole-brain atrophy in svPPA have been measured in some studies, and these are similar to those seen in other neurodegenerative diseases (1.7–2.5% per year). Rates of individual lobar change are greatest for the temporal lobes (followed by the frontal, parietal, then occipital lobes) [39].
Cross-sectional analysis of cortical thickness in svPPA suggests that there is increased right temporal lobe involvement with increasing severity of symptoms, as well as greater atrophy within the left hemisphere, particularly the more posterior temporal areas and the orbitofrontal, anterior insular, inferior frontal, and anterior cingulate lobes. Top row is the subgroup of svPPA patients with the mildest anomia, middle row shows the subgroup with moderate anomia, bottom row shows the subgroup with most severe anomia.
There are now a number of studies investigating the changes in white matter structure in svPPA using DTI [12, 40]. These have shown asymmetric alterations in diffusivity and FA in the ILF and UF with the left side more severely affected. Although some studies have shown relative sparing of the SLF, others that have examined separate parts of the SLF have reported abnormalities in subcomponents, particularly the arcuate fasciculus. Some studies have also shown abnormalities in other tracts including the left IFOF and genu of the corpus callosum.
Asymmetric temporal lobe hypometabolism has been found in PET and SPECT imaging in svPPA but there have been few detailed studies.
Non-fluent variant PPA (nfvPPA)
nfvPPA is less well studied than svPPA, and patterns of neuroanatomical involvement are not quite so clear. This is partly because of the heterogeneity of nfvPPA and also the differences in definition between research groups prior to the recent revision in diagnostic criteria (e.g., it is likely that patients with the logopenic variant PPA [lvPPA] have been included in earlier studies of nfvPPA). Similar to svPPA, atrophy or hypometabolism is usually asymmetric and worse in the left hemisphere. The most significantly affected areas are in the left inferior frontal lobe (particularly the frontal opercular region) and anterior insula [38, 41]. However, left middle and superior frontal, superior temporal, and caudate involvement are also frequently reported in studies, with less frequent involvement of the anterior parietal lobes. ROI studies are limited in nfvPPA, but have shown involvement of striatal structures, particularly the caudate. There are few pathologically confirmed studies of nfvPPA, and these have often studied mixed pathologic groups but, despite this, have shown fairly consistent findings compared with the clinical studies, e.g., anterior insula and inferior frontal involvement in mixed groups of tau-positive patients [38].
There are few longitudinal studies of nfvPPA, although it seems that, with disease progression, there is spread from the left inferior frontal and insular cortex to involve the superior temporal, middle and superior frontal, and anterior parietal lobes (Figure 10.7) [38]. More posterior atrophy, particularly of the left anterior parietal lobe, may herald the presence of an accompanying corticobasal syndrome (CBS). Rate of whole-brain atrophy is similar to svPPA (1.6% per year) whilst rates of individual lobar change are greatest for the frontal lobes (followed by the temporal/parietal then occipital lobes) [39].
Cross-sectional analysis of cortical thickness in nfvPPA suggests that there is increased left inferior frontal and insular involvement with increasing severity of symptoms, as well as greater atrophy in superior temporal, middle and superior frontal, and anterior parietal lobes. Top row is the subgroup of nfvPPA patients with the mildest anomia, middle row shows the subgroup with moderate anomia, bottom row shows the subgroup with most severe anomia.
In contrast to the semantic variant, DTI studies of nfvPPA have shown alterations of diffusivity and FA mostly in the dorsal language pathways, i.e., the subcomponents of the left SLF, particularly the arcuate fasciculus [40]. In patients with predominantly apraxia of speech rather than agrammatism the premotor components of the SLF appear to be affected more than other regions [42]. Other tracts that have shown abnormalities to a lesser extent include the IFOF and UF as well as the fornix and corpus callosum, more so on the left than the right.
Logopenic variant PPA (lvPPA)
lvPPA is the least studied of the three subtypes, with an asymmetric, left-sided predominant pattern of atrophy and hypometabolism affecting the posterior superior temporal and inferior parietal lobes as well as posterior cingulate, precuneus, and middle/inferior temporal lobes (Figure 10.8) [41, 43]. A longitudinal study of T1 MRI in lvPPA showed a whole-brain atrophy rate of 2.0% per year with a greater rate of left hemisphere atrophy (2.3% per year) than right hemisphere (1.6% per year) [44]. Longitudinal VBM analysis in this study showed spread of atrophy through the left hemisphere (including medial temporal and frontal lobes as well as caudate) and atrophy of areas in the right hemisphere that had been involved earlier in the disease in the left hemisphere, particularly posterior cingulate/precuneus.
lvPPA is the least studied of the three subtypes with an asymmetric, left-sided predominant pattern of atrophy and hypometabolism affecting the posterior superior temporal and inferior parietal lobes as well as posterior cingulate, precuneus, and middle/inferior temporal lobes [41, 43].
DTI studies of lvPPA have shown asymmetric, left-sided predominant involvement of tracts including SLF, ILF, and UF [45].
Most studies have found that a majority of cases with lvPPA have underlying AD pathology and hence amyloid imaging with PiB is commonly positive in a majority of patients in this group.
Other forms of PPA
GRN mutations have been associated with a non-fluent aphasia, although often with a more prominent anomia than other forms of nfvPPA. There are limited studies of the imaging of GRN-PPA although these have shown asymmetric left-greater-than-right hemisphere atrophy (which may occur presymptomatically) affecting the frontal, temporal, and (to a lesser extent) parietal lobes. There appears to be more posterior atrophy than usually occurs in nfvPPA (and more anterior temporal lobe atrophy than occurs in lvPPA) [46].
Comparison of bvFTD and the PPA syndromes
Few studies have compared the different FTD clinical syndromes. One study using volumetric imaging and defined ROIs compared bvFTD, svPPA, and nfvPPA [47]: each of the syndromes could be discriminated from each other with relatively high sensitivity and specificity: bvFTD versus svPPA (sensitivity 100%, specificity 100%), bvFTD versus nfvPPA (sensitivity 92%, specificity 89%), and svPPA versus nfvPPA (sensitivity 86%, specificity 100%). svPPA and nfvPPA have also been compared with lvPPA, using an automated structural MRI-based classification method (support vector machines) [48]. As with the first study, discrimination of svPPA from other syndromes had a high specificity (although lower sensitivity) whilst discrimination between the non-svPPA syndromes was not as accurate: svPPA versus nfvPPA (sensitivity 84%, specificity 94%), nfvPPA versus lvPPA (sensitivity 81%, specificity 91%), and svPPA versus lvPPA (sensitivity 94%, specificity 94%).
Genetic syndromes
Studies of genetic FTD have shown different patterns of atrophy associated with the different genes. MAPT mutations are associated with relatively symmetrical anterior temporal lobe atrophy with lesser involvement of the orbitofrontal cortices [49, 50]. One small study has shown that there may be differences between patients with MAPT mutations that affect splicing (which have more medial temporal lobe involvement) and mutations that affect the structure of the tau protein (which have more lateral temporal lobe involvement). In contrast GRN mutations are associated with strongly asymmetric atrophy affecting either the left or right hemispheres maximally and involving the temporal, inferior frontal, and inferior parietal lobes (Figure 10.9) [49, 50]. More recently there have been a number of studies of patients with expansions in the C9orf72 gene. These have shown relatively symmetrical involvement of the frontal and temporal lobes but also with more posterior cortical involvement, and in contrast to other causes of genetic FTD have shown involvement of the thalamus and cerebellum [50, 51].
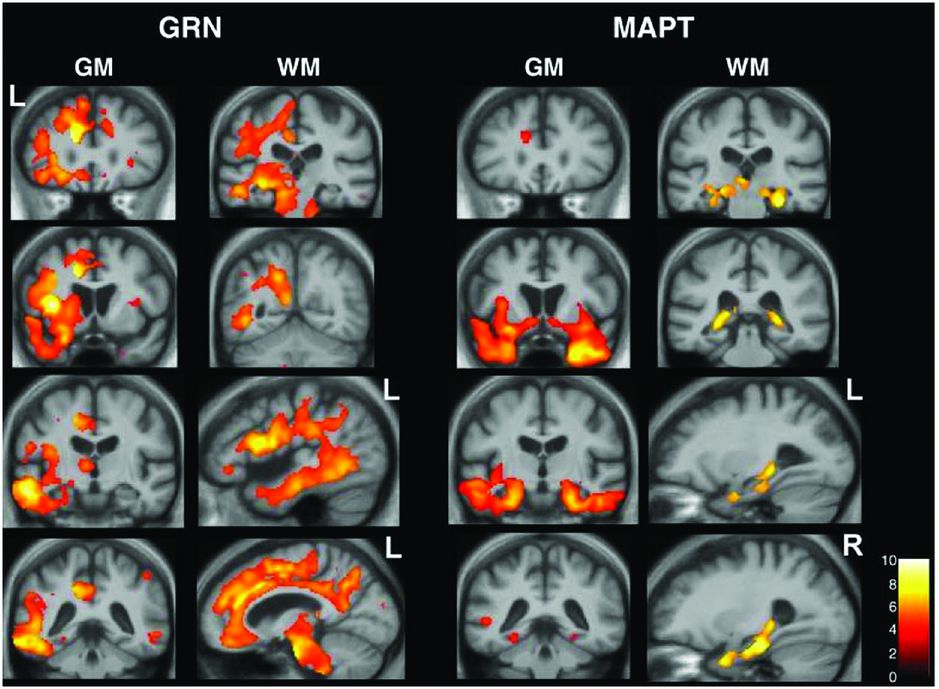
Studies of genetic FTD have shown different patterns of atrophy associated with the different genes. MAPT mutations are associated with relatively symmetrical anterior temporal lobe atrophy with lesser involvement of the orbitofrontal cortices [49, 50]. One small study has shown that there may be differences between patients with MAPT mutations that affect splicing (which have more medial temporal lobe involvement) and mutations that affect the structure of the tau protein (which have more lateral temporal lobe involvement). In contrast GRN mutations are associated with strongly asymmetric atrophy affecting either the left or right hemispheres maximally and involving the temporal, inferior frontal, and inferior parietal lobes [49, 50].
There are few longitudinal studies of genetic FTD but whole-brain rates of atrophy appear to be greatest for GRN (3.4–3.5% per year) compared with MAPT (1.4–2.4% per year) and C9orf72 mutations (1.4% per year) [50–53].
Studying genetic syndromes offers the opportunity to identify the very earliest imaging features in FTD by investigating presymptomatic patients who are “at risk” of developing FTD. A number of studies have examined presymptomatic genetic FTD although the majority of these have been either individual case reports or relatively small case series so far.
Prior to the manifestation of neuropsychometric abnormalities and several years before disease onset, a number of structural T1 MRI studies have now shown evidence of gray matter atrophy. One study examined a patient with familial FTLD-U (now known to be associated with a GRN mutation) and showed evidence of very focal left frontal lobe atrophy affecting the pars opercularis about two years prior to the onset of nfvPPA. Another single case report of a subject with a GRN mutation who later developed nfvPPA showed evidence of early left hemisphere atrophy, particularly in the frontal lobe but also in the middle and inferior temporal gyri and angular gyrus, at least 18 months prior to symptom onset. This was consistent with a study of four presymptomatic GRN mutation carriers from a nfvPPA family who had a similar pattern of atrophy and also hypometabolism on FDG-PET scanning [54]. MAPT mutations have been studied less frequently, although one study did show presymptomatic hippocampal atrophy [55].
Studies using other imaging modalities have identified presymptomatic changes that appear to occur earlier than gray matter atrophy. A small study of at-risk GRN mutation carriers (n = 4) showed no evidence of gray matter atrophy using voxel-based morphometric analysis, but analysis of white matter using DTI showed reduced FA in the left UF and IFOF compared with controls [56]. A larger DTI study of presymptomatic GRN mutation carriers (n = 27) also showed decreased FA in the IFOF (on the right) as well as involvement of the right anterior and superior corona radiata, anterior thalamic radiation, SLF, forceps minor, and internal capsule [57]. In comparison, presymptomatic MAPT mutation carriers (n = 9) showed widespread decreased FA (and also increased diffusivity) throughout frontotemporal white matter tracts.
This same study also examined changes in rsfMRI: no changes were seen in MAPT mutation carriers but there was reduced connectivity in the anterior midcingulate cortex (an area within the salience network) in GRN mutation carriers without any changes in the posterior cingulate cortex (an area within the default mode network) [57]. This is in contrast to another study of presymptomatic GRN mutation carriers which showed increased connectivity in a small area in the medial prefrontal cortex (which the authors attribute to the salience network) also without any changes in other networks. Another study of presymptomatic MAPT mutation carriers showed reduced connectivity in parts of the default mode network (lateral temporal and medial prefrontal cortices) with increased connectivity in other parts of the default mode network (medial parietal) and no changes in the salience network.
In summary, these studies suggest that there is a sequence of changes seen in different imaging biomarkers of genetic FTD prior to clinical onset of symptoms: the earliest of these markers are likely to be PET imaging with ligands binding to the important FTD proteins (of which tau PET imaging is now available), followed by markers of functional and structural connectivity, then gray matter atrophy, prior to the onset of mild neuropsychometric abnormalities in proximity to the first symptoms. A large cohort study involving multiple centers across Europe and Canada (GENFI, the Genetic FTD Initiative) is currently underway to investigate presymptomatic imaging changes in more detail.
Pathologic syndromes
Initial studies investigating imaging signatures of tau or transactive response DNA-binding protein 43 (TDP-43) pathology did not show a clear picture but with increasing knowledge of the different subtypes of FTD pathology, more recent studies have refined the associations. Two studies of the TDP-43 proteinopathies showed similar findings, with TDP-A pathology being associated with asymmetric fronto-temporo-parietal atrophy, TDP-B with more symmetrical atrophy affecting the frontal lobe but also the insula and anteromedial temporal lobe, and TDP-C showing asymmetric anteroinferior temporal lobe atrophy [36, 58].
Fused in sarcoma (FUS) pathology is relatively rare in FTD but a number of studies have now shown a pattern of atrophy affecting the orbitofrontal lobe, anterior cingulate, insula, anterior temporal lobe, and particularly severely, the caudate [59].
In the tauopathies, Pick’s disease is associated with asymmetric frontal lobe (particularly dorsolateral and orbitofrontal), insular, and anterior temporal lobe atrophy, whilst CBD is associated with less distributed atrophy affecting mostly frontal and to a lesser extent the parietal lobe in a slightly asymmetric pattern [60].
In pathologically defined FTD, there seem to be more widespread white matter changes seen in the tauopathies on DTI compared to more limited white matter tract involvement in the TDP-43 proteinopathies [61, 62].
Comparison of FTD with other neurodegenerative disorders
Clinically, FTD is usually clearly distinguishable from the typical amnestic AD presentation. However, there can be a gray area with some FTD patients having prominent impairment of episodic memory and some patients with AD having more atypical presentations, i.e., language variant AD (usually lvPPA), frontal variant AD (i.e., a syndrome with prominent behavioral symptoms and/or executive dysfunction), posterior cortical atrophy (which often presents with visuospatial and/or visuoperceptual impairment and is therefore sometimes called the “visual variant”), and a CBS presentation of AD. In reviewing imaging studies comparing FTD and AD it is therefore important to understand the groups being studied, i.e., whether they are clinical or pathologic phenotypes.
Studies comparing FTD with a typical AD clinical syndrome have shown differences using VBM of structural MRI (atrophy in posterior parietal and occipital cortex in AD compared to atrophy in frontal insula-cingulate and striatum in FTD), cortical thickness (greater parietal and precuneus thinning in AD), amyloid PET imaging (positive in AD), ASL (hypoperfusion in parietal regions and posterior cingulate in AD compared to hypoperfusion in the frontal lobes in FTD), DTI (reduced FA in frontal brain regions in FTD), and as described above, both HMPAO-SPECT and FDG-PET. Automated methods of classification using support vector machines have shown the ability to accurately differentiate AD and FTD with relatively high sensitivity and specificity.
Studies investigating more atypical phenotypes of AD have suggested that, independent of clinical phenotype, patients with underlying AD pathology have involvement of posterior cingulate, precuneus, posterior parietal, and medial temporal areas. Comparison of PPA patients with and without AD pathology suggests that differentiating factors between these two groups include greater left temporo-parietal atrophy in those with AD pathology (usually an lvPPA syndrome clinically) and the presence of knife-edge anterior temporal lobe atrophy in those with FTD pathology.
Less commonly, FTD can be mistaken for dementia with Lewy bodies (DLB) – this may well be because some patients with FTD clinical syndromes can develop delusions and/or visual hallucinations. One small study suggested that MRI was not helpful in differentiating FTD from DLB. Furthermore, 123I-FP-CIT SPECT scans (DaTscans) can be abnormal in FTD (in a third of patients in one recent small study). However a further study has shown accurate differentiation using 123I-MIBG scintigraphy in which uptake is markedly reduced in DLB but normal in FTD.
Brain–behavior correlation
Imaging studies in FTD have not only looked at patterns of MRI, SPECT, and PET changes relative to disease state but also in relation to the underlying symptomatology.
Behavioral variant FTD
Patients with bvFTD tend to have one or more behavioral symptoms which in the recent diagnostic criteria have been grouped into five domains: apathy and loss of motivation, disinhibition and socially inappropriate behavior, loss of empathy or sympathy for others, change in eating behavior including the development of a sweet tooth, and repetitive or obsessive–compulsive behavior. Apathy has been associated with atrophy in a variety of areas including the prefrontal cortex, temporal lobe, caudate, anterior cingulate, and insula [63, 64], whilst disinhibition has been associated with the orbitofrontal cortex as well as the anterior temporal lobe [64, 65]. A DTI study of disinhibition showed association with UF, forceps minor, and genu of the corpus callosum [65]. Empathy has also been associated with prefrontal and anterior temporal lobe atrophy [66]. Abnormal eating behavior was found to be associated with orbitofrontal cortex and right insular atrophy [67, 68] although a recent study has looked at the involvement of the hypothalamus [69]. Lastly, obsessive–compulsive behavior has been associated with atrophy bilaterally in the globus pallidus as well as the left putamen and lateral temporal lobe [70]. Patients often do not have insight into their behavioral deficits, and one study has shown an association between the degree of anosognosia and atrophy in the right superior temporal lobe [71].
Cognitively, patients with bvFTD tend to have executive dysfunction and impaired social cognition most prominently but may develop impairment in other cognitive domains including episodic memory. Executive dysfunction and social cognition have both been associated with atrophy of the prefrontal cortex although a task of sarcasm detection was associated with atrophy in the orbitofrontal cortex, insula, amygdala, and temporal pole, particularly on the right [72]. A recent study has shown distinct anatomical correlates of episodic memory between patients with bvFTD and AD with ventromedial and dorsolateral prefrontal cortex contributions in bvFTD but only dorsolateral prefrontal cortex involvement in AD.
Primary progressive aphasia
Patients with PPA have a wide variety of speech and language deficits that differ between the subtypes: anomia and impaired single-word comprehension secondary to a verbal semantic deficit in svPPA; agrammatism, motor speech impairment, anomia, and impaired repetition in nfvPPA; and anomia and impaired sentence repetition and comprehension secondary to a phonologic memory deficit in lvPPA. Consistent with this, both structural and functional MRI studies have shown involvement of a distributed left hemisphere fronto-temporo-parietal language network in PPA. During the early stages of the disease, all of the disorders have naming deficits with anomia worse in svPPA than lvPPA and only a mild impairment in nfvPPA. VBM studies suggest that overlapping but distinct areas of the language network correlate with anomia: in svPPA, anomia is mostly associated with anterior temporal lobe atrophy, whereas in nfvPPA, a more widespread network of areas is associated with anomia, particularly the inferior frontal, lateral temporal, and anterior parietal lobes. More recently, DTI studies have looked at the white matter tract correlates of naming and have again found distinct findings between the subtypes, e.g., an association with left UF and corpus callosum in svPPA and left superior and inferior longitudinal fasciculi in lvPPA [73].
There are few studies of spontaneous speech in PPA, and those performed have looked mainly at nfvPPA: apraxia of speech has been associated with premotor and supplementary motor areas as well as the insula and basal ganglia, whereas early mutism in nfvPPA has been associated with left pars opercularis and basal ganglia atrophy. In a study looking at the three variants, motor speech and syntax deficits were associated with frontal lobe atrophy whilst lexical retrieval was associated with inferior temporal lobe atrophy and the presence of phonologic errors was associated with posterior temporal lobe atrophy [74]. Sentence comprehension is impaired in both nfvPPA (for complex sentences) and lvPPA (for simple and complex sentences) with one small fMRI study of nfvPPA showing decreased activation in the left ventral inferior frontal lobe areas known to be associated with grammatical processing. Reading deficits differ between the subtypes: surface dyslexia is seen in svPPA (i.e., inability to read irregular or exception words) and, in an fMRI study, a group of svPPA patients (unlike cognitively normal control subjects) did not activate anterior temporal lobe areas thought to be required for exception word reading, but instead activated a left inferior parietal area not seen in normal individuals (which may explain the regularization of exception words that svPPA patients commonly exhibit). Phonologic dyslexia is seen in nfvPPA and lvPPA, i.e., particular difficulty reading nonsense or pseudowords, and is associated in PPA with left temporo-parietal atrophy.
Non-linguistic deficits are also seen in PPA as the disease progresses. Executive dysfunction is seen in nfvPPA, and patients have been included in correlative studies linking such deficits with prefrontal atrophy. Prosopagnosia develops in svPPA with greater right temporal lobe involvement, while emotional processing deficits are also associated with right hemisphere atrophy, namely in the amygdala and orbitofrontal cortex. Behavioral deficits in PPA are associated with orbitofrontal lobe atrophy as well as right dorsolateral prefrontal cortex (apathy) and left anterior temporal lobe (disinhibition) [75].
Related posts:

Stay updated, free articles. Join our Telegram channel

Full access? Get Clinical Tree


