Fig. 1
Protocol of second-order conditioning using light, tone and foot-shock
On day 1, pairing of tone (8 kHz, 5 s) and foot-shock (0.7 mA, 0.5 s) was repeated five times. On day 2, pre-test for light was carried out; then, pairing of light (white LED, 10 s) and tone (8 kHz, 5 s) was repeated five times. The conditioned response to light was tested on day 3. In order to measure the conditioned response, the cardiac pulse (blood flow) was recorded by using an ear sensor. Next, the cortical activities in naïve and conditioned animals were recorded by using optical imaging with a voltage sensitive dye, RH795. Responses from the left cortical areas, including auditory, visual, and somatosensory cortices, were recorded in three conditions: (1) presentation of a pure-tone (duration: 50 ms, frequency: 4–16 kHz, acoustic pressure: 65 dB SPL) to the right ear; (2) presentation of a light stimulus (duration 5 ms, white LED) to the right eye; and (3) application of an electric shock (duration: 0.2 s, current intensity: 0.5–1.5 mA) to the hind legs.
3 Results
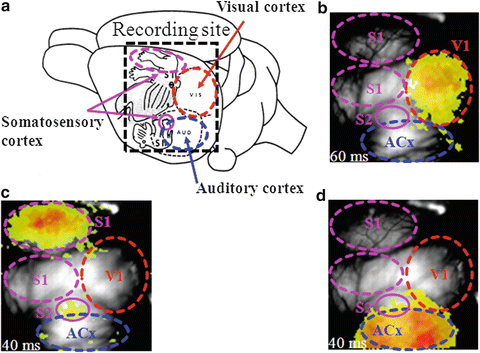
Second-order conditioning using light, tone and foot-shock was carried out. On day 1, blood flow was monitored during the tone-shock conditioning; as a result, the conditioned response was observed in the third to fifth trial. On day 2, pairing of light and tone was repeated five times. Blood flow change to the light stimulus was monitored in the pre-test (day-2) and test (day-3); as a result, the conditioned response to light was observed after the light-tone conditioning, proving second-order conditioning to be successful. Next, neural activities in the auditory, visual, and somatosensory cortices were recorded by optical imaging. In order to identify the location of these three cortical areas, cortical activities in the recording sites to light, foot-shock, and tone stimuli were investigated. Figure 2a shows a schematic diagram of cortical areas including visual, somatosensory and auditory cortices as reported by Woolsey and Van der Loos [4]. Figure 2b shows cortical activity to a light stimulus, suggesting that the activated area is primary visual cortex.


Fig. 2


(a) A schematic diagram of cortical areas including visual, somatosensory and auditory cortices. The areas surrounded by red and blue dashed lines are visual (V1) and auditory (ACx) cortices, respectively. The areas surrounded by pink dashed and solid lines are primary (S1) and secondary (S2) somatosensory cortices corresponding to the hind legs, respectively. (b) Neuronal activity in V1 to light stimulus. (c) Neuronal activity in S1 and S2 to foot-shock to hind legs. (d) Neuronal activity in ACx to tone stimulus
Stay updated, free articles. Join our Telegram channel

Full access? Get Clinical Tree


