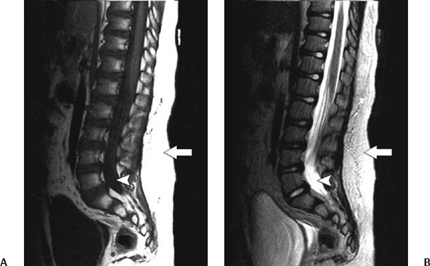
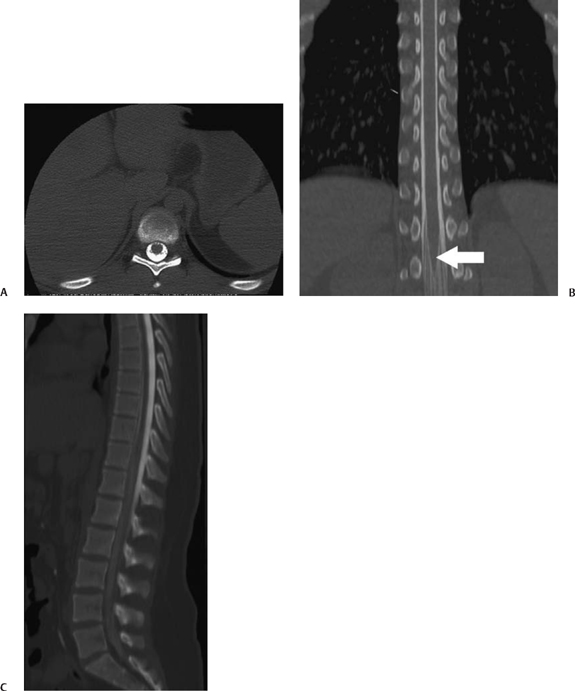
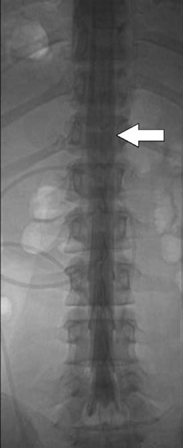
5 Imaging of Tethered Spinal Cord David B. Hinshaw Jr., J. Paul Jacobson, Jason Hwang, and Daniel K. Kido Visualization of the spine with x-ray imaging was first accomplished in the early 1900s, soon after the discovery of x-radiation by W. Roentgen. This technique improved rapidly and today allows visualization of bony lesions associated with dysraphism such as abnormal curvature of the spine (lordosis, kyphosis, scoliosis, or combinations thereof), widened interpedicular distance, posterior neural arch defects, hemivertebrae, and related segmentation anomalies. Ventral rounding of the vertebral bodies (associated with having myelomeningocele in children under 6 months of age)1 and spinal canal bony spurs in patients with diastematomyelia may also be seen. The intraspinal soft tissues, however, are not well evaluated with this technique.2 Historically, myelography was the next development in evaluating the spine with x-rays. Various contrast agents were introduced into the subarachnoid space, changing the x-ray density of the cerebrospinal fluid (CSF) and thus outlining the neural elements. Currently, the popular intrathecal contrast agents are nonionic, have low osmolality, and have much higher safety profiles than those previously associated with myelography. With modern water-soluble intrathecal contrast agents, the conus, cord, nerve roots, and associated tumors are visualized as negative filling defects. In the 1970s, x-ray computed tomographic (CT) scans provided improved contrast resolution of soft tissues by calculating axial images based on the various electron densities of the soft tissues, thus allowing muscle, fat, water, and blood to be distinguished from each other. For instance, intraspinal lipomas are readily distinguished from CSF on CT scans. However, because the thecal sac is surrounded by dense bone, visualization of nerve roots of the conus medullaris may be suboptimal due to Hounsfield artifact. Intrathecal contrast material is often used in combination with CT to evaluate the nerve roots, filum terminale, and conus medullaris with greater accuracy. In the mid- and late 1980s, magnetic resonance imaging (MRI) developed to a degree that allowed visualization of the spinal anatomy without the use of x-radiation or subarachnoid injection of contrast agents. It has emerged as the most useful noninvasive modality, providing excellent detail of anatomy and characterization of soft tissue anomalies. The advantages of MRI also include its ability to obtain direct sagittal, coronal, oblique, and three-dimensional (3-D) images. MRI has become the primary imaging modality for tethered cords and has both facilitated earlier diagnosis and tailored treatment of these disorders.3,4 Using MRI, radiofrequency (RF)-excited protons in the spine can be analyzed by a computer to produce images of the spinal cord and the nerve roots. With this technique, much better contrast between intrathecal soft tissues and CSF is available when compared with CT without intrathecal contrast. However, the patient must remain still for a much longer period of time than for CT while the images are being acquired. Although the physical principles of MRI are beyond the scope of this chapter, numerous books and articles on the subject provide excellent discussions of these principles.5–7 However, explanations of some MRI principles may be useful. Images may be weighted toward longitudinal (T1) relaxation, proton density, or transverse (T2) relaxation. In the T1-weighted images, signal from fat appears bright, CSF dark, and spinal cord, nerves, and muscle intermediate (Fig. 5.1A). With proton density-weighting, fat loses relative signal whereas CSF and spinal cord gain relative signal. With T2-weighting, fat loses even more relative signal, becoming dark, and CSF gains more relative signal, becoming bright; the cord (becomes hypointense) relative to CSF (Fig. 5.1B). Cortical bone has few mobile protons and is dark on all sequences. In older children and adults, vertebral marrow is relatively fatty and therefore brighter on T1-weighted sequences. Sagittal MRI shows the CSF and neural structures, although the conus is not always precisely identified because the nerve roots of the cauda equina tend to layer posteriorly due to gravity and may appear relatively continuous with the conus (Fig. 5.1B). Coronal views may provide additional information, although transverse images much more accurately identify the conus termination when correlated with sagittal views. Electrical stimulation of the conus at surgery is probably still the most definitive test of conus position when cord tethering produces an elongated conus tip.8 Fig. 5.1 Normal sagittal magnetic resonance images of the spine. (A) T1-weighted image. Cerebrospinal fluid (CSF) is low signal (arrowhead). Fat is high signal (arrow).(B) Turbo T2-weighted image. CSF has gained signal (arrowhead). Fat continues to have high signal because of averaging (arrow). The fat can be suppressed to appear like conventional T2-weighted images as in Fig. 5.6B, D. For CT of the spine, as is done for MRI, the patient is placed supine on a couch and moved into a gantry where an x-ray source and receptors rotate around the patient. The radiation passing through the patient is measured, and calculations are performed by a computer to form axial images of the soft tissues (Fig. 5.2A). In addition, if these scans are obtained with thin continuous slices, reconstructions can be performed in other directions (Fig. 5.2B, C). With the introduction of multichannel, spiral CT scanners, the patient needs to be in the scanner for only 1 to 2 minutes. During the time of the scan, the patient must not move. Following myelography, a short delay prior to CT is often indicated to allow for distribution and dilution of the intrathecal contrast material throughout the subarachnoid space. Fig. 5.2 Normal postmyelographic computed tomographic (CT) scan. (A) The axial CT scan demonstrates the conus, which is surrounded by opacified cerebrospinal fluid (CSF) and a few nerve roots. (B) Reconstructed coronal scan from the axial scans demonstrates the conus (arrow).(C) Reconstructed sagittal scan demonstrates the difficulty of locating the conus without additional projections. Myelography is an invasive radiographic spine examination technique. A spinal needle is placed into the subarachnoid space under fluoroscopic guidance. A water-soluble nonionic iodinated contrast agent is injected, then the needle is withdrawn and radiographs are obtained with the patient in appropriate positions (Fig. 5.3). In patients suspected of having a tethered cord, supine radiographs are often helpful because the filum tends to be stretched along the posterior aspect of the canal. Myelograms are almost always followed by CT scans (Fig. 5.2). Fig. 5.3 Normal water-soluble contrast-enhanced myelogram. An anteroposterior projection taken with the patient supine shows the conus (arrow). A detailed discussion of the technique of ultrasound examinations is presented in Chapter 6, Ultrasound Evaluation of Tethered Cord Syndrome. During in utero life, the bony spine grows faster than the spinal cord, thus the spinal cord effectively “ascends” in the spinal canal. The ascension occurs rapidly between 8 and 25 weeks of gestation, with the conus generally being located opposite L2 at birth.9 It reaches the adult level at age 2 months postnatally.10,11 There is evidence that the conus does not ascend further during childhood12 and that the conus terminates near the L1–2 disk space in the majority of normal individuals. Conus termination may normally vary from the mid-T12 to the mid-L3 level, although 94 to 97.8% terminate above the L2–3 disk.13,14 Thus, although some consider a conus terminus below L1–2 to be abnormal, it is probably prudent to consider a conus termination at L2–3 or above as normal at any age. A conus level terminating at or below L3–4 is abnormal (except possibly in premature infants and full-term newborns), and the significance of an L3 conus level must be determined by means other than its position. There is some controversy as to how thick the filum may be and still be “normal.” Some have said that filum thickening occurs by definition when it is wider than 2 mm,15 whereas others claim that a filum diameter greater than 1 mm is abnormal.16 A fatty filum can be an incidental finding and is not considered diagnostic of tethered cord17 because it is reportedly present in 5.8%of the normal population on postmortem examination.18 The fat appears as low attenuation (dark) on CT and bright (or white) on T1-weighted MRI sequences. Occult defects in the posterior elements have been extensively studied, and the reported incidence in the general population has varied from 1.2 to 50%.19,20 In patients with cord tethering, there is a high incidence of spina bifida occulta according to Hendrick et al,21 who reported 100% incidence in a series of 86 patients. However, in another series, a tight filum with relief of neurological symptoms following division of the filum was found in only six of 442 cases of spina bifida occulta.22 Therefore, even though patients with occult spinal dysraphism may have associated lesions such as congenital dermal sinus, lipomyelomeningocele, fibrous traction bands, and abnormal filum terminale,23 additional studies to evaluate for tethered cord are not generally recommended unless they have neurological deficits. In fact, classic neurological deficits suggestive of a tethered cord indicate the need for modern imaging examination regardless of whether spina bifida occulta is present on plain films. Cord tethering is often assumed when the conus is below the normal L2–3 level.24 MRI is able to demonstrate the level of conus termination with reasonable certainty in the great majority of cases (Fig. 5.4). Some patients with tethered cord syndrome show a normally positioned conus that is also normally shaped at myelography, CT myelography, or MRI.25–27 In such cases, it might be appropriate to obtain additional prone and supine images to determine whether the cord shows normal movement (Fig. 5.5). The spinal cord normally exhibits anteroposterior and craniocaudal movement when the patient has changed from the supine to the prone position, whereas the tethered spinal cord exhibits decreased or no movement.28 Certain open MRI scanners, depending on the configuration of the magnet, allow patients to stand upright while images are taken. Images taken during flexion and extension can help determine whether there is normal craniocaudal movement.
History of Spinal Imaging
Techniques
Magnetic Resonance Imaging
Computed Tomography
Myelography
Ultrasound
Anatomy and Imaging Findings
Normal Anatomy
Position of the Normal Cord
Filum Terminale
Vertebral Column
Cord Tethering Associated with Spinal Bifida Occulta
Low Cord Termination
Related posts:
 Introduction to Tethered Cord Syndrome
The Cervical Tethered Spinal Cord
Introduction to Tethered Cord Syndrome
The Cervical Tethered Spinal Cord
 Urological Aspect of Tethered Cord Syndrome I: Lower Urinary Tract Dysfunction in Tethered Cord Syndrome
 Epidermoid and Dermoid Tumors Associated with Tethered Cord Syndrome
 Tethered Cord Syndrome Associated with Myelomeningoceles and Lipomyelomeningoceles
 Intraoperative Neurophysiological Monitoring of the Lower Sacral Nerve Roots and Spinal Cord
Stay updated, free articles. Join our Telegram channel

Full access? Get Clinical Tree


