Imaging of the Aging Brain


Imaging of the Aging Brain


Michael D. Hollander

Adam E. Flanders


Over the past several decades, dramatic advances have been made in imaging of the neuroaxis. Today, computed tomography (CT), magnetic resonance imaging (MRI), single photon emission computed tomography (SPECT), and positron emission tomography (PET) are the primary imaging techniques currently being used to evaluate the brain. CT and MRI allow for an easy, safe, noninvasive way to study the brain. CT is limited by single-plane imaging and poor visualization of the temporal lobe and posterior fossa structures from skull base artifacts and diminished contrast resolution compared with MRI. MRI, on the other hand, is a multiplanar technique; therefore, the temporal lobe can be evaluated in the coronal plane with little or no artifact from the skull base. SPECT and PET imaging allow for a physiologic evaluation of the brain and for physiologic comparison of different regions of the brain. These two techniques require the intravenous injection of a radiopharmaceutical and give less information about the morphologic appearance of the brain. Therefore, for the complete evaluation of the aging brain, most studies suggest using both an imaging study and a nuclear medicine study to allow for a morphologic and functional assessment of the brain.

Various imaging pitfalls must be recognized when assessing the brain of the elderly, whether healthy or diseased (23). From the third decade of life to the beginning of the tenth decade, the weight of the average male brain declines from 1,394 to 1,161 g, a loss of 233 g, presumably caused by degeneration of neurons and replacement gliosis (4,18). This change is slow initially but accelerates with advancing age and is usually readily apparent by the seventh decade. Changes involve both the cerebrum and the cerebellum (59). The neuronal population in the neocortex is progressively depleted in the seventh, eighth, and ninth decades. The greatest loss appears to be among the small neurons of the second and fourth layers (external and internal granular laminae) in the frontal and superior temporal regions, approaching a 50% neuronal loss by the ninth decade. Neuronal loss and replacement gliosis, which represent the primary aging process, can occur in the absence of neurofibrillary changes associated with Alzheimer’s disease (AD) and senile plaques (4,18).


IMAGING FINDINGS ASSOCIATED WITH NORMAL AGING


VENTRICULAR ENLARGEMENT

As the median and paramedian parts of the brain regress with age, the third ventricle slowly begins to widen (59). Yakovlev studied the growth and maturation of the nervous system and noted the regression of the median nuclei of the thalamus and widening of the third ventricle beginning by the fifth decade (59). In addition, he observed a progressive decrease in the size of the massa intermedia (59). In a different study, Morel and Wildi measured the ventricular volume in cadaveric specimens ranging in age from 55 to 99 years and noted an increase in the size of the ventricles up to the ninth decade (59). The ventricles were larger in the men than in the women, and the left lateral ventricle was usually larger than the right (59). In addition to the ventricles becoming larger, Knudson found that the temporal lobes, particularly the hippocampus, uncus, and parahippocampal and fusiform gyri, and area around the insula involute with age (59). The relationship between size of the lateral ventricles and age is more variable than that of the third ventricle (59). In contrast, only mild enlargement of the temporal horns of the lateral ventricles is observed with aging, and the left temporal horn is usually slightly larger than the right.

Multiple brain CT studies have been performed to distinguish normal age-related ventricular changes from pathologic states. Various measurements and ratios have been employed to establish normal metrics, including the Evans, frontal horn, bicaudate, and third ventricle-Sylvian fissure methods (Table 3-1). These studies all found progressive enlargement of the ventricles and cortical sulci (Fig. 3-1) with age. In fact, Nagata et al. reported that the cerebrospinal fluid (CSF)-to-brain ratio remains constant for the first six decades and then begins to change thereafter. One of the most reproducible measures used in these studies is the ratio of ventricular width to the corresponding width of the skull or brain.


SULCAL ENLARGEMENT

Enlargement of the superficial sulci, particularly in the frontal parasagittal region and in the parietal and temporal lobes, is a commonly described normal
feature of aging. The etiology for this observation may be related to a decrease in volume of subcortical structures rather than to a change in width of the cortex (59). Miller et al. (61) reported that the ratio of gray matter versus white matter was 1.13 at age 20, 1.28 at age 50, and 1.55 at age 100, which suggests that white matter atrophy exceeds that of gray matter. Most authors suggest that physiologic atrophy commences at the age of 50. However, CT studies on postmortem and living patients do show a wide variation in the CSF space size, ranging between 30% and 50% of the size of healthy young adults. Associated widening of the interhemispheric fissure, extending posteriorly to or beyond the callosomarginal sulci, has also been observed. Progressive widening of the sulci occurs in the frontal lobes and cerebellar vermis, beginning in the teenaged years (13). Widening of the superficial sulci seen with normal aging is often termed cortical atrophy by radiologists; however, in fact, this should more correctly be referred to as gyral or superficial atrophy. Sulcal enlargement in aging is diffuse; however, changes are best identified in specific locations after 50 years of age (12). Widening of the superficial cortical sulci is seen first in the frontal and parietal parasagittal regions (81). The anterior interhemispheric fissure and the CSF spaces around the cerebellar vermis also widen with age (37). The sulci around the central, precentral, postcentral, and superior frontal gyri widen later (49,82).


Table 3-1. Computed Tomography Ratios


Evans: frontal horn span or internal diameter of skull (Gawler et al., 1976)


<0.29 in patients <60 yr


>0.50 obstructive hydrocephalus (LeMay, 1984)


Bicaudate: width of ventricles between caudate or internal diameter of skull (Pelicci, 1979)


<0.17 normal


>0.20 abnormal (Hahn and Rim, 1976)


Third ventricle: sum of distance lateral margin of third and Sylvian fissure/internal diameter of skull


<0.59 demented patients (Brinkman et al., 1981)


Gray matter to white matter (normal values):


1.13 (20 yr) 1.28 (50 yr) 1.55 (100 yr) (Miller et al., 1980)


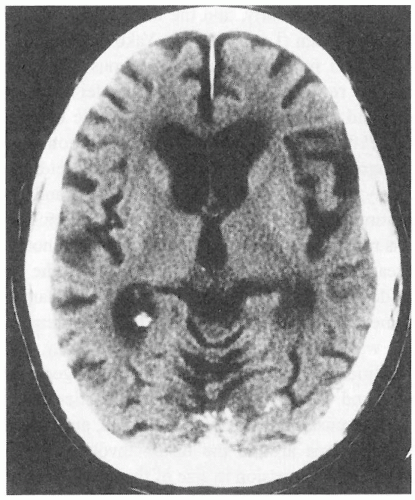
Figure 3-1. A 92-year-old man with atrophy. Noncontrast axial-computed tomography imaging demonstrates diffuse ventricular and sulcal widening.


CEREBRAL WHITE MATTER

Studies have shown that white matter volume diminishes by 12% with normal aging and that this age-related change may contribute to the development of mild cognitive impairment (MCI) in the aged. MCI is now being proposed as a transitional stage between normal aging and dementia (30). Studies have shown that 30% to 80% of elderly individuals without neurologic deficits have focal abnormalities in the white matter (11). These foci are seen as areas of high signal in the periventricular, subcortical white matter, with capping of the lateral ventricular margins on T2-weighted images. On electron microscopy, these corresponding MRI changes feature atrophy of axons and myelin with associated gliosis, tortuous thickened vessels, and increased intracellular water (23). Some of these changes histologically are thought to be secondary to ectasia of the arterioles, with enlargement of the surrounding perivascular spaces (23). These findings were first described by Durand-Fardel in 1843 (28) and were termed état criblé. In addition, aging is associated with an increase in iron deposition specifically in the corpus striatum (2). This iron accumulation is thought to be related to a decrease in oligodendroglial function and dopamine production
and an increase in the free radical formation (2). Iron is also deposited in the walls of blood vessels. Iron is more easily visualized on T2-weighted images as focal regions of low signal secondary to field heterogeneity and magnetic susceptibility (25).


SKULL CHANGES WITH AGING

Finby and Kraft (59) found that most skull radiographs taken of the same individuals over time revealed an increase in the size of the cranial vault, facial bones, and paranasal sinuses and in the skull thickness, which is thought to be secondary to continuous resorption and regrowth of the skull and facial bones.


(1H) PROTON MAGNETIC RESONANCE SPECTROSCOPY

Magnetic resonance spectroscopy (MRS) is an MRI technique that permits noninvasive quantitative measurement of cerebral biochemical metabolites. MRS can be used to selectively “sample” a biochemical map of a selected volume of the brain (voxel) (77). The principle cerebral metabolites that are routinely measured with MRS are N-acetylaspartate (NAA), creatine and phosphocreatine (PCr/Cr), choline (Cho), myoinositol (mI), and glutamate plus glutamine (Glx). NAA is principally found within neurons and is a sensitive indicator of neuronal loss. Creatine is a byproduct of oxidative phosphorylation and the energy cycle associated with adenosine triphosphate (ATP) production; the concentration of this metabolite is very constant, and therefore, this value is often used as an internal reference standard. Myoinositol is a byproduct of glucose metabolism and is known to occur in elevated concentrations in diabetes and Alzheimer’s disease. Choline (Cho) is abundant in the cell membrane, and elevation in this metabolite’s concentration is reported in neoplasia and demyelination (72).

As seen in Table 3-2, the normal aging brain shows very small but definite changes in the MRS spectral signature as compared with a young adult. With aging, NAA has been shown to decrease in the occipital gray matter, the generalized concentration of choline is reported to elevate, and myoinositol (mI) is relatively reduced. Ross et al. (72) has shown that none of these changes exceed 10% of the normal young adult.


MOLECULAR NEUROIMAGING

The complex but close relationship between brain physiologic activity and brain blood flow is the basis for nuclear medicine imaging protocols for the brain. The development of scintillation multiprobe systems provided a technique to quantify regional cerebral blood flow (rCBF), or perfusion, within individual regions of the cortex and, ultimately, to compare the rCBF with regional brain function. Single photon emission computed tomography (SPECT) and positron emission tomography (PET) have the ability to perform rapid three-dimensional physiologic imaging of the brain. This has become particularly important in geriatric brain imaging by helping to differentiate the various causes of dementia. For example, the reduction of metabolism and perfusion in the temporoparietal areas in the brain has become a biomarker for Alzheimer’s disease (AD). Another potential use for PET biomarkers is to follow the response to drug or other treatments (39).


Table 3-2. Magnetic Resonance Changes in Aging


Age Range


NAA/Cr


Cho/Cr


ml/Cr


Gray matter


16-25


1.40


0.56


0.60


26-37


1.36


0.61


0.60


40-78


1.26


0.60


0.59


White matter


16-25


1.54


0.77


0.59


29-37


1.49


0.78


0.60


40-78


1.41


0.82


0.63


Cho, total choline; Cr, total creatine; ml, myoinositol; NAA, N-acetylaspartate.


From Ross BD, Bluml S, Cowan R, et al. In vivo MR spectroscopy of human dementia. Neuroimaging Clin N Am. 1998;8(4):809-822, with permission.


The radiopharmaceuticals that are in common use (1) to evaluate brain physiology by rCBF SPECT include 99mTc-hexamethyl propylene amine oxime (HMPAO; exametazime, Ceretec, Amersham Inc.), 123I-inosine monophosphate (IMP; which is intermittently available), 133Xe gas (General Electric Corp.), and 99mTc-ethyl cysteinate (ECD; Merck Du Pont Inc.).

The most commonly used radiopharmaceuticals for PET imaging (22) of the brain are 18F-fluorodeoxyflucose (18F-FDG), which measures the cerebral metabolic rate for glucose (CMRGlc), and 15O-H2O, which measures rCBF. Two new compounds being used for imaging in the AD patient are fluorine-18-labelled FDDNP and the Pittsburgh compound B (carbon-11-labelled PIB). The [18F]FDDNP labels both neurofibrillary tangles and beta-amyloid neuritis plaques, whereas [11C]PIB only labels the amyloid deposits (83).


MOLECULAR IMAGING IN NORMAL AGING

Normal age-related atrophy can significantly influence qualitative and quantitative analyses of 18FFDG-PET studies. The 18F-FDG-PET findings in a normally aging brain, as reported in the literature,
have been inconsistent. A number of investigators have described diminished regional glucose metabolism (CMRGlc) in the temporal, parietal, somatosensory, and, especially, frontal regions. Others have described more prominent decreases in the frontal and somatosensory cortices in comparison with younger controls (15,51,87). When brain atrophy was not considered, mean CMRGlc values were lower in older patients, particularly in the frontal, parietal, and temporal regions. Also, women had significantly higher mean CMRGlc than men. Cerebrovascular risk factors in the population were also seen not to have any effect on CMRGlc (87).


VOLUMETRIC MRI

Volumetric MRI is a relatively new and increasingly important technique in the study of dementias, especially in the aid of diagnosis and to follow progression of disease (85). The availability of inexpensive powerful computing platforms provides methods for automatic volumetric analysis of three-dimensional datasets. Voxel-based morphometry involves a voxel-wise statistical comparison of the local concentration of gray matter between two groups of subjects. It is used to assess patterns of atrophy (85).


PATHOLOGIC CONDITIONS

Most dementing illnesses are typically irreversible and progressive (31). Therefore, it is of the utmost importance to exclude reversible systemic causes such as infection, electrolyte or chemical imbalance, heart disease, or nutritional disorders that can mimic dementia. The major role of imaging is to detect treatable structural disorders such as hemorrhage, malignancy, posttraumatic lesions, infection, and hydrocephalus (57). CT and MRI have greatly improved our ability to detect these treatable conditions. In addition, physiologic imaging procedures (e.g., MRS, SPECT, and PET) are leading the advances in early diagnosis of debilitating diseases such as AD.


ALZHEIMER’S DISEASE (AD)

With more people living longer, the prevalence of AD has doubled since 1980 and will likely triple by the year 2050 (14). Although it is possible to make an accurate clinical diagnosis of dementia in most patients with severe disease, it is very difficult to differentiate between AD and other dementing disorders in patients with mild disease (80). With functional imaging studies such as SPECT and PET, it is believed to be possible to make an early diagnosis of AD and possibly help in elucidating the mechanisms underlying the disorder. AD is known to target specific brain regions, especially the cholinergic basal forebrain and medial temporal lobe structures including the hippocampus, amygdala, and entorhinal cortex (14). The role of neuroimaging has been detection of early structural changes in the hippocampal formation and parahippocampal gyrus because memory loss is a prominent feature of AD. Table 3-3 summarizes the benefits and disadvantages of various imaging techniques.


Computed Tomography (CT) in AD

CT is diagnostically limited because of skull base artifacts and a limited view of the hippocampus. However, it has been shown that, when imaging is performed in an angulated fashion to optimize capture of the cross section of the temporal lobe, it is possible to measure the minimal width of the medial temporal lobe (MTL), which has been shown to be a useful marker for AD (63). The MTL in patients with AD is significantly lower than the MTL of patients with clinical depression. O’Brien et al. (63) showed that the mean MTL for patients with AD was 10.8 mm versus 14.0 mm for patients with depression.


Magnetic Resonance Imaging (MRI) in AD

The best visualization of the MTL is provided by MRI (Fig. 3-2). High-resolution imaging in the coronal plane, using a fluid-attenuated inversion recovery (FLAIR) sequence as well as a three-dimensional volume gradient echo sequence, is useful to image the temporal lobe, allowing for both morphologic and volumetric analysis to be done. Volumetric evaluation
of the temporal lobes can be performed and compared with normative data published by Bhatia et al. (7). In patients with AD, volumetric measurements reveal significantly lower measurements compared with a group of controls (47). A more recent study by Cuenod et al. (19) has shown that atrophy of the amygdala can occur earlier than hippocampal atrophy.


Table 3-3. Value of Imaging Techniques in Alzheimer’s Disease


CT


Of limited value (bone artifact inhibits evaluation of the medial temporal lobe)


MRI


Allows for volumetric measurements of the temporal lobe with significant reduction seen in Alzheimer’s disease (AD) as compared with depression and other dementias


MRS


Myoinositol is elevated in AD and decreased in other dementias


SPECT


Bilateral hypoperfusion of the temporal and parietal lobes using HMPAO or inosine 5′-monophosphate


PET


Decrease in whole brain CMRGlc values, especially in the temporal and parietal lobes


CMAGlc, cerebral metabolic rate for glucose; CT, computed tomography; HMPAO, 99mTc-hexamethylpropyleneamine oxime; MRI, magnetic resonance imaging; MRS, magnetic resonance spectroscopy; PET, positron emission tomography; SPECT, single photon emission computed tomography.


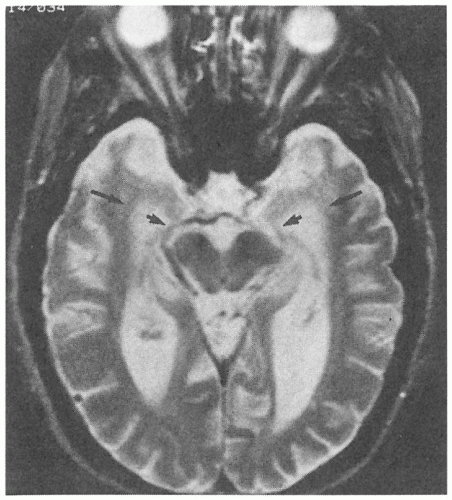
Figure 3-2. A 76-year-old man with Alzheimer’s disease. Axial T2-weighted magnetic resonance imaging demonstrates bilateral hippocampal (short arrows) and temporal lobe atrophy with resulting compensatory widening of the temporal horns (long arrows).


Magnetic Resonance Spectroscopy (MRS) in AD

Using proton (1H) MRS (58) in the evaluation of AD has shown a loss of NAA and an increase in myoinositol (mI) (Fig. 3-3) in the posterior cingulate region, which suggests a loss of neuronal content. The specific regions of the brain that show the largest and earliest reduction in NAA are the mesial temporal lobe, entorhinal cortex, hippocampus, and limbic system (44). The mean reduction in NAA is approximately 10% when compared to normal controls. Changes in mI concentration have been shown to occur earlier than the decrease in NAA, and these changes are most pronounced in the mesial temporal lobe (44). Myoinositol has been used to distinguish patients with AD from normal patients or patients with other causes of dementia. This elevation is thought to result secondary to an astrocytic reaction to the presence of neurofibrillary tangles. Elevation of choline (Cho) has been neither reproducible nor specific to AD (72). Ross et al. (72) have shown that MRS can distinguish AD with a specificity of 95%.

Only gold members can continue reading. Log In or Register to continue

Stay updated, free articles. Join our Telegram channel

Jul 14, 2016 | Posted by in NEUROLOGY | Comments Off on Imaging of the Aging Brain

Full access? Get Clinical Tree

Get Clinical Tree app for offline access