NPP
2.
PP  PP
PP
 PP
PP3.
PP  NPP
NPP
 NPP
NPP4.
NPP  PP
PP
 PP
PPThis categorization will be used in the present study.
The aim of the present work was to study the relationship between changes in body posture dominance and body weight changes over time in OSA patients. For this purpose we have assessed the demographic and polysomnographic data of nontreated OSA patients who had two complete PSG evaluations during a period of approximately 6 years.
Methods
Participants
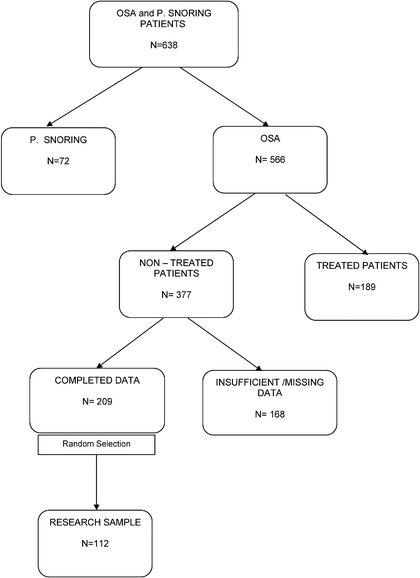
This was a retrospective study of 638 patients who underwent two complete PSG evaluations at our sleep disorders unit between April 1998 and March 2010.
Following the first PSG, 72 patients were diagnosed as primary snorers and 566 as OSA patients. The majority of patients received the PSG results during a summary meeting with a sleep specialist during which they were informed about the available therapeutic modalities for their problem. Only few preferred and received the PSG results by mail. Before the second PSG, only 189 (33.4 %) OSA patients received treatment, while 377 (66.6 %) were not treated.
Most of the OSA patients have chosen not to get treatment for the time being, and a few of them decided that treatment was not strictly necessary.
Untreated patients were referred for a reevaluation for various reasons such as to verify objectively their subjective sense of worsening or improvement of symptoms or to reevaluate their condition after several years (without a clear subjective sense of change of symptoms). It should be mentioned that polysomnography is included in our medical services free of charge.
The inclusion criteria for the present research group included adult (≥18 years old) nontreated OSA patients who underwent two complete PSG evaluations separated by at least 6 months who slept at least 30 min in the supine and lateral position during each PSG evaluations. After applying the inclusion criteria and excluding patients with insufficient sleep data and/or missing data, the conduction of a randomized selection of OSA patients with completed data, resulted in a sample of 112 nontreated OSA patients (the research group) (Fig. 1). Twelve (10.7 %) of these patients participated also in our previous study [11]. The entire research group was divided into four subgroups according to the positional dominance change which occurred during the time interval between PSG 1 and PSG 2: NPP who remained NPP; PP who remained PP; patients who became worse, i.e., PP who became NPP; and patients who improved, i.e., NPP at PSG 1 who became PP at PSG 2.


Fig. 1
Flow chart describing the patient’s population
To learn more about the effect of weight changes on positional dominance, the patient’s sample was divided into three groups according to the weight changes which occurred between PSG 1 and PSG 2. Patients were assigned to the “weight gain group” if their weight increased more than 3 kg. The “weight loss group” consisted of patients who lost more than 3 kg, and patients who had a weight change of 3 kg or less were assigned to the “same weight group.” The 3 kg cutoff was based on our clinical experience that even a small increase or decrease in weight could worsen or improve the severity of OSA.
Overnight Polysomnographic Evaluation
Polysomnographic (PSG) recordings were performed with the Rembrandt Manager System (Medcare, Amsterdam, The Netherlands) and included conventional parameters [1]. Sleep stages were scored manually according to the standard criteria [16], by the same polysomnographic technicians during the entire study period. Apnea was defined as an episode of complete breathing cessation of 10 s or longer, and hypopnea as a reduction in oral/nasal airflow lasting 10 s or longer, accompanied by arousal or by a drop of at least 3 % in SaO2. The number of apnea + hypopnea events per hours of sleep (apnea-hypopnea index, AHI) [17] was calculated, and severity of OSA was defined as mild for AHI 5–15, moderate for AHI 15–30, and severe for AHI > 30. The Epworth Sleepiness Scale (ESS) [18] was used for the subjective estimation of daytime sleepiness.
The ethical committee of the Loewenstein Hospital Rehabilitation Center approved the study.
Statistical Analysis
Initially, a comparison of the demographic and polysomnographic variables between the four subgroups of OSA patients according to positional dominance at the time of the first and second PSG was performed. Subsequently the same variables were compared in OSA patients who gained weight, who lost weight, and whose weight did not change. For all mentioned parameters, one-way analysis of variance (ANOVA) and Bonferroni adjustment were applied for multiple comparisons. For variables that did not show normal distribution, the nonparametric Kruskal–Wallis one-way analysis of variance was applied. Mann–Whitney U test was used to further explore the difference between groups when the assumption of normality was violated.
The significance level was set at p ≤ 0.05. Data analysis was performed with the SPSS for Windows, version 15.0. Results are expressed as mean ± SD.
Results
Of the entire research group of OSA patients, 18.8 % were women. The average age was 51.8 ± 10.3 years, the average body mass index (BMI) was 29.9 ± 4.6, and the average AHI was 27.0 ± 19.7. The OSA patient population was first assessed according to body posture dominance.
During an average of 6.2 years of interval between the first and second PSG evaluations, a similar portion of NPP became PP (20, 17.9 %) and PP became NPP (23, 20.5 %). However, the greater portions of the patients were and remained PP (58, 51.8 %) and relatively few were and remained NPP (11, 9.8 %).
Table 1 summarizes the main demographic and polysomnographic characteristics of the four subgroups of OSA patients according to body position dominance at the time of PSG 1.
Table 1
Main demographic and polysomnographic (PSG) variables at PSG1 of the four groups of obstructive sleep apnea (OSA) according to changes in body position dominance
(1) Remained NPP, n = 11 | (2) Remained PP, n = 58 | (3) Became NPP, (worse) n = 23 | (4) Became PP (improved), n = 20 | p a | Group differences | |
|---|---|---|---|---|---|---|
Age, years | 52.9 ± 6.5 | 52.1 ± 11.2 | 52.6 ± 7.5 | 49.2 ± 11.8 | N.S. | |
Weight, kg | 104.4 ± 18.2 | 82.4 ± 13.3 | 85.2 ± 14.0 | 89.6 ± 17.2 | 0.0001 | 1 ≠ 2* 1 ≠ 3* 1 ≠ 4* |
BMI, kg/m2 | 34.9 ± 6.2 | 28.6 ± 3.1 | 29.5 ± 4.1 | 31.6 ± 5.8 | 0.0001 | 1 ≠ 2* 1 ≠ 3* 2 ≠ 4* |
AHI, events per hours of sleep | 47.2 ± 28.1 | 23.5 ± 14.9 | 22.9 ± 12.2 | 30.4 ± 26.5 | 0.012 | 1 ≠ 2** 1 ≠ 3** 1 ≠ 4** |
AHI sup, events per hours of sleep | 56.1 ± 35.8 | 48.6 ± 25.7 | 49.6 ± 25.5 | 35.6 ± 27.0 | N.S. | |
AHI lat, events per hours of sleep | 46.1 ± 24.6 | 9.5 ± 9.6 | 10.1 ± 7.9 | 28.1 ± 27.7 | 0.0001 | 1 ≠ 2** 1 ≠ 3** 1 ≠ 4** 2 ≠ 4** 3 ≠ 4** |
Snore supine, dB | 70.5 ± 7.8 | 66.0 ± 7.6 | 69.6 ± 7.5 | 65.5 ± 7.1 n = 18 | N.S. | |
Snore left, dB | 63.9 ± 7.6 n = 9 | 56.5 ± 10.8 n = 49 | 60.6 ± 9.2 n = 20 | 60.2 ± 10.4 n = 17 | N.S. | |
Snore right, dB | 68.4 ± 6.6 n = 10 | 58.1 ± 10.8 n = 54 | 62.9 ± 8.1 n = 22 | 61.3 ± 6.5 n = 16 | 0.009 | 1 ≠ 2* |
ESS, units | 9.8 ± 4.2 n = 4 | 10.3 ± 4.8 n = 37 | 7.4 ± 4.7 n = 17 | 12.7 ± 6.1 n = 14 | 0.041 | 3 ≠ 4* |
Min SaO2 REM, % | 75.1 ± 8.8 | 84.7 ± 9.4 | 84.0 ± 7.1 | 79.3 ± 14.4 | 0.013 | 1 ≠ 2** 1 ≠ 3** |
Min SaO2 NREM, % | 82.8 ± 3.9 | 85.5 ± 7.0 | 87.5 ± 5.3 | 86.6 ± 7.6 | 0.041 | 1 ≠ 2** 1 ≠ 3** 1 ≠ 4** |
There was no age difference between the four subgroups of OSA patients. As can be seen in Table 1, patients who were NPP and remained NPP were found initially to be significantly more severely affected than the other three subgroups of OSA patients. Most of those patients had a significant higher body weight, BMI, AHI, and lateral AHI (AHI lat) and lower minimum SaO2 both during REM and NREM sleep, compared to the other subgroups. Although the supine AHI (AHI sup) was also higher in these patients compared to the other groups, the differences did not reach statistical significance.
Although patients who were NPP and remained NPP had a higher maximal snoring loudness in the different body postures than the other three groups, the only significant difference was observed in the right posture compared to PP who remained PP.
Not surprisingly, NPP who improved and became PP had initially a significantly higher Epworth Sleepiness Scale (ESS) value (more sleepy) than PP who became worse and were converted to NPP.
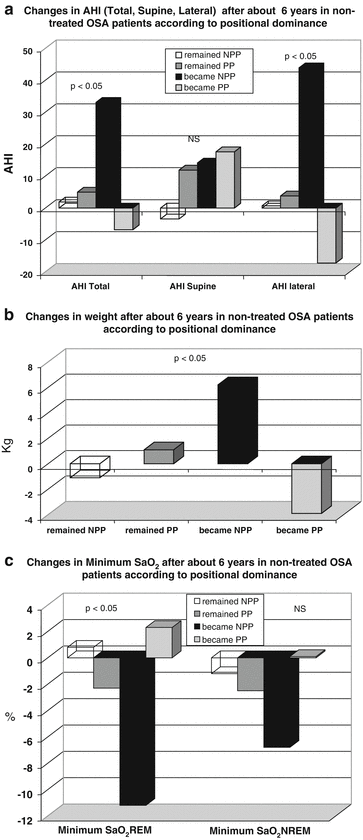
The changes (between PSG 1 and PSG 2) in AHI (total, supine, and lateral) which occurred following the interval between the two PSGs in the four subgroups of OSA patients according to positional dominance are shown in Fig. 2a.


Fig. 2


Changes over time in (a) AHI, (b) body weight, and (c) minimum SaO2. According to changes in positional dominance in four groups of nontreated OSA patients who had two PSG evaluations about 6 years apart. PP—positional patients; NPP—non-positional patients. Remained NPP (1); remained PP (2); became NPP (3); became PP (4). (a) AHI total: p ≤ 0.05 (1) ≠ (3); (2) ≠ (3); (3) ≠ (4). AHI lateral p ≤ 0.05 (1) ≠ (3); (2) ≠ (3); (2) ≠ (4); (3) ≠ (4). (b) Body weight: p ≤ 0.05 (1) ≠ (3); (2) ≠ (3); (2) ≠ (4); (3) ≠ (4). (c) Minimum SaO2 REM: p ≤ 0.05 (1) ≠ (2); (1) ≠ (3); (2) ≠ (3); (3) ≠ (4)
Stay updated, free articles. Join our Telegram channel

Full access? Get Clinical Tree


