High risk factors (high risk for necessary neurosurgical intervention)
• Score of less than 15 on the GCS at 2 h post-injury
• Suspected open or depressed skull fracture
• More than two episodes of vomiting
• Physical evidence of basal skull fracture (e.g., haemotympanum, ‘panda’ eyes, cerebrospinal fluid leakage from ears or nose, Battle’s sign)
• Age >65 years
Medium risk factors (for predicting brain injury on CT)
• Amnesia for events that happened more than 30 min before the impact
• Dangerous mechanism of injury (e.g., pedestrian struck by motor vehicle, fall from higher than 3 ft or 5 stairs)
Table 2
New Orleans criteria for mild TBI
CT is indicated if any of the following are present: |
• Headache |
• Vomiting |
• Age over 60 years |
• Drug or alcohol intoxication |
• Deficits in short-term memory |
• Posttraumatic seizure |
• Evidence of injury above the clavicles |
More recently, evidence-based guidelines were proposed by a multidisciplinary panel representing a joint effort between the ACEP and the Centers for Disease Control and Prevention (CDC) which were intended for patients with blunt head trauma who present to the Emergency Department (ED) within 24 h of injury, who have a GCS score of 14 or 15 on initial evaluation in the ED, and are 16 years of age or older [2]. These recommendations include the indication for a noncontrast head CT in patients with loss of consciousness or posttraumatic amnesia if one or more of the following is present: (1) headache, (2) vomiting, (3) age greater than 60 years, (4) drug or alcohol intoxication, (5) deficits in short-term memory, (6) physical evidence of trauma above the clavicle, (7) posttraumatic seizure, (8) GCS score less than 15, (9) focal neurologic deficit, or (10) coagulopathy (Level A recommendations). Additionally, recommendations include consideration of a noncontrast head CT in head trauma patients with no loss of consciousness or posttraumatic amnesia if there is a focal neurologic deficit, vomiting, severe headache, age 65 years or greater, physical signs of a basilar skull fracture, GCS score less than 15, coagulopathy, or a dangerous mechanism of injury (e.g., ejection from a motor vehicle, pedestrian struck by a vehicle, fall from a height of more than 3 ft or 5 stairs). Other federal agencies including the Veterans Administration and the Department of Defense have also established guidelines for the use of imaging in mild TBI in deployed and non-deployed military settings [15, 16].
Additionally, special consideration exists for use in infants and children. No single set of clinical criteria has been identified to detect radiographic lesions in all pediatric patients. Infants have been reported to develop intracranial hematomas despite “normal” initial CT scanning and examination, and age younger than 2 years has long been recognized as an independent risk factor for significant head injury [17]. Symptoms such as vomiting and seizures may be less specific and sensitive in infants and young children and a significant number may exhibit no initial signs or symptoms of brain injury [18, 19]. Therefore, some have argued that CT should be considered following any nontrivial injury, particularly when there are significant scalp findings such as hematoma [20]. In addition, others have suggested that investigation with CT is advisable in young children since fractures can be missed on magnetic resonance imaging (MRI). With regard to mild TBI, both the CCHR and the NOC have been applied in children [21] as have other clinical decision rules including the Canadian Assessment of Tomography for Childhood Head Injury (CATCH) rule [22, 23], the Children’s Head injury Algorithm for the prediction of Important Clinical Events (CHALICE) rule [24], and the pediatric emergency care applied research network (PECARN) rule [25]. A recent review of these and other rules applied in pediatric populations concluded that the PECARN rule appears to be the best validated rule for both children and infants, with the largest study cohort, highest sensitivity, and acceptable specificity for clinically significant intracranial injuries, though further validation of the PECARN rule is necessary [26].
In the acute post-injury interval (>72–96 h), CT (noncontrast) is often the preferred method of imaging in trauma as it can be rapidly and relatively inexpensively performed, is sensitive in detecting fractures, mass effect, and hemorrhages that may require immediate medical attention or surgical intervention, is available 24 h in Trauma I and II centers, and can be performed in more severely injured patients who may be otherwise unable to undergo MRI (e.g., presence of MRI-incompatible medical equipment or other contraindications for MRI, patient is unable to remain still for the longer duration of MRI). However, even in cases of acute mild TBI, CT is generally the preferred imaging technique to rule out pathology that may require observation or attention. In the subacute (<72–96 h post-injury) and chronic phases of injury, MRI may be the preferred method of imaging following TBI due to its increased sensitivity to more subtle forms of injury or to forms of injury more detectable in a chronic post-injury interval. As demonstrated in Fig. 1, CT provides gross anatomical information related to the brain and skull; however, MRI sequences are generally superior in visualizing brain anatomy and, in some contexts, underlying neuropathology.
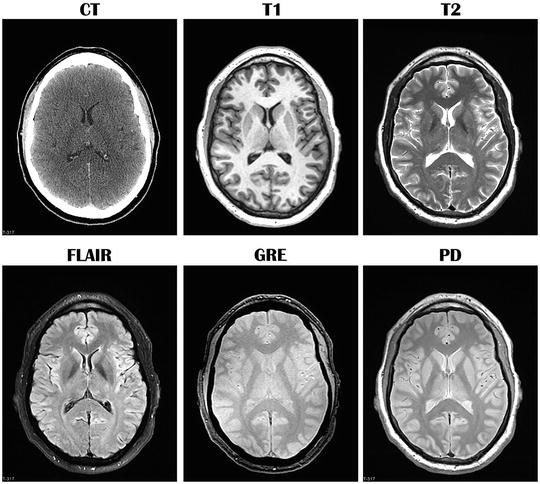
Fig. 1
Comparison of computed tomography (CT) and different standard magnetic resonance imaging (MRI) sequences in the same healthy (uninjured) individual. Images are in the axial (transverse) plane and at approximately the same level. Each MRI sequence uniquely assesses brain parenchyma and cerebrospinal fluid. T1 T1-weighted MRI, T2 T2-weighted MRI, FLAIR fluid attenuated inversion recovery, GRE gradient recalled echo, PD proton density
Sensitivity of CT Versus MRI
From a practical standpoint where imaging is used to impact clinical decision-making in the acute phase of injury, a CT scan is typically considered “positive” in the acute phase of injury if it reveals a traumatic intracranial lesion that requires either intervention or observation including a subdural, epidural, or parenchymal hematoma, subarachnoid hemorrhage, cerebral contusion, or depressed skull fracture. Although MRI demonstrates a clear advantage in the detection of axonal injury, small areas of contusion, and subtle forms of injury, MRI and CT are currently considered equivalent for clinical diagnosis of surgically correctable lesions in the acute setting. However, as will be discussed further, MRI may have a distinct advantage in non-acute imaging studies.
Basics of Structural Imaging
CT Basics
CT utilizes X-ray beam technology and subsequent cross-sectional image reconstruction in the axial or transverse plane. As the X-rays are emitted, tissue absorbs some portion of the X-rays that pass through, and the unabsorbed portion is captured and measured. Sophisticated computer algorithms are then applied to the received X-ray to estimate how much was absorbed within a small volume of tissue. In the context of CT, attenuation refers to the ability to block or absorb x-rays as they pass through a tissue or substance (e.g., bone absorbs most of the X-ray, and air absorbs very little). The amount of attenuation in each kind of tissue is relatively constant and is known as that tissue’s attenuation coefficient. In CT, attenuation coefficients are mapped to an arbitrary scale (termed the Hounsfield scale) between −1,000 (air) and +1,000 (bone) in Hounsfield units (HU). In CT, descriptions of notable aspects of the image (abnormalities that are detected) are often described in terms of density or attenuation relative to the expected appearance of certain tissues (e.g., “hypodense”/“hypoattenuation” or dark, “isodense”/“iosattenuation” or similar in radiodensity to another or adjacent tissue, “hyperdense”/“hyperattenuation” or bright).
MRI Basics
MR images represent the intensities of electromagnetic signals from hydrogen nuclei. The MR signal results from resonance interaction between hydrogen nuclei and externally applied magnetic fields which are spatially encoded to provide a mapping of the area imaged. The signal intensity depends on the magnetic environment and the density of the hydrogen nuclei (i.e., protons in water), which have distinct differences between white and gray matter and cerebrospinal fluid (CSF) as demonstrated by the different MRI sequences depicted in Fig. 1. The fundamental principle of clinical MRI is that, when placed in a strong magnetic field, the protons in the body (mostly from hydrogen in water) respond to electromagnetic waves by absorbing and then reradiating these waves in accordance with the magnetic environment of the tissue. Thus, the reradiated waves have a signal strength that characterizes the tissue type. Different tissues are characterized by their signal intensity, appearing brighter or darker on the images as reflected in the standard MRI sequences shown in Fig. 1. In contrast to CT, which reflects “density” in the description of abnormal signal, the word “intensity” is used in description for MRI (e.g., “hyperintense”, “isointense”, or “hypointense”).
The use of innovative methods for varying magnetic field strength, the delays between the sending and receiving of electromagnetic waves, and the acquisition and display of the signal intensity allow the production of a range of images, some of which best demonstrate anatomy while others are more useful in detecting specific forms of pathology. For example, Tl-weighted images tend to show greater anatomical detail, but may not be necessarily sensitive to certain forms of pathology because they are less sensitive to differences in adjacent tissue signal. In contrast, scans that are T2-weighted generally show normal structures as having an intermediate (gray) intensity, while fluid and many pathologic abnormalities appear with high intensity (white), often providing the kind of contrast between normal and abnormal tissue types which is indicative of certain pathology. Other sequences that provide averages of Tl- and T2-weighting are called balanced or proton density sequences. Common appearances of typical tissues on MRI are listed in Table 3.
Table 3
MRI appearance of commonly scanned tissues
Tissue | T1-Weighted | T2-weighted | T2-weighted |
|---|---|---|---|
GRE | FLAIR | ||
Gray matter | Gray | Light gray | White/light gray |
White matter | White | Dark gray | Dark gray |
CSF or water | Black | White | Black |
Blood | Depends on timing (white–gray) | Black with blooming | Black without blooming |
Fat | White | Black | Black |
Air | Black | Black | Black |
Bone or calcification | Black | Black | Black |
Edema (established) | Gray | White | White |
Demyelination or gliosis | Gray–black | White | White |
Ferritin deposits | Dark gray | Black | Black |
Calcium bound to protein | White | Dark gray | Dark gray |
Proteinaceous fluid | White | Variable | Variable |
Different forms of T2-weighted imaging may be particularly useful for detecting various forms of TBI-related pathology. For example, the fluid attenuated inversion recovery sequence (FLAIR) is particularly sensitive to several trauma-related abnormalities within the white matter reflected as hyperintense (bright) signal (e.g., gliosis). The gradient (recalled) echo (GRE) affords excellent image detail with short imaging times and is sensitive to the presence of blood and a blood breakdown product called hemosiderin, which when present is reflected as a hypointense or dark signal. Detection of hemosiderin in brain parenchyma can also suggest the presence of neurodegerative changes such as gliosis in surrounding tissue. Susceptibility-weighted imaging (SWI) is considered to be sensitive in detecting microhemorrhages, which appear as hypointense (dark) regions.
Common Forms of TBI-Related Pathology Detectable on Imaging
As part of the inter-agency Common Data Elements (CDE) initiative, Haacke et al. [27] define and review 22 forms of TBI-related pathology identifiable on conventional CT and MRI at both acute and chronic post-injury intervals (see also [28]). These include extra-axial (external to the brain parenchyma) blood collections (epidural hematoma (EDH), subdural hematoma, subarachnoid hemorrhage, and intraventricular hemorrhage) as well as intra-axial (within the brain) lesions (contusions, intra-parenchymal hematoma, diffuse/traumatic axonal injury) and other forms of secondary injury (hypoxia, ischemia, edema), and degenerative change (volume loss, encephalomalacia, gliosis). Other functional changes are also detectable with additional applications of MRI. Table 4 summarizes the most common forms of TBI-related pathologies visible on imaging, their causes, and their characteristic appearance on CT and MRI at both acute and chronic post-injury intervals. Fig. 2 illustrates some of these characteristic forms of TBI-related pathology in cases of severe TBI on day-of-injury CT.
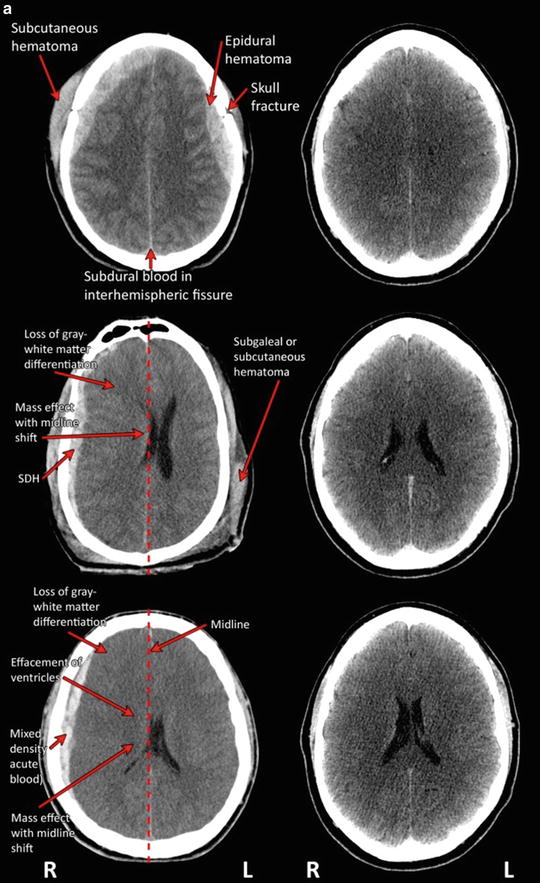
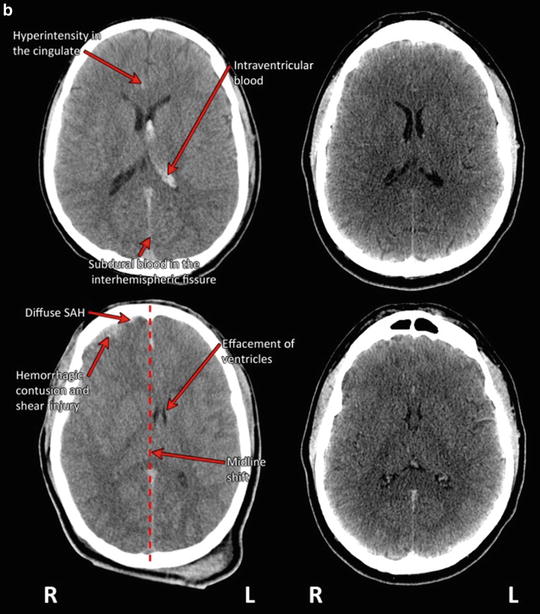
Table 4
Appearance of Common Forms of TBI-related Pathology on Imaging
Pathology | Cause and typical location | Appearance on CT | Appearance on conventional MRI sequences | Detectable on advanced MRI sequences |
|---|---|---|---|---|
Blood-related lesions | ||||
Note: Extra axial blood is usually best visualized on a T2-weighted or gradient recalled echo (GRE) sequence | ||||
Epidural hematoma (EDH) | Collection of blood (between the dura mater and skull) that does not generally extend past the sutures of the skull (though it can cross midline with associated tearing of the dura mater), usually caused by tearing of meningeal artery/vein, diploic vein, or dural venous sinus; typically occurs at the site of impact and is often associated with an overlying skull fracture; most common in the temporal or temporoparietal regions | Classically, a lentiform-shaped blood collection Acute: hyperdense in the majority of cases; sometimes mixed lucency (hyperdense and hypodense features) during active bleeding Subacute: homogeneously isodense to hyperdense as active bleeding stops Chronic: at least partially isodense to hypodense with breakdown and resorption appears on CT as a shallow blood collection that follows the convexity of the skull and can cross suture lines, but do not cross midline | Acute: isointense to minimally hyperintense mass (clot) on T1-weighted imaging (and markedly hypointense on T2-weighted imaging) separated by dura by a thin rim of extruded serum, which is hyperintense on T1- and T2-weighted sequences Subacute: hyperintense on T1-weighted imaging Chronic: will become isointense as blood is reabsorbed | N/A (CT and conventional MR sequences are typically used for detection of EDH) |
Subdural hematoma (SDH) | Collection of blood (between the dura mater and the arachnoid membrane) resulting from breakage of bridging vessels between the brain surface and the dura; often crescent-shaped; often occurs at the primary site of traumatic impact or “contre-coup” site; SDH are often associated with deceleration injuries with rupturing of veins via a shearing mechanism; occur most often around frontal and parietal lobes, though they can also occur in the posterior cranial fossa | Acute: often hyperdense but can be isodense (e.g., severe anemia or blood loss, if CSF is mixed with hemorrhage); can also be heterogeneous in some contexts (e.g., active bleeding, coagulopathy, acute-on-chronic hemorrhage) Subacute (1–2 weeks): may be isodense Chronic: (greater that 2 weeks) may be isodense relative to CSF or hypodense if older than 3 weeks | Acute/Subacute: hyperintense, with more intermediate intensity associated with acute hemorrhage; can be hypointense on GRE Chronic: isointense to CSF on T1-weighted images and hypointense on T2-weighted and GRE images. FLAIR imaging may be the most sensitive to chronic SDH | N/A (CT and conventional MR sequences are typically used for detection of SDH) |
Subarachnoid hemorrhage (SAH) | Collection of blood in the subarachnoid space that is normally filled with CSF (e.g., cistern, brain convexity), which may result from direct laceration of small cortical vessels, redistribution of IVH flowing from the fourth ventricle or direct extension from cortical contusion/hematoma | Acute: areas of hyperdensity outlining the cerebral sulci, Sylvian fissures or basal cisterns | Acute: can appear isointense on T1 and T2-weighted images, but generally hyperintense on FLAIR | N/A (CT and FLAIR sequences are typically used for detection of SAH) |
Chronic: N/A; will become isodense as blood is reabsorbed | Chronic: N/A; will become isointense as blood is reabsorbed | |||
Intraparenchymal hemorrhage (IPH) | Collection of blood within the cerebral hemisphere; often in the frontal and temporal lobes; may leave hemosiderin deposits as macrophages digest hemoglobin from the blood | Acute: areas of hyperdensity | Acute: hypo- to isointense on T1-weighted imaging, and markedly hypointense on T2-weighted imaging | Susceptibility weighted imaging (SWI) may be used to detect small microhemorrhages in the parenchyma |
Subacute: hyperintense on T1-weighted imaging and hypointense (dark) on T2-images | ||||
Chronic: bright (hyperintense) on both T1- and T2-weighted imaging | ||||
Intraventricular hemorrhage (IVH) | Blood in the ventricles, which often settles in the occipital horns of the lateral ventricles; IVH is often associated with rotation injury which tears subependymal veins on the ventral surface of the corpus callosum and along the fornix | Acute: areas of hyperdensity within the normally dark ventricles | Acute: iso- to hyperintense to CSF on T1-weighted images, and especially hyperintense on FLAIR | N/A (CT and conventional MR sequences are typically used for detection of IVH) |
Contusion | Bruising of the brain by contact with irregular inner surfaces of the skull, especially the sphenoid wings and petrous ridges; often occur at the site of impact or at a “contre-coup” location; most often found in the anterior and lateral temporal and frontal areas | Acute: initially hypodense (though can be isodense) patchy and ill-defined lesion, often progressing over time (usually 24–48 h) in size (“blooming”) and number Chronic: resolution of hypodense signal | Acute: MRI is sensitive to acute hemorrhagic contusions; blood appears as hyperintense signal on FLAIR, isointense to hypointense on T1-weighted, hyperintense on T2-weighted images, and may be hypointense on gradient echo sequences Chronic: resolution of hypointense signal | Conventional MR sequences are typically used for detection of contusion, though these may be also detected via SWI |
Hemosiderin | Deposits from blood products of IPH that remain visible on MRI long after they are no longer visible on CT | Acute: N/A | Acute: N/A | N/A Conventional MR sequences (T2-weighted, FLAIR) are typically used for detection of contusion |
Chronic: N/A | Chronic: dark on T2-weighted imaging; best detected by GRE/SWI sequences; will fade over time | |||
Diffuse or traumatic axonal injury (TAI) | ||||
Traumatic axonal injury | Shear-strain of the axon, usually associated with acceleration/deceleration injury | TAI is often difficult to identify on CT (most lesions are nonhemorrhagic), but may appear as hyperdense petechial hemorrhages at the gray-white matter junction, usually in cerebral hemispheres, corpus callosum, or brainstem | Acute: nonhemorrhagic lesions are best appreciated by FLAIR imaging (hyperintense), and hemorrhagic lesions appear on T2-weighted, GRE and SWI (hypointense); T1-weighted imaging may not detect TAI | Small hemorrhagic TAI may become more visible using SWI (appear as areas of hypointensity) |
Chronic: T2-weighted imaging may become hypointense as the hemorrhagic lesion ages due to hemosiderin deposit. GRE imaging may be useful in the chronic interval | ||||
Edema; usually occurring in the acute and subacute interval | ||||
Note: Edema is usually best visualized on a T2-weighted or GRE sequence | ||||
Vasogenic Edema (Extracellular) | Extracellular water collection resulting from disruption of the blood-brain barrier | Acute: loss of sulci, compression of basal cisterns and flattening of the ventricular margins, but gray/white attenuation and differentiation remain intact Chronic: N/A | Acute: hyperintense on T2/FLAIR, may appear as midline shift/displacement of the ventricle if sufficiently large and causing mass effect Chronic: N/A | Can also be detected by diffusion-weighted imaging |
Cytotoxic edema (cellular) | Results from sustained intracellular water collection (fluid accumulating within cells); sometimes due to high levels of excitatory amino acids or failure of cell membrane pumps | Acute: appears as loss of gray-white matter differentiation | Acute: “slit-like ventricles” and effaced sulci and CSF spaces | Diffusion-weighted imaging may be required to differentiate between vasogenic and cytotoxic edema (restricted in cytotoxic; unrestricted in vasogenic) |
Chronic: N/A | Chronic: N/A | |||
Note that it is generally not possible to differentiate between vasogenic and cytotoxic edema on conventional imaging, though diffusion-weighted imaging can differentiate | ||||
Ischemia, hypoxia | ||||
Acute infarction/ischemia | Uncoupling between the metabolic demands of the neurons due to depolarization caused by trauma and hypoperfusion likely due to transiently disturbed neurovascular functioning, can occur due to mechanical compression of a blood vessel or direct vascular injury, dissection, vasospasm, occlusion, or pseudoaneurysm | Acute: Not usually visualized prior to 24 h. After that, areas of low density may be apparent (from days 1–10, with peak around days 2–4 post-injury) Chronic: appears as a pseudo normalization of density changes (“fogging” effect) by 10 days (e.g., areas of low density are no longer visible by 10 days | Acute: T2 hyperintense on T2-weighted imaging, can also appear as hemorrhage or mass effect. On diffusion-weighted imaging (DWI) may be restricted diffusion as early as 20 min post-infarction/ischemic insult Chronic: as with CT, by 10 days, pseudo normalization occurs, and T2 hyperintensity may no longer be evident; atrophy will eventually be appreciated on any sequence as degenerative processes complete | Appears as areas of restricted diffusion on DWI |
Hypoxia | Related to ventilatory or circulatory compromise, including cardiac arrest or chest injury; injury may be particularly visible in basal ganglia, hippocampus, and dentate gyrus | Acute: usually not visible before 24 h | Acute: usually not visible before 24 h | DWI can be helpful; on DWI, may be restricted diffusion as early as 20 min post-hypoxic insult |
Chronic: hypodensity (when visible) | Chronic: may not be visible on T1-weighted imaging; hyperintense on T2-weighted imaging; will fade over time | |||
Other degenerative changes (not generally detected in acute or subacute interval) | ||||
Gliosis | Consequence of posttraumatic proliferation of astrocytes which may cause the formation of a glial scar | Acute: N/A | Acute: | |
Chronic: faint areas of hypodensity (can be difficult to detect on CT) | Chronic: MRI is more sensitive than CT for detection of gliosis, which appears as areas of hyperintensity on T2-weighted imaging | |||
Encephalomalacia | Alteration of brain tissue resulting from ischemia or inflammation, typically due to vascular insufficiency or degenerative change; may be cystic | Acute: N/A | Acute: N/A | |
Chronic: Hypodense (dark) areas and absence of effacement or poor sulcal definition | Chronic: hypointense on T1-weighted imaging and hyperintense on T2-weighted images | |||
Volume loss | Degenerative changes in white or gray matter which become apparent in the subacute and chronic phases of injury | Acute: N/A | Acute: N/A | Recent advances in image acquisition (usually involving 3D T1-weighted or other sequences) and post-processing have made it possible to perform quite detailed volumetric changes in cortical and subcortical areas |
Chronic: appears as prominence of ventricles, sulci, and subarachnoid CSF. Volume loss can be detected globally and regionally as early as 2 weeks, though may be progressive volume loss may occur | Chronic: as with CT, but can be detected more easily and in specific cortical regions and subcortical structures such as the corpus callosum and hippocampus | |||
Functional changes | ||||
Biochemical or metabolic alteration | Cannot be detected with CT in either the acute or chronic period | Cannot be detected with conventional structural sequences in either the acute or chronic period | Magnetic resonance spectroscopy has been used to examine metabolic or biochemical concentration alteration | |
Disruption of network connectivity | Structural or functional alteration of known “network” functioning within the brain | Cannot be detected with CT in either the acute or chronic period | Cannot be detected with conventional structural sequences in either the acute or chronic period | Functional connectivity MRI (fcMRI) and DTI have been used to demonstrate TBI-related changes in connectivity; these techniques are undergoing validation |
Fig. 2
(a) Traumatic pathology as visualized on CT in patients with severe TBI (left-hand column) as compared to CT in an uninjured individual at the same level (right-hand column). (The top row depicts axial CT through the plane of the centra semiovale demonstrating bilateral posterior fronto-parietal fractures (comminuted with fragment on the left as indicated with arrow) with overlying subcutaneous hematomas (arrow) and underlying bilateral (lentiform) hemorrhagic collections (arrow), likely representing epidural hematomas, with hyperdensity outlining the interhemispheric fissure which may represent evidence for subdural blood (arrow). The middle row portrays an axial CT slice through the plane of the bodies of the lateral ventricles. There are bilateral subcutaneous Fig. 2 (continued) hematomas (as indicated with arrow) with associated air likely related to laceration. There is a large mixed density extra-axial collection outlining most of the right cerebral hemisphere (likely subdural or SDH as indicated by arrow) causing midline shift and mass effect (see dotted line for projected placement of midline in an uninjured condition) bowed convex to the left. Loss of gray matter—white matter differentiation is also appreciated (arrow). The bottom row depicts axial unenhanced CT through the plane of the bodies of the lateral ventricles. There is loss of normal gray–white matter differentiation (arrow) with curvilinear mixed density collection outlining the right posterior fronto-parietal region (arrow) with mass effect displacing the effaced bodies of the lateral ventricles to the left of midline (termed “midline shift”; dotted line depicts the projected placement of midline in an uninjured state). The appearances may represent evidence for acute bleeding. There is subcutaneous soft tissue swelling overlying the right frontal bone. Consistent with radiologic convention, the right side of the head (marked R) is depicted on the left side of the figure; L left side of the head). Traumatic pathology as visualized on CT in patients with severe TBI (left-hand column) as compared to CT in an uninjured individual at the same level (right-hand column) (continued). Top row depicts unenhanced CT through the plane of the bodies of the lateral ventricles. There is evidence for intraventricular blood outlining the body of the left lateral ventricle (arrow). In addition there is subdural blood outlining the interhemispheric fissure (arrow) and hyperdensity seen outlining the right-sided cingulate sulcus (arrow). Subcutaneous hematoma is noted within the left infratemporal fossa. (b) The bottom row depicts axial CT acquired without contrast at the level of the bodies of the lateral ventricles. There is evidence of bifrontal edema in association with hemorrhagic contusion/shear injury (depicted with arrow) seen in association with shallow subdural hematomas overlying the right fronto-temporal lobes. There is mild midline shift (dotted line depicts the projected placement of midline in an uninjured state) bowed convex to the left seen in association with effacement (partial collapse of the ventricle so it is difficult to distinctly visualize; arrow) of the right greater than left body of the lateral ventricle. Subdural blood is noted within the anterior greater than posterior aspect of the interhemispheric fissure. Subcutaneous hematomas are noted within the right infratemporal fossa and overlying the left parietal bone. Consistent with radiologic convention, the right side of the head (marked R) is depicted on the left side of the figure; L left side of the head)
Qualitative Imaging Interpretation
The normal human brain is generally symmetric, with one hemisphere being a mirror copy of the other. While minor asymmetry is commonplace and may be considered normal in certain contexts, prominent asymmetry generally denotes the presence of pathology. Fig. 3 shows an age-matched healthy control at the base of the brain showing the inferior frontal and temporal lobes as well as cerebellum at the level of the IV ventricle compared to a patient who sustained a severe TBI. Note the general symmetry between the hemispheres, where one side can be compared to the other, and they generally have a similar appearance in terms of size and shape. The uniformity of the two sides is also reflected in the general symmetry of the cortical ribbon of gray matter and the central appearance of white matter. However, note that in the individual with TBI, a massive loss of parenchyma has occurred in the right temporal lobe (arrow), which is different than the damage seen on the left. An older surface contusion damaged the lateral aspect of the temporal lobe leaving encephalomalacia (distal white arrow), but white matter signal is abnormal (middle arrow in left temporal lobe), along with temporal horn dilation (medial arrow). Although having the comparison subject facilitates detecting trauma-related abnormalities, the types of pathologies seen in the TBI patient on the left can be readily discerned by understanding the basic principles of similarity and symmetry in image interpretation.
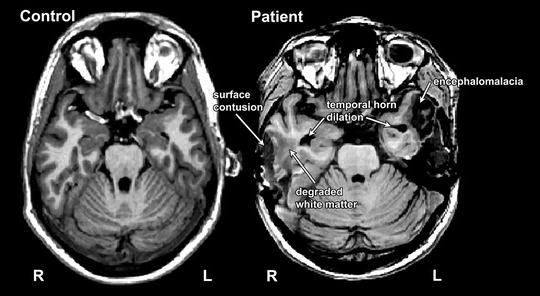
Fig. 3


This patient (right) sustained a severe TBI in a fall where bilateral temporal lobe contusions occurred, with the one on the right associated with temporal bone skull fracture and neurosurgical treatment that included a partial temporal lobectomy. An age-matched control is included at the left at a similar level for comparison of the expected appearance of white and gray matter as well as the appearance of the frontal and temporal lobes and the cerebellum. Note the symmetry of the right and left hemispheres in the uninjured individual. Comparison of the severe TBI patient on the right with the control on the left enables identification of the loss of parenchyma on the right hemisphere due to surface contusion (arrow). The left temporal lobe is also damaged, and simple comparison of the left with the right temporal lobes in this injured individual highlights the differences (lack of symmetry) between hemispheres. The most distal arrow on the left points to an old surface contusion that has resulted in focal atrophic changes (encephalomalacia) with the upward point arrow pointing toward degraded white matter and the most medial arrows pointing to the temporal horn of the lateral ventricles which are dilated in comparison to the control. Consistent with radiologic convention, the right side of the head (marked R) is depicted on the left side of the figure; L left side of the head)
Related posts:


Stay updated, free articles. Join our Telegram channel
Full access? Get Clinical Tree
