Invasive Diagnostic Work-up
The first steps carried out in the investigation of an individual are the taking of a comprehensive history and a physical–neurologic examination. To establish a diagnosis of hydrocephalus, by definition there must be ventricle expansion. It is not possible to diagnose normal pressure hydrocephalus (NPH) using computed tomography (CT) or nuclear magnetic resonance imaging (MRI) alone.1,2,3 According to Børgesen et al,4 as well as Tans and Poortvliet,5 the size of the ventricle does not correlate with the pressure–volume index, flow resistance, and resting pressure. For this reason, selection of patients for shunt implantation based solely on the findings of CT should be rejected, nor can a CT cisternography6 guarantee a diagnosis of NPH. Børgesen et al7 reported the proportion of false-positive results of CT cisternography to be more than 60%.
The measurement of cerebrospinal fluid (CSF) flow speed in the cerebral aqueduct has been clinically evaluated using functional MRI (fMRI).8 Using the two-dimensional phase-contrast technique, it was possible to demonstrate that a CSF flow rate of more than 24.5 mL/min was correlated with NPH with a specificity of 95%. However, this noninvasive method of investigation had the disadvantage of having a low sensitivity (i.e., 46%), so too many false-negative results were obtained. Other noninvasive diagnostic methods, such as single-photon emission tomography (SPECT), positron emission tomography (PET), and xenon CT9 can be helpful in the assessment of the course of the disease, but not in diagnostic investigation.
8.1 Intracranial Pressure Monitoring
In the first description of the clinical picture of NPH,10 a lumbar CSF pressure of 180 to 200 mm H2O was described. However, the single or multiple measurement of CSF pressure by means of a lumbar puncture has only historical significance, because it varies greatly throughout the course of the day, not only interindividually but also individually. Therefore, a short-term intracranial pressure (ICP) measurement is not effective as a diagnostic method.
Various flow diagrams used for the diagnostic investigation of NPH11,12 include the analysis and assessment of the ICP signal following long-term measurement over at least 24 to 48 hours, and also 72 hours. There are ICP waves in addition to the pulse and breathing waves: the A-waves, the B-waves, and the C-waves. Oscillations of the ICP with a frequency of 0.5 to 3/min and amplitudes of less than a few mm Hg up to more than 50 mm Hg are referred to as B-waves. Gaab et al13 distinguished B-waves from the sinusoidal type, which are physiologic and appear during sleep, as well as B-waves from the ramp type, which are considered to be pathologic. Increased B-wave activity during continuous ICP measurement is judged by some authors to be a pathognomonic sign of NPH and should correlate with a good result following shunt implantation. Kosteljanetz14 reported false-positive results during continuous ICP measurement. In 66% of his patients he found B-waves, and in 31% he found an increase in resistance in the subsequent infusion test. A total of 28% of patients had both B-waves and pathologically increased flow resistance, and 38% of patients with B-waves had no increased flow resistance.
Brean and Eide15,16 reported increased ICP pulse amplitude during sleep at night in 90% of the patients with NPH. In addition, during the lumbar infusion test, there was an increase in ICP pulse amplitudes in patients with NPH. Both authors15,16 postulated that increased ICP pulse amplitudes (quantification of pulsatility: Qpulse) have a higher predictive value for a shunt operation than the flow resistance (Rout) measured in the lumbar infusion test. Pfisterer et al17 favored continuous intraventricular ICP measurement with the detection of B-waves (more than 50%). In the event of suspect findings (B-waves: 10–50%), the same authors recommended using the lumbar cerebrospinal tap test. A noninvasive measurement of ICP using otoacoustic emissions was favored by Frank et al18; however, use of this method has not prevailed in clinical practice.
In the guidelines for the management of idiopathic NPH (iNPH) of the Japanese Neurosurgery Society19 and the guidelines of the U.S. iNPH Study Group,20 ICP monitoring and B-wave analysis take a secondary position in the diagnostic chain of iNPH and are described with class III evidence.
8.2 Lumbar Infusion Test
In the infusion test, the ICP is measured during an infusion of artificial CSF. The flow is applied against the ICP. The slope of the regression line is an expression of conductance, and the reciprocal value is resistance.21,22 The principle of the constant-rate infusion test is the infusion of artificial CSF in the lumbar subarachnoid space or in a lateral ventricle. The volume is injected with the aid of an infusion pump at a constant rate between 0.76 and 2 mL/min. The increase in pressure that is provoked is continuously registered and, after achieving the new steady state, the infusion is discontinued. In the condition of the newly set plateau, one can assume that the reabsorption rate is equal to the infusion rate. In the procedure of Katzman and Hussey,23 one needs between 90 and 120 minutes for the investigation, because it takes about 40 to 60 minutes to achieve the plateau. In contrast to the conventional infusion test, the dynamic infusion test of Meier et al24,25 does not require a balanced state to calculate the parameter described; using regression analysis, it is calculated from a comparison of the increasing and decreasing sides of the pressure curve.
The literature about positive predictors in the infusion test was reviewed and it was concluded that a high resistance (Rout >12.5 mm Hg/mL/min), a sensitivity of 98.5%, and a specificity of 62% is achieved and should be considered to have a value of 86%, in total, as a predictor. The sensitivity of CSF dynamics studies has been reported with values between 56% and 100%, as well as specificity between 50% and 90% in various publications with more than 30 patients.26 Kahlon et al27 report that the infusion test has an 80% positive predictive value (PPV), whereby false negatives of up to 16% are possible.
8.2.1 Outflow Resistance
Outflow resistance Rout (Torr/mL/min) is a measure of pressure decrease following a bolus injection. Outflow resistance is calculated according to the Hagen–Poiseuille law. CSF flow Q (mL/min) is proportional to the pressure gradient (delta) p between the subarachnoid space (po) and the sinus sagittalis superior (pss) (dp = po – pss) and is inversely proportional to the frictional resistance R, which arises at the arachnoidal villi and partly in the subarachnoid space as well as other bottlenecks in the CSF28:
 (1)
(1)
Together with the measurement of ICP, the determination of flow resistance is the most important parameter in the analysis of the pathologic processes of CSF dynamics. By calculating outflow resistance, the quantitative extent of a disruption of reabsorption or disruption of the passage of CSF can be determined. ICP increases with increasing outflow resistance and this correlation is nonlinear, according to the investigations of Børgesen et al.29,30 The correlation expresses a reduction in the rate of CSF production with increasing ICP. Tychmanowicz et al31 observed a nonlinear change in resistance during an increase in ICP in animal experiments. With low rates of infusion, resistance showed its greatest increase, and, with higher rates of infusion and an increase in plateau pressure, lower outflow resistance was observed (▶ Table 8.1).
Study | Normal value of Rout (mm Hg/mL/min) |
Boon et al42 | <18 |
Børgesen and Gjerris45 | <12 |
Ekstedt40 | <6.6 |
Fuhrmeister28 | <3.8 |
Kahlon et al27 | <14 |
<13 | |
Shapiro et al41 | <2.8 |
Sklar74 | <10 |
Tans and Poortvliet47 | <13 |
Because of the invasive method of investigation used, the normal values for outflow resistance have been obtained almost exclusively in the context of diagnostic clarification in patients who have suspected disturbances of CSF dynamics. A factor that has received little attention up to now in the determination of resistance has been the influence of pressure in the sinus sagittalis superior. Mostly, it has been assumed that sinus pressure is constant when there is an increase in ICP.32,33,34,35,36 In animal experiments, Love et al37 observed an increase in pressure in the sinus sagittalis superior with increasing ICP. This increase in pressure can, in their opinion, be traced back to a collapse of the veins. For this reason, the values measured for resistance are too great because in the calculation, the resistance of the veins must have an influence. In the method of calculation of Meier et al,38,39 the sinus pressure is indirectly expressed in the nonlinear course of outflow resistance R(p). The normal values for outflow resistance of Ekstedt,40 Fuhrmeister,28 as well as Shapiro et al,41 dating from 1978, 1985, and 1980, respectively, are too low. These must be revised on the basis of contemporary literature, so that the standard of assessment of Boon et al,42 Kahlon et al,27 as well as Meier et al,43,44 which correlate with the investigation results of Børgesen and Gjerris,45,46 as well as Tans and Poortvliet,47 are confirmed. At the same time, it should be noted that the high normal values for outflow resistance Rout, as described by Boon et al,42 do indeed have a high PPV, but they also have a high negative predictive value. In this way, too many patients with iNPH in the initial stage will be excluded.
The measurement of outflow resistance can be carried out using the isotope dilution method,48 the constant-rate infusion test,23,49 the perfusion method,50,51 or the bolus injection method.22,52 The bolus injection method of Marmarou et al53 is a technically simple procedure, but the mathematical equation is complicated and the threshold values given in the literature are too imprecise for a safe assessment of CSF dynamics.13 The bolus-shaped intrathecal injection of a small volume results in a short-term increase in ICP. After that, there is an exponential decline in pressure. The peak pressure must exceed the resting pressure and the injection amount must be greater than the rate of CSF formation.49 Using this method, there are numerous sources of error, as linear conditions are assumed, in other words, constant values for resistance and compliance.13,49,54 Comparisons between the bolus injection method and the infusion methods have resulted in the realization that only a small correlation exists between the outflow resistance values obtained.4,36,55,56,57,58 The values measured with the bolus injection method were generally below those achieved with the infusion methods. For this reason, the infusion tests were used, in which either the rate of infusion (constant-flow technique) or the pressure in the craniospinal system (constant-pressure technique) were kept constant.23,28,59,60,61,62,63 The outflow resistance was calculated from the quotients between the pressure achieved by the infusion, the constant remaining pressure (steady state pressure pss) minus the starting pressure to the infusion rate (IInf).13
So-called “gold standard” outflow resistance method of calculation is
 (2)
(2)
This method of calculation, which is also considered to be noncontentious at the international level, is used as the so-called “gold standard.” Schmidt et al64 examined the reliability and reproducibility of the ventricular or the lumbar infusion tests and the lumboventricular perfusion test. According to their results, there is a good correlation between the two test procedures. The authors emphasized the validity of the measurement of outflow resistance in the diagnostic process for disorders of CSF dynamics.
8.2.2 Calculation Procedure
In 1970, Katzman and Hussey23 described the basis for the calculation of outflow resistance after carrying out an intrathecal infusion test. In 1972, Marmarou and Shulman65 extended this method of investigation by introducing the bolus test for the determination of pressure–volume characteristics and compliance. Of all the methods of investigating CSF dynamics, the infusion test possesses the best prerequisites for further development. The signal used in the infusion test corresponds to the step function used in the technical field for system analysis. The fact that with the aid of the infusion test only a value for resistance R is determined is, however, not satisfactory. The pressure course per unit time p(t) provoked in the infusion test clearly shows the influence of the craniospinal capacity C(p), as a result of the delayed pressure response, known from the bolus test.
Starting from the model concept of CSF dynamics proposed by Marmarou et al,52,66 comprising constant resistance and a restricted pressure-dependent capacity, a new method of calculation for the infusion test was derived from a more precise interpretation of the modified model. The model of CSF dynamics according to Meier et al43,44,67 is characterized by two decisive changes in relation to the models known up to that time. Thus, taking into account the independence of pressure from the mathematical precepts of the two system components C(p) and R(p) results in a significantly more flexible model concept. Our own conceptual model incorporates the known model of Marmarou et al22,52 as a special case of craniospinal pressure dynamics. At the same time, the function of capacity C(p) adopts any desired constant nonlinear course as a function of pressure. It is not limited—as in the model known up to now—by the predefined function C = 1/(k × p). Consequently, difficulties in interpretation dependent on the method, as in the bolus test, can be avoided. The second change is produced by a reduction in the number of unknown parameters in the model. Sinus pressure is not neglected in this model, but is a part of the function R(p)54 (▶ Fig. 8.1).
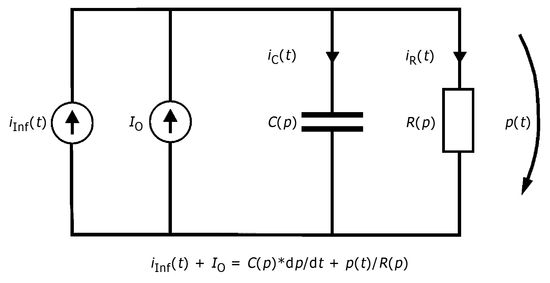
CSF dynamics are essentially determined by the influence of compliance C and the outflow resistance Rout.53,59,60,68 At the same time, an increase in pressure can have an influence on these two parameters. One cause of this is the elasticity of biologic tissues.66,69 Therefore, compliance is greatly dependent on pressure.70 In pathologic cases, outflow resistance also shows characteristic changes as a function of pressure p.54 The basis for determining the functions C(p) and R(p) is the well-known infusion test used in constant-flow technology.14 In our method of calculation, similar to the methods of calculation referred to above, the total pressure course p(t) observed over time t is processed during and after the infusion. All formulae for calculating C(p) and R(p) are derived from a comparison of the increase in pressure An(p) (positive slope) during the infusion and the decrease Ab(p) (negative slope) after the infusion at the same pressure level (▶ Fig. 8.2).
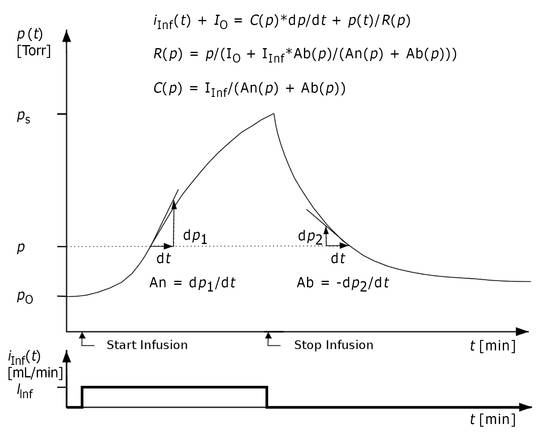
Fig. 8.2 Investigation method for the infusion test. Ab = negative slope; An = positive slope.43,44,66
The intrathecal applied infusion rate iInf(t) can be divided into two separate currents, ir(t) and ic(t). It can in one part, ir(t), flow out or be reabsorbed and, in the other, ic(t), be stored in the spaces into which the CSF flows. The same applies to CSF production Io, which is, at the same time, assumed to be constant.
 (3)
(3)
The rate of storage ic(t) or the change in volume in the store per unit time, dv/dt, is determined by the compliance C(p) of the store and the temporal change in pressure dp/dt.
 (4)
(4)
The rate of outflow ir(t) depends on the respective pressure p(t) and outflow resistance R(p).
 (5)
(5)
By substituting these values into Eq. ▶ (3), one obtains a mathematical model for the CSF dynamics as a nonlinear, first-order differential equation.
 (6)
(6)
Here we sought for two parameter functions C(p) and R(p). For this purpose, we need to find two independent differential equations based on the model formulation [Eq. ▶ (6)]. For the infusion test, this can be achieved readily. At the same time, the first differential equation [Eq. ▶ (7)] describes the positive slope in the positive curve [positive slope (p) = dp/dt] during the infusion with a constant rate of infusion iInf (t) = IInf. The second differential equation [Eq. ▶ (8)] is characterized by the declining pressure course [negative slope (p) = –dp/dt] following the infusion with iInf (t) = 0.
 (7)
(7)
 (8)
(8)
After differentiation of Eqs. ▶ (7) and ▶ (8), one obtains the basis for the calculation of compliance C(p). At the same time, this also applies to the proof of the independence of both differential equations from one another. Eq. ▶ (7) – Eq. ▶ (8)
 (9)
(9)
In accordance with the formulae for the equivalence of equations, the two equations are equivalent only if the left and the right terms of the second equation are expanded in relation to the first additive by an identical term T on both sides. Because T1 is not equal to T2, it follows that the two differential equations are independent. The terms of the functions we are looking for, R(p) and C(p), can be deduced from the following transformation:
 (10)
(10)
To determine the outflow resistance R(p), Eq. ▶ (10) is used in Eq. ▶ (8).
 (11)
(11)
 (12)
(12)
In this way, a nonlinear, first-order differential equation is appropriate for describing CSF dynamics as a model. This contains two functions: outflow resistance R(p) and compliance C(p). In contrast to the models of Marmarou et al,52,66 Shulman et al,71 and Charlton et al,68 intradural sinus pressure does not appear in the model equation presented here [Eq. ▶ (6)]. However, its influence is indirectly expressed in the nonlinear course of the outflow resistance R(p). As a result of the model concept selected, the outflow resistance is understood as being the sum of all successive CSF passage and reabsorption resistances. Likewise, compliance should be viewed as being the ability to expand all CSF spaces that can be reached from the investigation site.
The first-order differential equation can only describe an increasing pressure course p(t) during a constant flow infusion. In contrast, on discontinuation of an infusion, a declining pressure course should be verified. There is a simple method for smoothing the time function p(t). The time series of the discontinuously recorded pressure course p(t) is sorted according to the pressure value during the infusion in the ascending and, after the infusion, descending sequence. In this way, variations in pressure that can be caused by movements of the patient are adequately smoothed.54
Using the assumption that the outflow resistance (p) in the vicinity of p0 does not differ significantly from R(p0) = p0/I0, it is possible to calculate the rate of production of CSF (I0). In Eq. ▶ (12), R(p) is used for the ratio p0/I0. By transforming to I0, one obtains an equation for calculating CSF production. Naturally, this only applies to the pressure p near the resting pressure p0.
 (13)
(13)
Because of the aid assumption, discussed above, this relationship should be used only when close to the resting pressure. Another problem is the high sensitivity of Eq. (7) close to the resting pressure p0. Therefore, it is appropriate to determine the rate of production of CSF before the actual infusion using an additional test. As a result of a defined volume intake –ΔV by the patient, the pressure –Δp is reduced below the resting pressure p0. Because hardly any reabsorption takes place below the resting pressure, one can disregard the reabsorption rate IR in relation to the store rate Ic and set I0 = Ic.53
 (14)
(14)
From the relationship of the volume intake –ΔV to the fast reduction in pressure –Δp and the subsequent temporally slow increase again to dp/dt, the CSF production can now be determined. After determining CSF production I0 in Eq. ▶ (14) and logic control with the calculated value in Eq. (7), the function outflow resistance R(p) can be calculated using Eq. ▶ (12). When in doubt, for CSF production, Eq. ▶ (14) can be used for calculating outflow resistance (▶ Fig. 8.3).
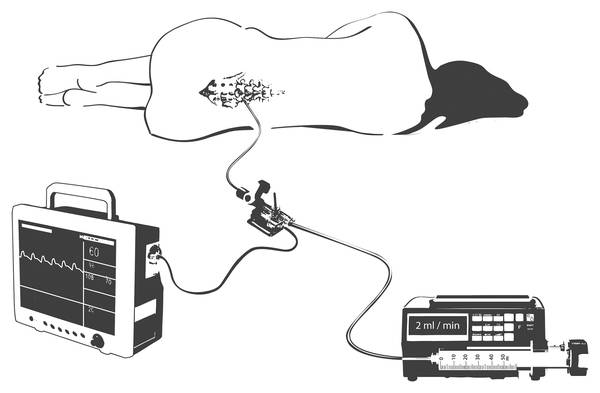
Fig. 8.3 Lumbar infusion test.
Related posts:


Stay updated, free articles. Join our Telegram channel

Full access? Get Clinical Tree


