Fig. 22.1
CT-negative SAH. Left side MRI (FLAIR): hyperintense signal clearly visible; right side CT scan: no sign for SAH
22.2 Laboratory Diagnostic Methods
There are several widely used CSF analyses for SAH with different diagnostic performance, availability, and technical requirements. The laboratory diagnostic methods were reviewed recently (Tumani et al. 2010; Nagy et al. 2013).
22.2.1 Visual Inspection
The most basic CSF method for SAH is the visual evaluation of discoloration. For this, the sample is usually centrifuged and the supernatant compared with a tube of water, held against a well-illuminated white background. Normal CSF is uncolored and transparent. After an SAH, a yellowish or reddish tint is seen due to bilirubin (called xanthochromia) or oxyhaemoglobin. However, the sensitivity of the human colour vision is not sufficient to detect a very small amount of bilirubin, which may appear as transparent as water (Petzold et al. 2005; Sidman et al. 2005).
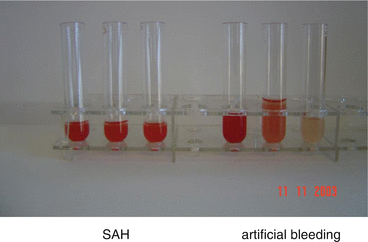
A traumatic tap may occur when the needle punctuates a blood vessel. This might be differentiated by the three-tube method – visual inspection or cell count in serial tubes, to detect declining red blood cell counts, indicating a traumatic tap – but especially in the very early phase of a bleeding, this might not always be helpful for the differentiation (Fig. 22.2 and Table 22.1).


Fig. 22.2
Three-tube method
Table 22.1
Differentiation artificial versus SAH
SAH | Artificial | |
|---|---|---|
3 tubes | All reddish | Clear in the last tube |
Cytology | Macrophages | No macrophages |
Cell-free CSF | Xanthochromia | Clear |
Ferritin | >15 ng/ml | <15 ng/ml |
Spectrophotometer | Pos. | Neg. |
22.2.2 Spectrophotometry
More reliable than visual inspection is the spectrophotometry. By this the absorption of bilirubin can be quantified and documented, so that an objective rating of xanthochromia is possible (Petzold et al. 2004, 2006).
It is a rapid (<1 min) technique that requires a small sample amount (50–500 μL). Because sensitivity and specificity vary for different markers that may be elevated depending on the duration since symptom onset, the laboratory technician must know the time point of symptom debut, sampling, and centrifugation to perform a sound interpretation (Table 22.2).
Table 22.2
Time series of different CSF finding after subarachnoid haemorrhage
<12 h | 12 h to 3 days | >3 days | |
|---|---|---|---|
Pleocytosis | +++ | ++ | + |
Erythrocytes | +++ | ++ | + |
Oxy-Hb | + | +++ | + |
Erythrophages | + | ++ | |
Bilirubin | (+) | ++ | +++ |
Siderophages | + | ++ | |
Ferritin | + | ++ | +++ |
Haematoidin crystals | (+) | ++ |
22.2.3 Oxyhaemoglobin
After an SAH, the erythrocytes in the CSF will gradually lyse and release their intracellular haemoglobin. This process starts shortly (2–4 h) after the bleeding, and oxyhaemoglobin can be detected in CSF from approximately 2–12 h after ictus (Cruickshank 2001). Oxyhaemoglobin, the oxygenated form of haemoglobin, has an absorbance maximum around 415 nm, in the violet region of the optical spectrum.
22.2.4 Bilirubin
Oxyhaemoglobin is metabolized to bilirubin through enzymatic reactions by macrophages in vivo. This does not occur in vitro in tapped CSF (except in samples with very high white blood cell count), which strongly reduces the risk for false-positive results caused by a traumatic tapping. Bilirubin has a broad maximum absorption peak in the blue region of the optical spectrum at 450–460 nm (Petzold et al. 2006). As an alternative to using a spectrophotometer, CSF (Shah and Edlow 2002) bilirubin may also be measured by the modification of the direct diazo methods used for bilirubin measurements in serum or plasma. But difficulties regarding technical analyses and method standardization may hinder a broad implementation of this tentative approach (Beetham et al. 2006).
22.2.5 Methaemoglobin
Methaemoglobin is haemoglobin with ferric (Fe 3+) instead of ferrous iron (Fe 2+) in the haem group, with a broad absorbance maximum peak at 403–410 nm. Normally, methaemoglobin is present in very small amounts, but it has been reported in CSF of patients with subdural haematoma or an enclosed bleeding, giving the CSF a brownish colour (Barrows et al. 1955). A spontaneous oxidation of the haem group occurs around 10 days after a bleed, irrespective of cause (Wahlgren and Lindquist 1987), which may be useful to distinguish between a traumatic tap and a cerebral haemorrhage (Trbojevic-Cepe et al. 1992).
Stay updated, free articles. Join our Telegram channel

Full access? Get Clinical Tree


