Advantages
Disadvantages
Excellent soft tissue contrast
Some contraindications
Flexible “contrast” (information)
Relatively slow and expensive
Good spatial resolution
Limited availability
No ionising radiation
Unintuitive artefacts
Allows multi-planar imaging
Lacks specificity
4.3 Where Does the MRI Signal Come From?
In order to understand how different types of MR images are formed, it is first important to have an appreciation of where the MR signal originates. In this section we give an overview of the main components that an MRI scanner requires and how these relate to the various processes that are crucial for detecting an MR signal.
4.3.1 Components of an MRI Scanner
The main components that make up a MRI scanner (see Fig. 4.1) are:
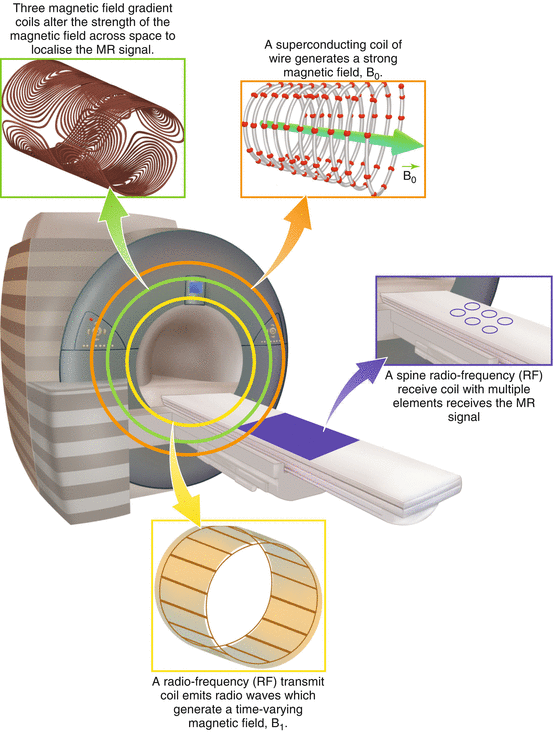

Fig. 4.1
Main components of an MRI scanner
A strong magnet (usually superconducting): this creates a large uniform magnetic field (B 0). For standard cylindrical MRI scanners, B 0 points along the axis of the cylinder. By convention this is labelled the “z” direction. For clinical MRI scanners, B 0 is typically 1.5 or 3 tesla (abbreviated to T), which is tens of thousands of times stronger than the earth’s magnetic field.
A transmit radio-frequency (RF) coil: this allows radio waves to be transmitted into the subject, creating a time-varying magnetic field (B 1). A large “body” transmit coil is built into the main body of most scanners.
A receive radio-frequency (RF) coil: this measures the MR signal from the subject and is often composed of a series of individual elements (a “multichannel” coil). Modern scanners provide a broad selection of receive coils that are tailored to the anatomy of interest.
Gradient coils: these three coils create variations in the main magnetic field in three different directions, which are necessary for signal localisation (described in Sect. 4.5.1). Gradients are built into the main body of the scanner.
As the reader will see, these components of the MRI scanner hardware relate closely to the processes that underlie different aspects of MRI image formation (outlined in Sect. 4.3.2).
For spinal imaging a specific spine RF receive coil is often used (Fig. 4.1). This coil is sometimes built into the subject table of the scanner to allow imaging of the spine whilst the subject lies in a supine position. This coil generally consists of an ensemble of small elements, each of which provides high sensitivity to a small region and which in combination allow a large region of the spine to be imaged. Because the received signal is much stronger in regions of the body close to the coil, clear visualisation of anterior tissues often requires an additional coil array on top of the patient to obtain high signal in both anterior and posterior regions.
4.3.2 Processes Underlying MRI
There are a number of basic processes that occur to allow the measurement of the MR signal. These processes are summarised here and shown graphically in Fig. 4.2.
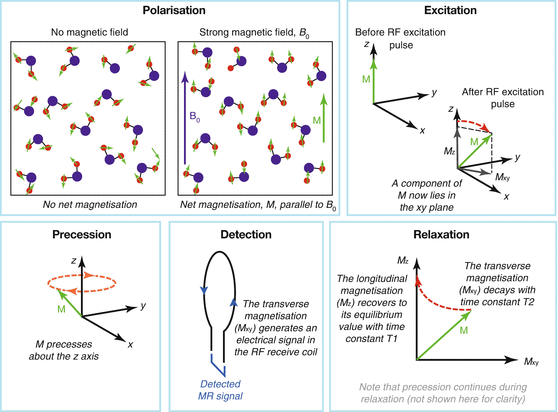

Fig. 4.2
Processes involved in MRI
Polarisation – The main magnetic field (B 0) “magnetises” the hydrogen nuclei of water molecules within the subject. Each hydrogen nucleus is magnetic, like a tiny bar magnet or compass needle. In the absence of an external magnetic field, these nuclei are randomly oriented (pointing in random directions) so their effects average out to result in no net magnetic field. However, just like a compass needle, when the hydrogen nuclei are brought into the strong B 0 field, they tend to line up with it, creating a net magnetisation, which we call M, pointing in the same direction as B 0. It is this magnetisation, M, that we measure in MRI. Note that hydrogen nuclei present in non-water sources are also magnetised, but they tend to produce very little MR signal, so we shall focus largely on the water signal in this chapter. One important exception is fat, which is discussed in Sects. 4.5.2.2 and 4.6.4.
Excitation – The transmit radio-frequency (RF) coil creates a time-varying magnetic field (B 1) which “excites” the magnetisation. This means that M is rotated away from its normal orientation (aligned with B 0). The result is that M now has some component within the plane at right angles to B 0: the “transverse” plane. Excitation is crucial, because only components of M within the transverse plane are measureable (see “Detection”).
Precession – Once the magnetisation, M, has been excited it begins to “precess” or rotate about B 0, in the same manner that a gyroscope precesses when knocked off its axis. The rate of this precession is proportional to the strength of B 0.
Detection – The precessing magnetisation is detected by the radio-frequency (RF) receive coil, which has been tuned to the precession frequency. Magnetisation precessing near the RF coil induces an electrical signal that can be recorded. The strength of this signal is proportional to the size of the M within the transverse plane.
Relaxation – After the magnetisation has been excited, there is a strong force driving the magnetisation to reorient itself to its preferred position aligned with B 0. However, this process is not simply a reversal of excitation in which the magnetisation rotates back into alignment with B 0. Instead, relaxation is composed of two (somewhat) independent processes: the component of the magnetisation in the transverse plane disappears faster than the component aligned with B 0 (the “longitudinal” magnetisation) regrows. This leads to a temporary loss of magnetisation that recovers over time in a process called “relaxation”. The loss of transverse magnetisation is characterised by time T2, whilst regrowth of longitudinal magnetisation takes characteristic time T1, with T2<<T1. An example of relaxation following a 90° RF excitation pulse is given in Fig. 4.3.
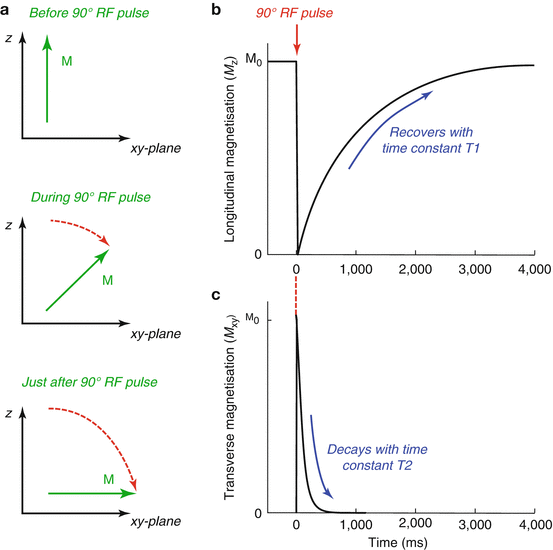
Fig. 4.3
Relaxation processes following a 90° RF excitation pulse: (a) The magnetisation, M, is initially aligned with B 0 (along z) before being rotated through 90° into the transverse (xy) plane by the RF pulse; (b) After the RF pulse (at time 0), the longitudinal (z) component of the magnetisation is zero, but recovers back towards its equilibrium value (M 0) with time constant T1; (c) The transverse (xy) magnetisation created by the RF pulse decays to zero with time constant T2. For this simulation we assumed T1 = 1 s and T2 = 100 ms
Some important terminology
x, y and z: The main magnetic field, B 0, creates a coordinate system for our MR experiments. B 0 points along the longitudinal axis, which is labelled “z” by convention. The plane at right angles to B 0 is the transverse, or “xy”, plane. MRI involves manipulating the magnetisation in this 3D coordinate frame. Depending on the direction of the magnetisation, it will have some longitudinal component (M z ) and some transverse component (M xy ), and only M xy generates the MR signal. In general x, y and z are the left-right, anterior-posterior and inferior-superior directions, respectively.
Flip angle: This is the angle between the z axis and the magnetisation at the end of the RF excitation pulse. It is determined by the strength of the B 1 field and its duration.
Resonance frequency: The precession frequency of the magnetisation is also referred to as the “resonance” frequency. At common field strengths (e.g. 1.5–3 T), this is in the radio-frequency (RF) range. A RF pulse must be tuned to this frequency in order to excite the magnetisation. The received MR signal produced by the precessing magnetisation is also at this frequency, which is why we need both RF transmit and RF receive coils in MRI.
4.3.3 What Is a Pulse Sequence?
Whilst the main magnetic field (B 0) is static (i.e. remains on at all times), the RF transmit and gradient magnetic fields are manipulated during an MRI scan with precise control on the order of microseconds. This prescription of carefully timed RF transmit, gradient and signal detection events constitute a “pulse sequence” that is designed to generate the desired MRI signal.
As we will see, the precise gradient waveforms determine the spatial extent and resolution of the image. Image contrast is largely determined by the excitation flip angle and timing parameters. Two of the most important timing parameters (shown in Fig. 4.4) are:


Fig. 4.4
A schematic of a simple pulse sequence showing the repetition time, TR, and the echo time, TE
The repetition time, TR: the time between one excitation RF pulse and the next
The echo time, TE: the time between the RF excitation pulse and the point at which the signal is recorded
In the next section we shall explore how these pulse sequence timing parameters and tissue relaxation properties can be utilised to generate contrast between different types of tissue with MRI.
4.4 Basic Image Contrasts: T1, T2, T2* and Proton Density
4.4.1 What Influences Image Contrast?
The ability to distinguish between different tissue types within an image is dependent on there being large signal differences, or high contrast, between them. One of the keys to the excellent soft tissue contrast in MRI is that different tissues have different relaxation properties (i.e. T1 and T2 differ between tissues). In addition, some tissues have a greater concentration of water than others, leading to a higher density of hydrogen nuclei (protons), resulting in higher signal. These properties form the basis of the basic image contrasts in MRI. Examples of T1-weighted, T2-weighted and proton density (PD)-weighted images are shown in Fig. 4.5.
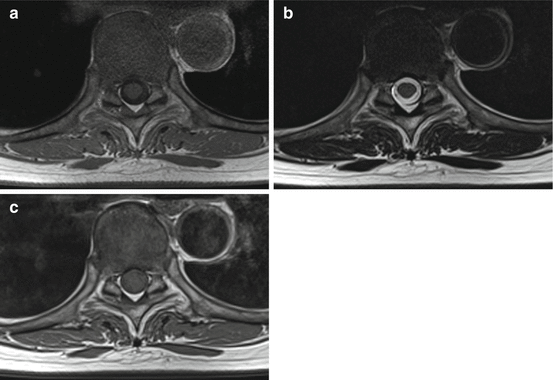

Fig. 4.5
Typical spinal images with (a) T1 weighting, (b) T2 weighting and (c) proton density weighting
The weighting between these three factors can be adjusted relatively simply by modifying the timing of the image acquisition. In this section we discuss how contrast due to T1, T2 or proton density can be isolated and maximised. We will also describe T2* weighting, which is closely related to T2 weighting.
4.4.2 T1 Weighting
As discussed above, after excitation the longitudinal magnetisation, M z , recovers back to its equilibrium position with characteristic “time constant” T1. Tissues with a short T1 recover back to equilibrium quickly, whilst those with a long T1 recover more slowly. Regions with a liquid composition, such as those containing cerebrospinal fluid (CSF), tend to have longer T1 values than areas that are more solid or fatty, such as white matter.
Achieving contrast between tissues based on T1 poses a challenge, given that T1 is a property of the z magnetisation, but only the x-y component of the magnetisation can be directly observed. However, let us consider what happens if we do not allow the magnetisation to fully recover back to its equilibrium location before applying another RF excitation pulse (i.e. if the repetition time, TR, is short relative to T1). Tissues with a short T1 recover more quickly and will therefore have a greater longitudinal magnetisation just before the next RF excitation pulse. This means that when the longitudinal magnetisation is rotated into the transverse plane, tissues with a short T1 will produce a greater amount of transverse magnetisation and therefore a greater signal than tissues with a long T1. By modifying the TR, we have generated contrast between two tissues with different T1 values, resulting in a “T1-weighted” image. This is illustrated in Fig. 4.6. It is worth noting that these images will also be influenced by proton density, although in most situations T1 weighting will dominate.
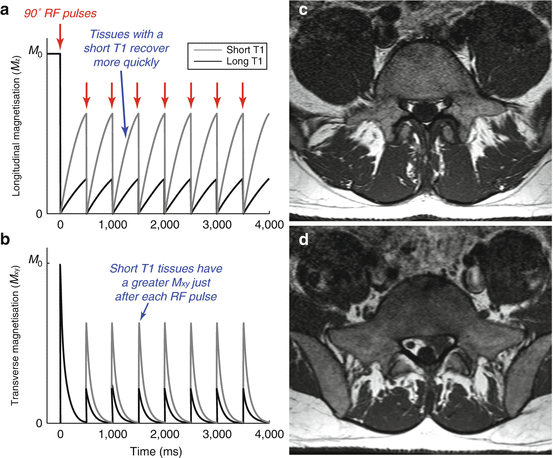

Fig. 4.6
Producing T1 weighting using a short TR: Here we simulate two tissues, one with a short T1 (0.5 s, grey) and one with a long T1 (2 s, black), during a pulse sequence with a relatively short TR period (0.5 s) so that the magnetisation cannot fully recover to its equilibrium position; (a) the longitudinal magnetisation of the tissue with a short T1 recovers more fully just prior to the next RF pulse (shown with red arrows); (b) As a result the transverse magnetisation produced by the excitation RF pulse is greater for the tissue with a short T1, resulting in a higher signal from that tissue. Note that this is not the case for the first RF pulse but the first few pulses are often ignored to allow the signal to reach a stable “steady state”. Here we have used a RF excitation flip angle of 90° for simplicity, but in practice lower flip angles are commonly used to optimise the signal strength produced from this kind of pulse sequence; (c) An axial T1-weighted image of the lumbar spine, where the hyperintense fat signal allows us to discriminate between the lumbar dural sac and the nerval roots in the lumbar recesses; (d) Left-sided disc herniation, clearly visible in this T1-weighted image, compresses the left nerve root in the lateral recess
Aside: spoiling
Any transverse magnetisation remaining just prior to the next RF excitation pulse can interfere with signals in subsequent TR periods. Therefore, most pulse sequences using a short TR utilise a technique called spoiling. This process attempts to destroy any residual transverse magnetisation just before the next RF pulse is played out, preventing this interference from occurring.
4.4.3 T2 Weighting
Just as the TR changes the T1 weighting, the T2 weighting is controlled by the time between the excitation and signal acquisition: the echo time (TE). Figure 4.7 shows that the transverse magnetisation, and therefore the signal, decays from the tissue with a short T2 more rapidly than the signal from the tissue with a long T2. Therefore, using a longer TE introduces contrast based on differences in T2. This contrast can be optimised by picking a TE that maximises the signal difference between the two tissue types.
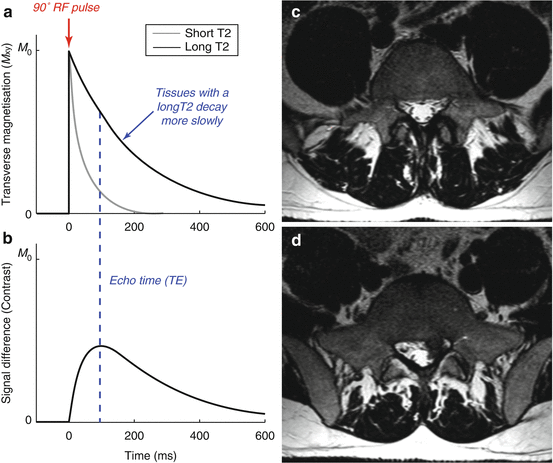

Fig. 4.7
Producing T2 weighting using a long TE: (a) Again, we simulate two tissues, one with a short T2 (50 ms, grey) and one with a long T2 (200 ms, black), during a pulse sequence with a relatively long TE (100 ms). During the long echo time, the transverse magnetisation of the tissue with a short T2 decays rapidly, giving only a small signal. The transverse magnetisation of the tissue with a long T2 decays much more slowly, yielding a higher signal. (b) The signal difference, or contrast, between the two tissues varies over time. By picking the correct echo time we have maximised the contrast between these two tissues. Note that we assume here that the TR period is long relative to the T1 values of these tissues so the longitudinal magnetisation has fully recovered before the next RF excitation pulse. (c) Axial T2-weighted images corresponding to the T1-weighted images in Fig. 4.6. The nerve roots within the dural sac and in the lateral recesses are well delineated as dark spots. The disc herniation in (d) shows low signal intensity due to reduced water content
Again, introducing a relatively simple change in the pulse sequence timing allows us to generate contrast between different tissue types based on their relaxation properties. However, as for T1-weighted images, the proton density will also influence the signal strength in T2-weighted images.
It is worth noting that a T2-weighted image often appears to have inverted contrast compared to a T1-weighted image (i.e. a region with a high intensity on a T2-weighted image often has a low intensity on a T1-weighted image). This is because tissues with a long T1 often have a long T2 as well. This gives high signal in a T2-weighted image since the signal decays more slowly, but in T1-weighted images the longitudinal magnetisation does not recover quickly during the short TR period and therefore produces a low signal.
4.4.4 Proton Density Weighting
In some cases it is advantageous to generate images that isolate proton density as contrast, rather than being weighted by T1 or T2. We already know from the discussions above that using a long TR allows the longitudinal magnetisation to recover fully, irrespective of the T1, and therefore minimises T1 weighting. In addition, using a short TE prevents the signal from decaying significantly before it is measured, thereby minimising T2 weighting. Therefore, images acquired with a long TR and short TE are only weighted by water content or proton density.
Proton density (PD)-weighted images of the spine are used differently to those in cerebral imaging: PD is not used to differentiate the grey and white matter structures of the spinal cord due to the insufficient contrast of these very small structures, but it is advantageous for depicting soft tissue structures like ligaments and intervertebral discs.
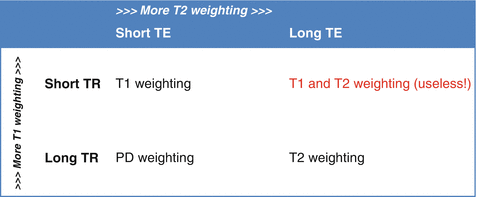
Table 4.2
Relationships between TR, TE and the resulting image contrast

The relationships between TR, TE and the type of image contrast obtained are summarised in Table 4.2.
4.4.5 T2* Weighting
We have seen above that after excitation, the transverse magnetisation decays with time constant T2. However, this is not the whole story. If there is any unevenness (inhomogeneity) in the main magnetic field (B 0), then this causes the magnetisation at different positions to precess at slightly different frequencies. As a result, the transverse magnetisation at different positions no longer adds together to give a strong, coherent signal, but begins to partially cancel out or “dephase” (Fig. 4.8). The result is that the signal decays more quickly than would be expected from T2 alone. This faster decay occurs with a time constant T2*, which is always less than T2.
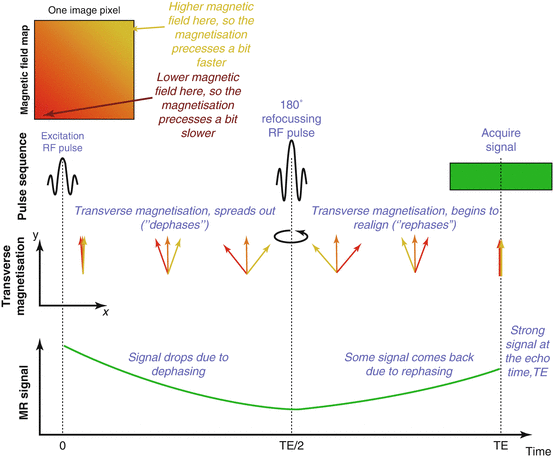

Fig. 4.8
Dephasing due to an inhomogeneous magnetic field and rephasing with a spin-echo refocusing pulse: Within one pixel of an image there is some variation in the magnetic field strength, causing the magnetisation at different locations to precess at slightly different frequencies. After excitation the transverse magnetisation begins to spread out (dephase). Some of the transverse magnetisation partially cancels out, leading to loss of signal. Note that we do not show precession due to B 0 here for clarity. A 180° refocusing pulse flips (mirrors) the magnetisation, so that it then begins to realign, leading to a strong coherent signal at the echo time, TE (a spin echo). Note that there is still some inherent T2 decay that cannot be recovered using a spin echo
Why isn’t the magnetic field uniform?
Unevenness, or inhomogeneity, in the magnetic field can come from a number of sources. When the subject is placed in the scanner, this distorts the main magnetic field, leading to large-scale inhomogeneity. Most scanners attempt to correct for this using a process known as “shimming”, but the results are never perfect. In addition, such inhomogeneity can be present at the microscopic level due to the presence of certain substances that distort the magnetic field, such as deoxyhaemoglobin in blood vessels.
This signal loss or dephasing can be reversed by the addition of a 180° RF pulse between the excitation RF pulse and the signal acquisition. This refocuses the dephased magnetisation and forms what is known as a “spin echo”. In spin-echo pulse sequences the signal is therefore observed to decay with time constant T2, whereas in gradient echo sequences, where no 180° refocusing pulse is used, the signal decays more quickly, with time constant T2* (Fig. 4.9). Gradient echo sequences with a long TE are therefore said to have T2* weighting.
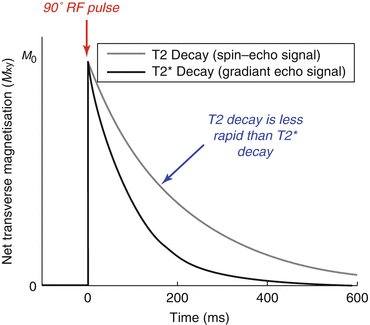

Fig. 4.9
T2* decay: The signal decays more rapidly than would be expected due to T2 alone because of inhomogeneities in the magnetic field, giving a shorter apparent time constant T2*. In this simulation we assume T2 = 200 ms and T2* = 100 ms
In some cases this additional signal loss can give useful contrast between otherwise similar tissues. For example, the build-up of blood products in the tissue reduces the T2*, making images with T2* weighting ideally suited to identifying haemorrhage. T2*-weighted sequences also better differentiate bony structures from disc materials compared to T2-weighted sequences, as the low signal of bone contrasts well with the hyperintense discs. Some previous reports reveal that T2*-weighted images are superior to T2-weighted images for detecting spinal cord lesions, even at 3 T, and provide good contrast between grey and white matter. However, T2*-weighted sequences suffer from artefacts in regions of strong magnetic field inhomogeneity, as discussed in Sect. 4.5.2.1. These artefacts can simulate lesions and result in overestimation of osteophytes.
One method for reducing these artefacts involves acquiring signals at multiple echo times after each excitation RF pulse. Combining the images obtained from each echo results in relatively high SNR images with reduced artefacts whilst retaining good tissue contrast (Fig. 4.10). These sequences are sometimes referred to as Multi-Echo Data Image Combination (MEDIC) or Multiple Echo Recombined Gradient Echo (MERGE).
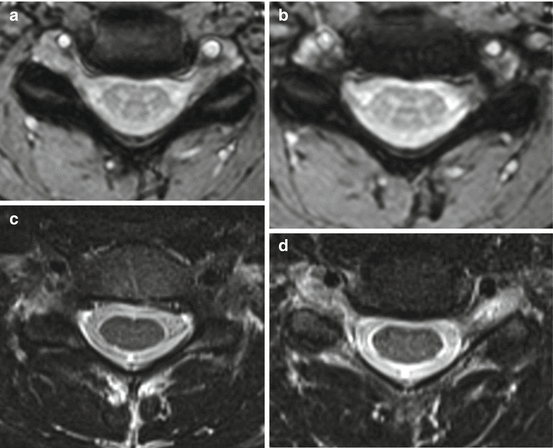

Fig. 4.10
Axial images (a, b) of the cervical spine showing high grey-white matter contrast produced by a multi-echo (MEDIC) sequence, which is not present in the T2-weighted images (c, d). Note the signal loss of bony structures in the MEDIC sequence
4.4.6 Measures of Image Quality: Signal and Contrast-to-Noise Ratios
Given the variety of different methods for generating images with MRI, it is useful to have measures of image quality to allow an objective comparison to be made. One important feature of medical images is the “noise level”. Noise is the random error in an image, which reflects how robust the underlying signal is and is generally reflected in how grainy or speckled an image appears. Noise in images can obscure important features, rendering them non-diagnostic. Measurement of noise is therefore useful in judging image quality.
Where does “noise” in MR images come from?
Noise or random fluctuations in the signal arise from two main sources in MR images. Thermal noise arises from the actual heat (i.e. resistance) of the patient’s body and/or electronics, which adds to the currents detected by the RF coil. Physiological processes such as cardiac or respiratory pulsation also lead to pseudorandom fluctuations referred to as “physiological noise”.
One common metric of image quality is signal-to-noise ratio (SNR). SNR is defined as the mean signal strength within a defined region of interest divided by the standard deviation of the noise. High SNR is desirable since it implies that the signal dominates over the noise, resulting in clear images.
Signal-to-noise ratio definition

The main factors that affect the SNR are:
Main magnetic field strength (B 0 ): As discussed in Sect. 4.3.2, the main magnetic field causes the water molecules to “polarise” or line up in the same direction, resulting in the net magnetisation that we measure with MRI. The stronger the main magnetic field, the greater this polarising effect is, resulting in a higher net magnetisation and therefore an increased SNR.
RF receive coil: RF receive coils are more sensitive to regions of the body which are close to them. Therefore, placing the receive coil as close to the region of interest as possible will increase the signal and therefore improve the SNR. In addition, coils that cover a large volume tend to pick up more noise, reducing the SNR. Using a series of smaller coil elements together can provide the SNR benefit of using a smaller coil with the better coverage of a larger coil. Note that these “multichannel” or “phased-array” coils can be hard to distinguish from single-channel coils since the individual elements are often concealed within casing.
Pulse sequence timing: As discussed above, the timing of the pulse sequence can alter the measured signal strength and therefore the SNR. For example, using a long TE to generate T2 weighting means that the signal decays to a greater degree, resulting in lower signal strength and thus a lower SNR.
Voxel volume: A voxel is a three-dimensional (3D) pixel, which is typically visualised as a single point in an image. As its name suggests, however, voxels are characterised by a 3D volume. For example, if the in-plane resolution is 2 × 2 mm with slice thickness 5 mm, the voxel volume is 2 × 2 × 5 = 20 mm3. The higher the voxel volume, the more water molecules contribute to the signal in that voxel, giving a stronger signal and therefore higher SNR. This is one of the factors that limits the maximum achievable spatial resolution in MRI.
Bandwidth: When magnetic field gradients are used in MRI to localise the signals (see Sect. 4.5.1), they cause the magnetisation at different locations to precess at different frequencies. The measured MR signal is a combination of these different frequencies, and the range of frequencies is known as the bandwidth. Because there is approximately an equal amount of noise at each frequency, using a higher bandwidth allows more noise to enter into the measurement, reducing the SNR.
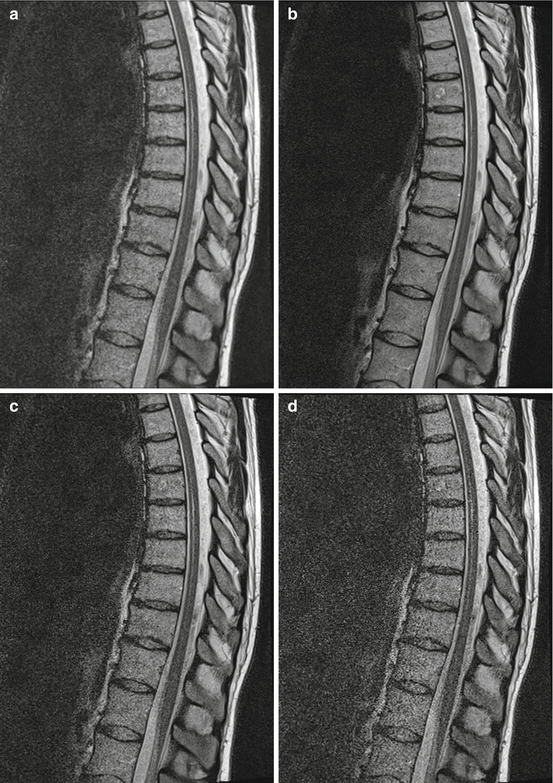
Signal averaging: If the same image is acquired multiple times and then averaged, this tends to boost the SNR. This is because the noise in each image is random and so tends to be reduced by averaging, whereas the true signal is constant, so is reinforced by the averaging process. However, averaging only increases SNR with the square root of the number of averages (so averaging two repeats only increases SNR by √2 = 1.414).
Images with different SNR values but constant contrast are shown in Fig. 4.11. Very low SNR values mean that the anatomy and detail in the image are very difficult to discern. However, beyond a certain point, the information required from the image is clear, so increasing the SNR further may not provide any further advantage.

