Chapter 20 Measuring health and illness
The measurement of health and illness has become increasingly important as doctors, health service agencies and governments try to assess the effectiveness of treatments and the performance of health services. However, measuring health and illness can be problematic.
Mortality
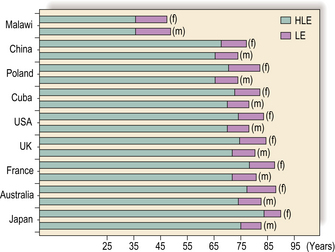
All births and deaths in developed, and in many developing, countries are legally required to be registered so that, together with census data, accurate counts can be made of birth and death rates, and of population change. Mortality rates, particularly infant and maternal mortality rates, are often used as proxy measures of a country’s health and development (see pp. 158–159). Life expectancy also provides a summary measure of health in an area or country, and Figure 1 summarizes overall life expectancy and healthy life expectancy (Box 1) for selected countries.
Box 1 Definition
Healthy life expectancy: the average number of years that a person can expect to live in ‘full health’, taking into account ‘years lived in less than full health due to disease and/or injury’. See http://www.who.int/whosis/indicators/2007HALE0/en/ for details and methods of estimation.
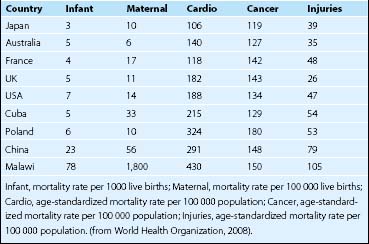
Cause-specific death rates are also useful. Cause of death is entered on death certificates and then coded using the International Statistical Classification of Diseases and Health Related Problems (ICD-10). Table 1 gives details of a selection of death rates for selected countries.
Standardized mortality ratios (SMRs) (Box 2) are commonly used to compare deaths for specific subgroups in a population. An SMR of 100 indicates that observed deaths equals the expected number of deaths (average mortality). An SMR > 100 indicates that observed deaths exceed expected deaths, and an SMR < 100 indicates that observed deaths are lower than expected deaths. SMRs are useful summary indicators of mortality in a subpopulation or specific social group, and social scientists have used SMRs particularly to investigate social inequalities in health (see pp. 44–45).
Box 2 Standardized mortality ratio (SMR)
∗ which would have occurred if the study population had experienced the same mortality as the reference population, allowing for age and sex differences.
Figure 2 shows that suicide between 1996 and 2002 has increased in the most deprived areas of Scotland from an SMR of < 140 to an SMR of > 160 relative to the average in Scotland (SMR = 100), whereas in areas of least deprivation it has reduced from an SMR of > 60 to an SMR of < 60.
Stay updated, free articles. Join our Telegram channel

Full access? Get Clinical Tree


