Fig. 11.1
The application of cyclic tensile strain induced apoptotic cell death in spinal cord cells. Representative serial photomicrographs are shown of cells exposed to a tensile strain of 10 % strain at 0.5 Hz at 0, 6, 24, and 48 h (a, b). The number of green-stained living cells decreased (a: top row) while the number of red-strained dead cells increased (b: middle row) in a time-dependent manner during cyclic tensile strain application. Transmission electron microscopy (TEM) examination (c: bottom row): all cells at 0 h appeared viable, with large nuclei, and dotted with chromatin and abundant rough endoplasmic reticulum; some cells at 6 h showed deformity of nuclei and cytoplasm. TEM at 24 h showed some cells with condensed and fragmented nuclei and condensed chromatin, and the change progressed at 48 h (c: bottom row). Bar = 100 μm (a, b), 50 μm (c) (Reprinted, with permission, from [20])
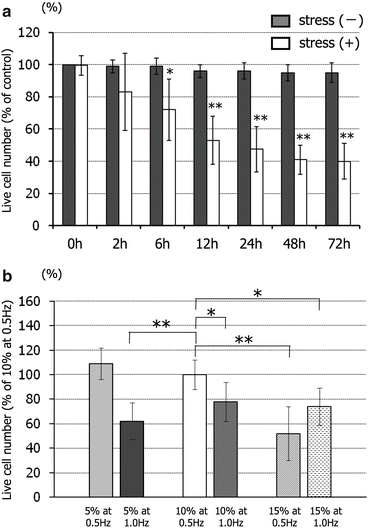
The cell survival rate of cultures under cyclic strain decreased from 83 ± 24 % at 2 h to 40 ± 11 % at 72 h (Fig. 11.2a), becoming significant after 6 h. Figure 11.2b shows that increasing the strain rate independently of the strain level was associated with increased spinal cord cell death. Conversely, the cell survival rate in cultures subjected to a 15 % strain level at a frequency of 0.5 Hz was also significantly lower than that seen at the standard level. Therefore, increasing the strain level independently of the strain rate was also associated with increased spinal cord cell death.


Fig. 11.2
The survival rate of spinal cord cells was dependent on the level, frequency, and duration of the applied tensile strain. The survival rate (%) of living cells during the application of a standardized cyclic tensile strain (10 %, 0.5 Hz) compared with stress-free baseline (a). Gray bar, stress-free condition; white bar, cyclic tensile strain condition. The survival rate (%) of living cells after 6 h at three different strain levels of 5 %, 10 %, and 15 % and two different strain frequencies of 0.5 and 1 Hz compared with that at the standardized strain level of 10 % at 0.5 Hz frequency (b). Data are expressed as mean ± SEM of six experiments. *P < 0.05, **P < 0.01 (Reprinted, with permission, from [20])
11.1.2 Cluster Analysis of Gene Expression Profiles
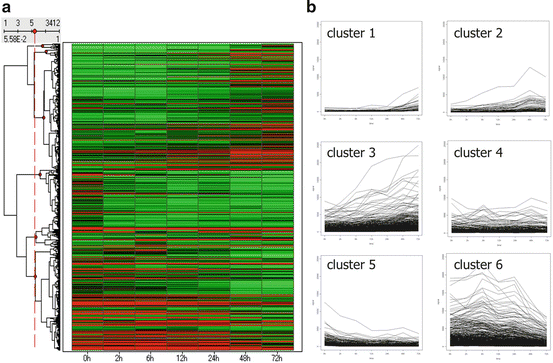
There was altered expression of 3,412 genes after the application of a cyclic tensile strain of 10 % at 0.5 Hz during 72 h, which were profiled using hierarchical cluster analysis in a time course manner and divided into six clusters (Fig. 11.3). Genes of clusters 1, 2, and 3 were upregulated in a time-dependent manner; those of cluster 4 were upregulated in a time-independent manner. Genes of clusters 5 and 6 were downregulated in a time-dependent manner.


Fig. 11.3
Gene expression profiles in spinal cord cells after the application of cyclic tensile stress. The hierarchical clustering data are presented graphically as a heatmap (a). These genes were subsequently grouped into six subclusters (clusters 1–6) according to the time course of gene expression pattern (b) (Reprinted, with permission, from [20])
11.1.3 Identification of Upregulated Genes Through Gene Ontology Analysis
Based on the results of clustering analysis, we tested the genes by all GO terms and identified the upregulated genes related to cyclic tensile strain among clusters 1, 2, and 3. Forty-four genes related to “apoptosis” were expressed in the early phase (cluster 3), whereas 17 genes related to “response to stimulus” were expressed in the late phase (cluster 1).
11.1.4 Identification of Upregulated Genes Using Kyoto Encyclopedia of Genes and Genomes Analysis
We tested the genes by all Kyoto Encyclopedia of Genes and Genomes (KEGG) terms in clusters 1, 2, and 3 including those upregulated in a time-dependent manner. Four pathways were significantly included in cluster 1, 3 pathways in cluster 2, and 24 pathways in cluster 3.
11.1.5 Gene-Specific Real-Time Reverse Transcription Polymerase Chain Reaction (Rt-Pcr) in Mapk Signaling Pathway
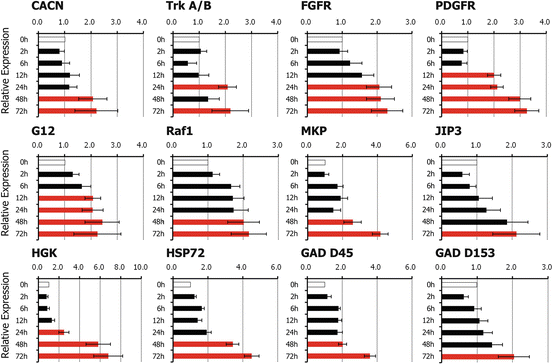
In further examination of KEGG analysis of cluster 3, which included many of the upregulated genes, we found that the MAPK signaling pathway contained 12 candidate genes among the 15 genes that were significantly upregulated. These genes were calcium channel voltage-dependent L-type alpha-1F subunit (Cacnalf or CACN), neurotrophic tyrosine kinase receptor type 2 (Ntrk2 or trkA/B), fibroblast growth factor receptor 2 (Fgfr2 or FGFR), platelet-derived growth factor receptor, beta polypeptide (Pdgfrb or PDGFR), v-raf-leukemia viral oncogene 1 (Raf1 or Raf), guanine nucleotide binding protein (G protein) gamma 12 (Gng12 or G12), dual-specificity phosphatase 1 (Dusp1 or MKP), mitogen-activated protein kinase kinase kinase kinase 4 (Map4k4 or HGK), mitogen-activated protein kinase 8 interacting protein 3 (Mapk8ip3 or JIP3), heat shock protein 72 (Hspa 72 or HSP72), growth arrest and DNA-damage-inducible alpha (Gadd45a or GAD D45), and DNA-damage-inducible transcript 3 (Ddit3 or GAD D153). These 12 genes were identified to test differential expression using real-time RT-PCR analysis. The mRNA expression levels of PDGFR and G12 significantly increased from the mid period of application of cyclic tensile stress (12-h stress duration), while CACN, trkA/B, FGFR, Raf1, MKP, HGK, JIP3, HSP72, GAD D45, and GAD D153 mRNA expression levels increased during the late phase of cyclic tensile strain (24–72 h duration) (Fig. 11.4).


Fig. 11.4
The effects of cyclic tensile stress on gene expression levels analyzed by real-time RT-PCR. Application of cyclic tensile stress resulted in significant increases in mRNA expression levels of platelet-derived growth factor receptor (PDGFR), guanine nucleotide binding protein gamma 12 (G12) at 12 h, neurotrophic tyrosine kinase receptor type 2 (trkA/B), fibroblast growth factor receptor (FGFR), mitogen-activated protein kinase kinase kinase kinase 4 (HGK) at 24 h, and calcium channel voltage-dependent L-type alpha-1F subunit (CACN), v-raf-leukemia viral oncogene 1 (Raf1), dual-specificity phosphatase 1 (MKP), mitogen-activated protein kinase 8 interacting protein 3 (JIP3), heat shock protein 72 (HSP72), DNA-damage-inducible alpha (GAD D45), and DNA-damage-inducible transcript 3 (GAD D153) at 48–72 h. Red bars indicate significant differences (P < 0.05) in upregulation at least twofold in comparison to controls. Data are mean ± SEM of three experiments (Reprinted, with permission, from [20])
11.2 Discussion
In vitro systems offer several advantages over in vivo systems in the analysis of cellular responses to their mechanical environment. By precisely controlling the loading conditions, the quantitative relationship between the severity of mechanical injury and response to the injury can be evaluated [21]. The physiological strain conditions of neuronal cells are not as high as other cells [22], showing ischemic changes at 11 % strain [23], but not at a 6 % strain level [24]. PC12 cells were subjected to cyclic tensile strain levels ranging from 4 to 16 % at strain frequencies of 1–2 Hz as physiological mechanical conditions [22]. Based on these reports and considering primary cultured spinal cord cells [19], we selected the range of cyclic tensile strain most appropriate to our culture system in the present study. Our results suggest that both the level of strain applied and frequency of its application influence cell viability. Furthermore, the results demonstrate that a higher strain level at a lower strain rate can have a similar effect as a lower strain level at a higher strain rate in neuron-rich spinal cord cells.
Stay updated, free articles. Join our Telegram channel

Full access? Get Clinical Tree


