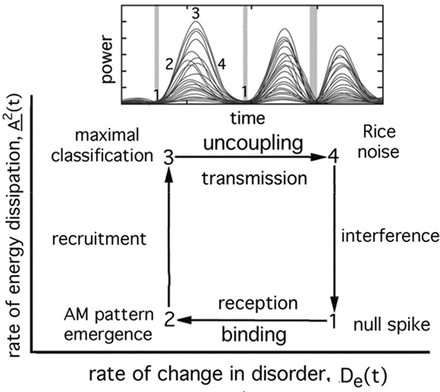
Fig. 1
64 superimposed band pass filtered ECoGs
In this review we focus on the process by which brains use sensory information (I) to create fragments of knowledge (K) in each sensory modality. The fragments have the same form in all modalities. They are integrated into Gestalts on transmission through the entorhinal cortex in the limbic system. We model the action-perception cycle as a thermodynamic process, because it far transcends neural networks in depending on neural mass action, and because cortices use metabolic energy at rates far exceeding those of any other tissue [6]. Sadi Carnot (1796–1832) founded thermodynamics by conceiving a cycle that incorporated the variables of pressure, volume mass, and temperature with the gas laws that interrelated them. He did this by defining the four variables, fixing mass and temperature, and graphing pressure-volume relation as an isocline, fixing temperature at another value, and calculating a new isocline. Rudolf Clausius (1822–1888) generalized the model by replacing pressure with energy and volume with entropy. Macquorn Rankine (1820–1872) extended the cycle to include gas-liquid phase transitions. We follow their lead by replacing three thermodynamic state variables with three measurable variables in neurodynamics: energy by ECoG power in frequency bands in the beta-gamma range; rate of negentropy by AM pattern stationarity (implying stability) as measured by rates of movement along trajectories in high-dimensional measurement space; and temperature by neural interaction strengths that we deduce by modeling neural activity patterns with K-sets [1, 5].
2 Methods
Square arrays of 64 electrodes were implanted on the surfaces of sensory cortices (visual, auditory, somatic, olfactory) or scalp of subjects (cats, rabbits, humans) giving windows ranging in size from 5 × 5 mm to the whole head. Subjects were trained in simple sensory discrimination tasks by reinforcement learning. Sets of 64 EEGs and ECoGs were recorded in blocks of 40 6-s trials, band pass filtered, and transformed to analytic amplitude and phase by the Hilbert transform. A moving window was stepped across the arrays of 64 channels by which AM patterns (given by 8 × 8 values of analytic amplitude at each step) were extracted from signals recorded from reinforced trials (CS+), unreinforced trials (CS-) as well as control trials (CS0). Each AM pattern was expressed as a 64 × 1 feature vector, A(t), giving a point in 64-space. Similar AM patterns projected in 2-space gave clusters of points. AM patterns were inferred to carry knowledge when the significance of correct classification with respect to behaviors gave values of p < 0.01 consistently in a given trial set [1].
3 Results
Bursts were extracted using band pass filters (Fig. 1). The temporal FFT was used to identify the temporal locations of beta-gamma bursts having high power, which were deemed likely to carry information yielding classifiable AM patterns. The Hilbert transform was used to calculate 64 analytic amplitudes, Ax(t), where x = 1, …, 64 (Fig. 2), which were squared to get analytic power). The range between high and low power in the window often exceeded two orders of magnitude, so the measurements were displayed as log10 power (Fig. 3) in the beta or gamma pass band at each step. The log10 mean amplitude squared estimated the ECoG power, A 2(t) in the narrow band of each wave carrier frequency. The analytic phase was unwrapped and converted to successive differences. Dividing each phase difference in radians by the digitizing step (2 ms) gave estimates of the analytic frequency, ω(t) in radians/s (Fig. 4).
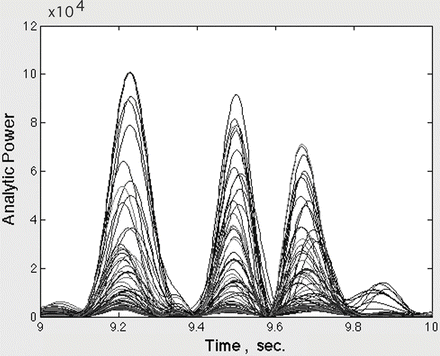
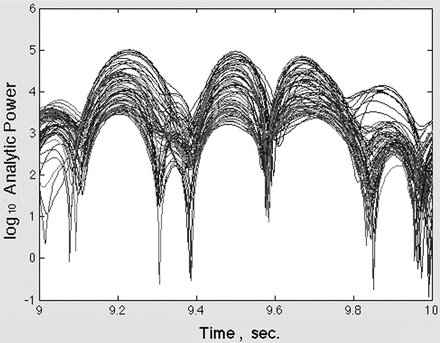
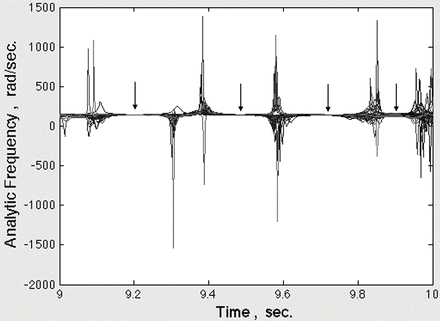

Fig. 2
Band pass filtering imposes beats in A2(t)

Fig. 3
Log10 A2(t) shows time location of beats in band pass filtered ECoG due to frequency dispersion [1]

Fig. 4
The extremes show frequency indeterminacy. Arrows are at minima in spatial variance of frequency.
The feature vector of normalized amplitudes, A(t)/A(t) (spatial mean amplitude at each step) gave the AM pattern expressed as a point in 64-space. The Euclidean distance between successive points in 64-space divided by the digitizing step gave the rate of change in AM pattern, De(t). In background chaotic ECoG the values of De(t) varied widely and unpredictably. A burst with high values of power, A 2(t), gave an unbroken sequence of low values of De(t) revealing stationarity of an AM pattern (Fig. 5). The persistence of a stationary AM pattern increased the certainty with each digitizing step that the AM pattern manifested an attractor that expressed a fragment of knowledge as a memory.
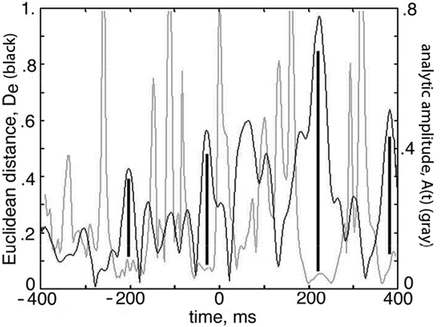

Fig. 5
De(t) (grey) varied inversely with A2(t) (black). Bars show bursts >3 cycles of gamma oscillation
We verified this conjecture by collecting sets of AM patterns and classifying them with respect to CSs. The optimal measure of AM patterns for classification was the pragmatic information, He(t) (Fig. 6).
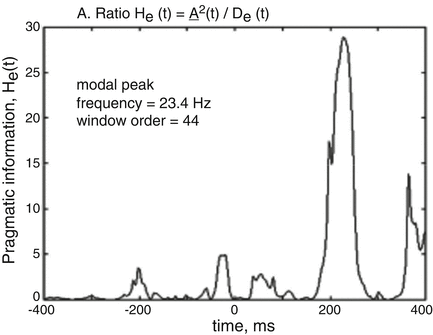

Fig. 6
Pragmatic information, He(t), at peak values gave optimal behavioral AM pattern classification [1]
Alternatively expressed, the product of the minimal rate of reduction in entropy, which we estimated by calculating 1/De(t), and the maximal rate of dissipated energy (power He, max(t)) in each burst gave the pragmatic information. Carnot used the area in each cycle to estimate the work done in each cycle. We used the product (corresponding to the area of the 1,234 rectangle, Fig. 7) to index the amount of knowledge in each burst [1].
