Fig. 8.1
(a) Transverse slab of the C5 vertebra and the spinal cord with the screw cut 3 mm in thickness, showing the deformation of the spinal cord by the unilateral compression. (b) Softex radiograph showing the position of the screw and the extent of compression
8.2.3 Measurement of Compression Rate
On the Softex radiographs of the transverse slabs of the C5 vertebrae with the screws, the areas of the protruding screws in the spinal canal and the areas of the spinal canals were measured using an image scanner and a personal computer with the software of the NIH image version 1.6. The ratio of the former to the latter was defined as “the compression rate.”
8.2.4 Measurement of Gray and White Matter Area in Each Half of the Spinal Cord
On the slide of the KB medullary sheath staining, the spinal cord was divided into the compressed half and the contralateral half by the line of anterior median fissure and the posterior median sulcus through the central canal. The areas of the gray and white matter in each half of the spinal cord were measured using the image scanner interfaced with a computer.
8.2.5 Immunohistochemistry
Immunohistostaining of the astrocyte was carried out using an antibody to GFAP (polyclonal antibody; Dako, Glostrup, Denmark). Microglia were stained with an immunoperoxidase method using a lectin Ricinus communis agglutinin (RCA-1; Vector Laboratories, Burlingame, CA, USA) according to the method described by He and colleagues [13].
8.2.6 Count of Glial Cells
To count the GFAP-positive astrocytes, ten selected sections of the anterior and dorsal horns in the gray matter and the anterior, lateral, and dorsal funiculi in the white matter on the compressed and contralateral halves were determined on the GFAP staining slide; the center of each anterior and posterior horn section was defined as the midpoint of the line between the central canal and the tip of the anterior and dorsal horns. The center of each funiculus section was defined as the midpoint of the thickness of the funiculus. The section covered an area measuring 0.21 × 0.32 mm. The density of GFAP-positive astrocytes was calculated from the number of the cells in each section. The density of GFAP-positive astrocytes in the gray matter was defined as the average of the densities in the anterior and dorsal horns. The density of GFAP-positive astrocytes in the white matter was defined as the average of the densities in the anterior, lateral, and dorsal funiculi.
8.3 Results
The compression rate was defined by the ratio of the area of the protruding screw in the spinal canal to the area of the spinal canal. The compression rate was 17.1 ± 3.7 % (mean ± SD) in the mild compression group and 31.8 ± 3.2 % in the moderate compression group. The difference in the rate between the mild compression and moderate compression was considered extremely significant by unpaired t-test (p < 0.0001).
No apparent abnormal walking or movements of the upper and lower limbs were observed during the observation period of 1 week after surgery in rabbit (Tarlov rate 4).
8.3.1 Morphologic Change
In these animals, the spinal cord was deformed into the shape of a reversed comma. The compressed half of the spinal cord was shaped like a boomerang and the contralateral half like a semicircle. The midline of the spinal cord, connecting the anterior median fissure to the posterior median sulcus through the central canal, was curved convexly to the contralateral half. The anterior funiculus and the anterior horn were flattened in the compressed half (Fig. 8.2).


Fig. 8.2
The spinal cord was deformed into the shape of a reversed comma. The compressed half of the spinal cord was shaped like a boomerang and the contralateral half like a semicircle. The midline of the spinal cord, connecting the anterior median fissure to the posterior median sulcus through the central canal, was curved convexly to the contralateral half. (a) Under mild compression and (b) under moderate compression (Kluver-Barrera, ×10)
8.3.2 Area of Gray Matter and White Matter in Compressed Half and Contralateral Half
The area of each half of the spinal cord is shown in Table 8.1. The areas of both halves with moderate compression were significantly smaller than those in the sham animals (p < 0.001), as were those associated with mild compression (p < 0.01). Comparisons between the compressed and contralateral halves revealed no significant differences in surface areas following mild compression, whereas there were significant differences with moderate compression (p < 0.05).
Table 8.1
Area and ratio of the gray matter to the white matter area (gray/white matter) under the compression (mean ± SEM)
Compressed half | Contralateral half | |||
|---|---|---|---|---|
Area | Gray/white matter | Area | Gray/white matter | |
Shama | 5.89 ± 0.17 | 0.30 ± 0.02 | ||
Mild compression | 5.06 ± 0.22 | 0.27 ± 0.02 | 5.29 ± 0.21 | 0.25 ± 0.01 |
Moderate compression | 3.75 ± 0.31b, c, e | 0.23 ± 0.03 | 4.32 ± 0.24b, d | 0.24 ± 0.01 |
To analyze the reductions in the gray vs. white matter, the ratio of the gray matter to the white matter (gray/white matter) was calculated. However, via this approach, no significant differences in the ratios between the compressed and contralateral halves were found.
8.3.3 Astrocyte Response
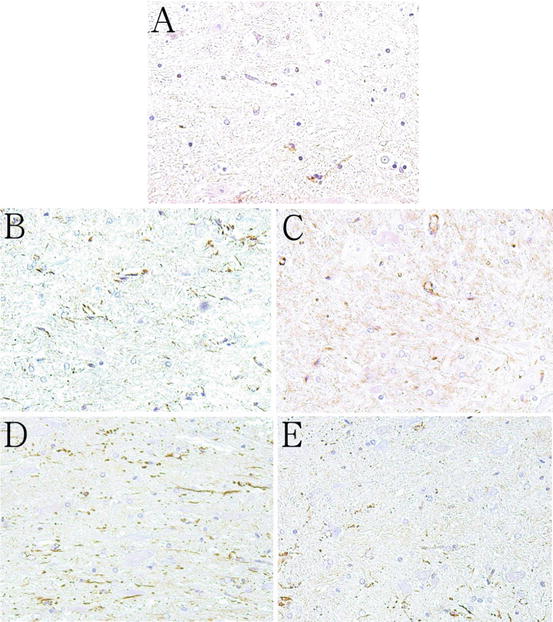
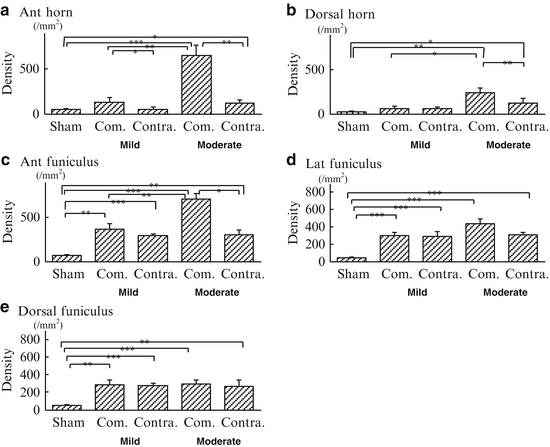
The densities of GFAP-positive astrocytes of both halves under the moderate compression were significantly higher than those in sham animals (p < 0.001 in the compressed half, p < 0.05 in the contralateral half) (Fig. 8.3). The GFAP-positive glial density in the compressed half with moderate compression was significantly higher than seen with mild compression (p < 0.01). Comparisons between the compressed and contralateral halves revealed that compressed half contained significantly higher GFAP-positive glial density than the contralateral half following either mild or moderate compression (p < 0.05, p < 0.01, respectively). As the compression increased, the density of GFAP-positive astrocytes increased markedly in the anterior horn of the compressed half (Fig. 8.4a).


Fig. 8.3
Compared with the sham animals (a), extensive proliferation of GFAP-positive astrocytes in the anterior horn was seen in the compressed half (b) and the contralateral half (c) with mild compression and in the compressed half (d) and contralateral half (e) under moderate compression (GFAP stain, ×80)

Fig. 8.4
The densities of GFAP-positive astrocytes increased in the two halves of the unilaterally compressed spinal cord. The density markedly increased in the gray matter and the anterior funiculus in the compressed half (Com.) compared with the contralateral half (Contra.) according to the increase in the compression. The differences in densities at the lateral and dorsal funiculi were not significant between the two halves of the spinal cord. (a) Anterior horn. (b) Dorsal horn. (c) Anterior funiculus. (d) Lateral funiculus. (e) Posterior funiculus (***p < 0.001, **p < 0.01, *p < 0.05)
In the dorsal horn, the density of the GFAP-positive glia of both halves with moderate compression was significantly higher than those in sham animals (p < 0.01, p < 0.05, respectively). Comparison of the two halves demonstrated no significant difference with mild compression; however, the glial density of the compressed half was significantly higher than that of the contralateral side under moderate compression (p < 0.01) (Fig. 8.4b).
In the anterior funiculus, the GFAP-positive glial density in the two halves of the cord under mild and moderate compression was significantly higher than in the shams (each p < 0.01). The glial density within the compressed half under the moderate compression was significantly higher than seen with mild compression (p < 0.01). In contrast, the glial density within the contralateral half following moderate compression did not increase significantly compared to mild compression. Comparison of both halves of the spinal cord revealed no significant difference with mild compression; however, the glial density of the compressed half was markedly increased in comparison to the contralateral half following moderate compression (p < 0.05) (Fig. 8.4c).
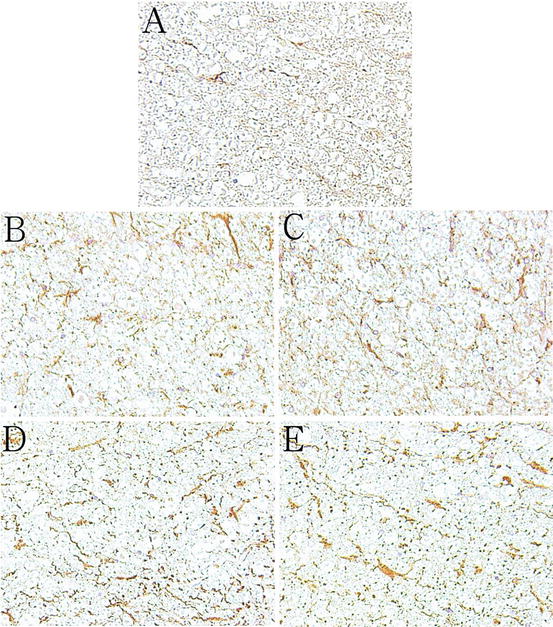
In the lateral funiculus, the GFAP-positive glial density within both halves of the spinal cord following mild and moderate compressions was significantly higher than those in the sham animals (each p < 0.005) (Fig. 8.5). Comparison of both halves of the spinal cord revealed no significant differences with the mild and moderate compression (Fig. 8.4d).


Fig. 8.5


Compared with the sham animals (a), extensive proliferations of GFAP-positive astrocytes at the lateral funiculus were seen in the compressed half (b) and the contralateral half (c) under mild compression and in the compressed half (d) and contralateral half (e) under moderate compression (GFAP stain, ×80)
Stay updated, free articles. Join our Telegram channel

Full access? Get Clinical Tree


