Fig. 9.1
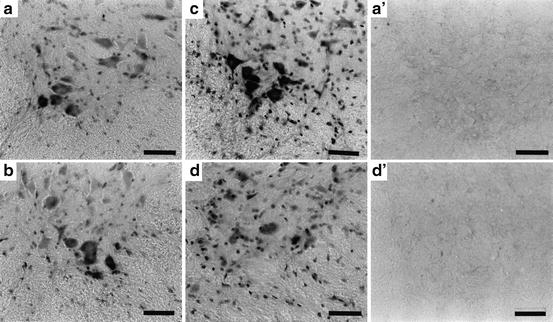
Photomicrographs showing wheat germ agglutinin-horseradish peroxidase-labeled spinal accessory motoneurons. (a) A motoneuron at C2–C3 segments in a representative control ICR mouse; (b) site A in the twy mouse, the most rostral level; (c) site B, the level immediately rostral to the compressive lesion; (d) site C, the site of mechanical compression at C2–C3 cord segments. The top side in each panel represents the dorsal aspect of the cord. Scale bar = 50 μm (Reprinted, with permission, from [7])
Table 9.1
Results of morphological measurements of neuronal soma and dendrites of the wheat germ agglutinin-horseradish peroxidase-labeled spinal accessory motoneurons in the medial cell pool of the twy and control ICR mice
Spinal cord level | Mean (SD) | ||||
|---|---|---|---|---|---|
Site Aa | Site Bb | Site Cc | Total number (SD) | ||
twy mouse (n = 30) | |||||
1. Neuron | |||||
Number | 34.7 (10.1) | 67.9 (10.5)* | 3.7 (3.2)** | 106.3 (18.1)* | |
Area of soma (μm2) | 574.0 (138.4)* | 565.9 (98.9)* | 324.4 (170.7) | 488.0 (180.2)** | |
Number of segments | 7.4 (1.1) | 7.6 (1.0) | 5.7 (1.1) | 6.9 (1.4) | |
Maximum branch order | 3.0 (0.8) | 3.1 (0.7) | 2.8 (0.7) | 3.0 (0.7) | |
Total length (μm) | 577.0 (142.5)* | 523.8 (157.8)* | 242.6 (150.8) | 242.6 (150.8) | |
Maximum branch length (μm) | 190.6 (61.5) | 183.1 (61.1) | 96.9 (50.1) | 156.9 (71.4)* | |
ICR mouse (n = 6) | |||||
1. Neuron | |||||
Number | 29.5 (12.1) | 93.7 (10.0) | 24.3 (5.5) | 145.8 (17.0) | |
Area of soma (μm2) | 529.2 (44.1) | 519.4 (46.9) | 526.3 (83.8) | 524.8 (57.5) | |
2. Dendrite | |||||
Number of segments | 7.5 (1.0) | 8.3 (0.5) | 6.2 (1.2) | 7.3 (1.3) | |
Maximum branch order | 3.2 (0.8) | 3.2 (0.8) | 3.0 (0.9) | 3.1 (0.8) | |
Total length (μm) | 531.8 (79.2) | 418.3 (1.3) | 435.6 (169.4) | 461.9 (134.0) | |
Maximum branch length (μm) | 169.3 (28.7) | 123.0 (40.7) | 118.6 (38.2) | 137.0 (41.4) | |
9.1.2 Three-Dimensional Computerized Display of Spinal Accessory Motoneurons
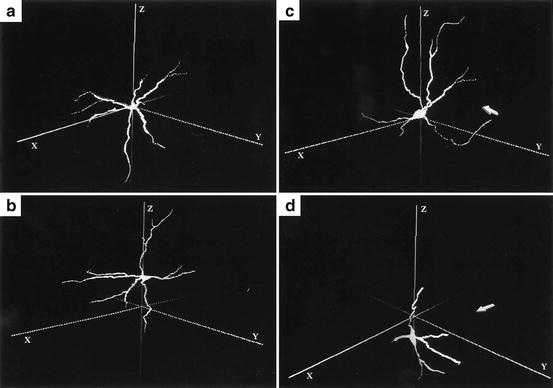
In the twy mice, at site B, the level immediately rostral to the compressive lesion, the elongated dendrites extended rostrally and ventrally as if the motoneuron avoided posterior compression (arrow, Fig. 9.2c). At site C dendrites were shorter (Fig. 9.2d)


Fig. 9.2
Three-dimensional computer display of the dendritic arborization of the wheat germ agglutinin-horseradish peroxidase-labeled spinal accessory motoneurons (abscissa lateral direction, ordinate anteroposterior direction, and z-axis longitudinal direction). The compression force is applied in the x–y plane marked by arrows in (c) and (d). (a) Motoneuron at C2–C3 segment in the control ICR mouse; (b) site A in the twy mouse, the most rostral level; (c) site B, the level immediately rostral to the compressive lesion; (d) site C, the compression level at the C2–C3 cord segments (Reprinted, with permission, from [7])
9.1.3 Localization of Brain-Derived Neurotropic Factor Immunoreactivity in the Anterior Gray Matter and Its Relationship to the Magnitude of Compression
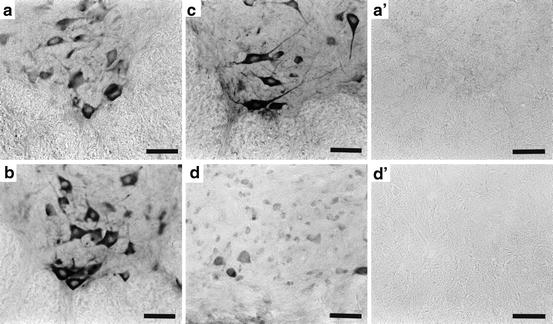
At site B, BDNF immunoreactivity in the anterior horn cells of twy mice was significantly higher than in ICR and site A in twy mice (Fig. 9.3c). More severe compression at site C (TRAS < 50 %; n = 8) correlated with increased BDNF immunoreactivity in anterior horn cells at site B. Also, more labeled non-neuronal astroglia- and microglia-like cells were detected at sites B and C.


Fig. 9.3
Photomicrographs showing localization of immunoreactivity of brain-derived neurotropic factor in the anterior gray horn of a representative ICR mouse (a) and twy mouse (b–d) with a transverse remnant area of 60 %. (b) Site A; (c) site B; (d) site C. (a′, d′) Negative controls for ICR and twy mice, respectively. Top posterior aspect of the spinal cord. Scale bars = 50 μm (Reprinted, with permission, from [7])
9.1.4 Localization of Neurotrophin-3 Immunoreactivity in the Anterior Gray Horn and Its Relationship to the Magnitude of Compression
At site B in twy mice, immunostaining for NT-3 V4 antibody was significant in the anterior horn cells, with enhanced immunoreactivity in the neuron soma and dendrites (Fig. 9.4c) compared with those seen at site A in twy and ICR mice.


