Fig. 12.1
CSF flow artifact. A 42-year-old patient with noncommunicating hydrocephalus. Axial FLAIR image through the lateral ventricles demonstrates the focal increased signal (arrowheads) within the lateral ventricles above the foramen of Monro, due to flow-related entry-slice phenomenon
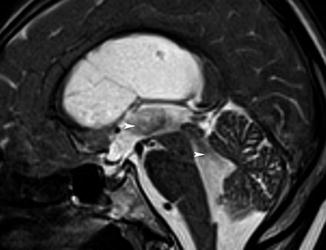
Fig. 12.2
A 65-year-old patient with normal pressure hydrocephalus. Median sagittal T2 TSE with an extensive aqueductal flow-related void sign (arrowheads)
12.3 Steady-State Free Precession (SSFP) Sequences
Using SSFP sequences, the residual transverse magnetization is conserved, participating in both the signal and the contrast. There are several variants in the family of steady-state echo gradient, according to the type of echo recorded and how the gradients are adjusted [7].
True fast imaging with steady-state precession (true FISP) with dual excitation sequences (constructive interference in steady state (CISS)) is a combination of two true FISP acquisitions, with and without excitation pulse phase alternation, to eliminate band artifacts. These sequences combine strong T2 weighting, excellent spatial resolution, and little sensitivity to CSF flow [8]. The 3D CISS allows for a multiplanar morphological analysis; its clinical value has been demonstrated for the investigation of cerebellopontine and cochleovestibular disorders [8]. With post-processing it is possible to generate volume-rendering views of intracranial CSF, allowing volumetric assessment (Fig. 12.3). The 3D CISS sequence can point to the cause of hydrocephalus and contribute to the preoperative work-up [9].
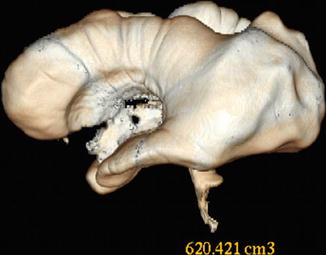

Fig. 12.3
A 37-year-old patient with noncommunicating hydrocephalus due to aqueductal stenosis. Surface reconstruction view obtained from the CISS sequence allowing the ventricular volume to be measured. The whole ventricular volume was 620 cm3
T2-enhanced SSFP sequences are flow-sensitive 3D sequences [10]. These sequences combine a strong T2 weighting with an excellent spatial resolution. By collecting a stimulated echo (PSIF echo) with an effective TE above the TR [10], the PSIF sequence is highly sensitive to the CSF flow [11]. CSF flow below 2 cm/s yields a void sign [12–14] (Fig. 12.4). This sequence has been reported to be useful for intracranial cysts detection [15] (Fig. 12.5) and endoscopic third ventriculostomy patency assessment [16].
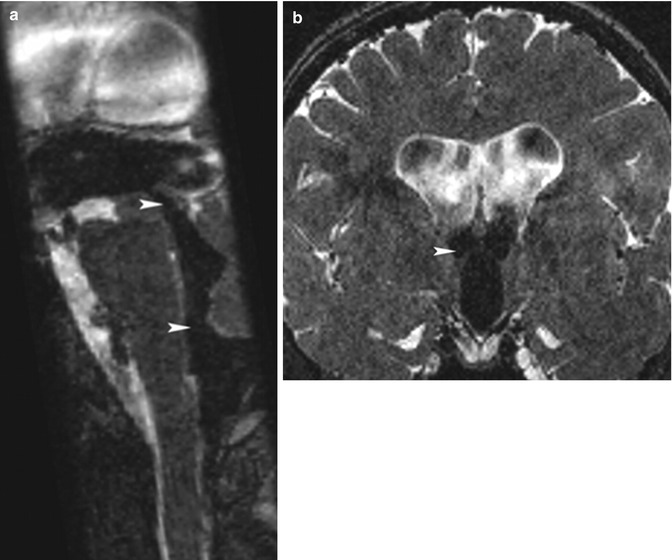
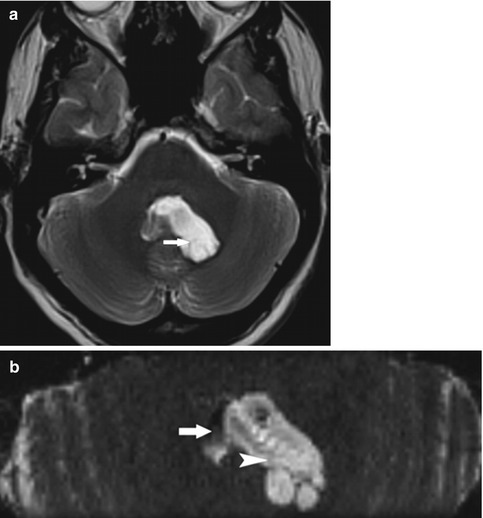

Fig. 12.4
(a) A 67-year-old patient with communicating hydrocephalus. Midsagittal PSIF sequence. Note the CSF flow in the third ventricle, the cerebral aqueduct, the fourth ventricle, and the foramen of Magendie, as shown by the flow-related void sign (arrowheads). (b) A 32-year-old patient with communicating hydrocephalus. Coronal PSIF sequence. Note the CSF flow in the third ventricle and the foramens of Monro (arrowhead) reflected by the flow-related void sign

Fig. 12.5
(a) A 23-year-old patient with intraventricular cyst. Axial T2 TSE slice showing an asymmetric enlargement of the fourth ventricle (arrow). (b) A 23-year-old patient with intraventricular cyst. Axial PSIF slice: the noncirculating intraventricular cyst (hyperintense, arrowhead) is distinguished from the residual CSF flow in the fourth ventricle (hypointense, arrow)
Balanced SSFP sequences (true FISP) use a coherent steady-state technique with a fully balanced gradient waveform to recycle transverse magnetization. Contrast is determined by the ratio of T2 to T1 rather than the inflow effect [17]. Relative to spoiled gradient echo methods, true FISP sequence has an excellent temporal resolution. This sequence allows for the detection of both the brain ventricular wall motion and the CSF flow turbulences [18, 19].
12.4 Phase-Contrast Imaging Sequences
In a constant magnetic field gradient, dephasing occurs between stationary and circulating spins [20]. By using repeated bipolar gradients, a voxelwise calculation of velocities can be determined during the cardiac cycle [21]. The measured velocities correspond to a projection of the real velocities along the direction of the velocity-encoding gradient that can be perpendicular to the slice (through-plane acquisition) or to one of the two axes defining the plane of the image slice (in-plane acquisition). Through-plane imaging provides a quantitative approach to CSF flow velocity [22], especially at the cerebral aqueduct, but only explores a limited region. In-plane imaging is time effective and covers a large region, but quantitative analysis is prevented by the partial volume effect. The CSF flow is pulsatile: Craniocaudal flow secondary to the cerebral arterial systolic wave is followed by caudocranial flow during diastole. Phase shifts should be within a range of 180° requiring a velocity encoding [23] that determines the highest and lowest detectable velocity encoded. This sequence may also have a predictive value for the surgical treatment of both communicating [22] and noncommunicating [24] hydrocephalus.
12.5 Imaging Findings
A transependymal resorption consists in the reversal of normal transependymal CSF flow that causes a rim of FLAIR/T2 signal hyperintensity. A thick periventricular resorption tends to reflect rapidly progressive hydrocephalus. MR diffusion imaging may demonstrate a periventricular increase in the ADC value without abnormalities on conventional sequences [25–27]. Brain ventricle recess bulging is a common finding in patients with NCH (Fig. 12.6) [28]. The assessment of pericerebral CSF may also be of use in patients with hydrocephalus: Constricted subarachnoid CSF spaces at the brain midline convexity may be observed in patients with CH [3, 29–32].
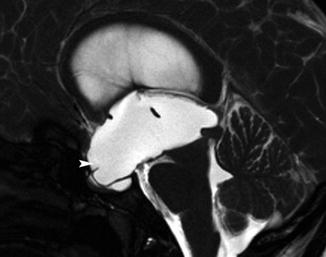

Fig. 12.6
A 36-year-old patient with noncommunicating hydrocephalus due to aqueduct stenosis. Midsagittal slice, true fast imaging. Note the marked dilatation of the anterior (arrowhead) and posterior ventricular recesses. Note to the extension of the anterior recesses to the sella turcica, which appears to be widened
The detection of an obstacle that hinders CSF pathways is a clue for the diagnosis of NCH. The 3D CISS sequence [8] allows for the detection of small lesions such as aqueductal membrane (Fig. 12.7). Phase-contrast and T2-enhanced SSFP sequences can be performed to assess the patency of the CSF pathways. Using T2-enhanced SSFP sequences, a lack of CSF flow-related void sign through the cerebral aqueduct can be observed in patients with aqueductal stenosis.
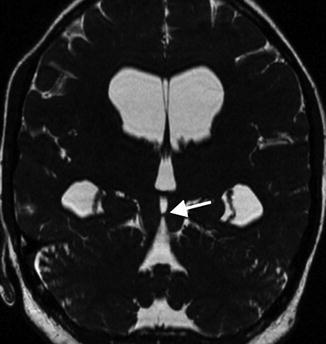

Fig. 12.7
A 31-year-old patient with noncommunicating triventricular hydrocephalus due to an aqueductal stenosis. Oblique plane, CISS sequence that revealed an aqueductal membrane (arrow)
Using gated balanced SSFP sequences, the lack of brain ventricular wall movement assessment appears to be associated with NCH [18]. The patency of a third ventriculostomy can be also assessed using such sequence.
An increased aqueductal flow void is frequently detected on the MR images of patients with CH [33–35]. This artifact is physiological but in NPH would be more extended beyond the aqueduct and foramens of Monro, up to V4. The extent of the flow void on T2-weighted sequences has been correlated with a favorable response to CSF diversion [36]. This artifact is related to the intravoxel dephasing that increases with the intensity of the magnetic field, the echo time, and when spin echo sequences are used [6]. Phase-contrast through-plane sequences can provide information about the CSF flow velocity [22]. Stroke volume, expressed in mL, is defined as the mean CSF volume moving craniocaudad during systole and caudocraniad during diastole. The clinical contribution of stroke volume measurement is controversial, but an increase in stroke volume appears to correlate with a favorable response to ventricular shunting in NPH [22, 37, 38]. Other studies have raised doubts as to its prognostic value [39].
12.6 Conclusion
The diagnosis of hydrocephalus relies on MRI. The first step of the diagnostic work-up consists in ruling out NCH using SSFP sequences. Phase-contrast imaging may provide additional information on CSF flow rate and can contribute to the management of patients with CH.
12.7 Imaging Protocol
Data were obtained using 1.5-T MR (Siemens, Avanto, Erlangen, Germany). The MR protocol was as follows:
Gated true FISP MR sequence: midsagittal plane defined on a transverse slice from the center of the lamina terminalis to the cerebral aqueduct; TR/TE, 78 ms/3 ms; number of excitations, 7; flip angle, 82°; field of view, 160 mm; matrix size, 256 × 256; slice thickness, 2.5 mm; acquisition time from 2 to 4 min; and 20 phases during the R to R interval
Ungated 3D reversed fast imaging with steady-state precession (PSIF): coronal plane; TR/TE, 17 ms/6 ms; number of excitations, 1; flip angle, 30°; field of view, 230 mm; matrix size, 192 × 256; slice thickness, 1 mm; and acquisition time, 2 min 40 s
Stay updated, free articles. Join our Telegram channel

Full access? Get Clinical Tree


